Effects of natural phytoplankton trait diversity on Daphnia spp.
Inaugural-Dissertation zur
Erlangung des Doktorgrades
der Mathematisch-Naturwissenschaftlichen Fakultät der Universität zu Köln
vorgelegt von Maja Ilić
aus Rijeka, Kroatien
Köln, 2019
Berichterstatter: PD Dr. Patrick Fink
Prof. Dr. Michael Bonkowski
Tag der mündlichen Prüfung: 10.05.2019
“Had to have high, high hopes for a living Didn't know how but I always had a feeling I was gonna be that one in a million Always had high, high hopes”
- Brendon Urie (Panic! at the Disco)
Table of contents
Zusammenfassung ... 1
Abstract ... 4
General Introduction and aim of the study ... 6
Chapter 1: Determination of phytoplankton biodiversity in lakes of different trophic state through pigment and fluorescence proxies ... 12
1.1 Introduction ... 13
1.2 Materials and Methods ... 18
1.2.1 Field experiment and sampling ... 19
1.2.2 In vivo fluorometric analysis (Algae Lab Analyser) ... 20
1.2.3 In vitro chromatographic analysis (HPLC) ... 20
1.2.4 CHEMTAX and data analysis ... 22
1.3 Results ... 26
1.3.1 Pigment composition ... 26
1.3.2 CHEMTAX final output ratio matrices ... 26
1.3.3 Total biomass ... 29
1.3.4 Phytoplankton community composition and biodiversity ... 29
1.3.5 Comparison of the biomass estimates from both methods ... 33
1.3.6 CHEMTAX derived phytoplankton diversity including all 6 phytoplankton groups ... 38
1.4 Discussion ... 42
1.4.1 General ... 42
1.4.2 Comparative assessment of methods ... 43
1.4.3 Phytoplankton biodiversity ... 47
1.4.4 Effects of trophic status ... 48
1.4.5 Conclusions ... 49
Chapter 2: Equal relevance of omega-3 and omega-6 polyunsaturated fatty acids for the fitness of Daphnia spp. ... 51
2.1 Introduction ... 52
2.2 Materials and Methods ... 57
2.2.1 Study organisms and cultivation ... 57
2.2.2 Growth experiments ... 57
2.2.3 Fatty acid analyses ... 58
2.2.4 Growth and reproduction saturation thresholds ... 59
2.2.5 Bootstrapping ... 61
2.2.6 Statistical analyses ... 63
2.3 Results ... 64
2.3.1 C20-PUFA-limited growth of Daphnia spp. ... 64
2.3.2 C20-PUFA-limited reproduction of Daphnia spp. ... 65
2.3.3 Intersection points of EPA- and ARA-curves for growth and reproduction ... 68
2.4 Discussion ... 76
2.4.1. C20-PUFA-limited fitness of D. magna ... 76
2.4.2 C20-PUFA-limited fitness of D. pulex ... 77
2.4.3 Interspecific variation ... 78
2.4.4 Intersection points of the saturation curves and potential co-limitation scenarios ... 80
2.4.5 Conclusions ... 81
Chapter 3: Intrapopulation variability in a functional trait: susceptibility of Daphnia to limitation by dietary fatty acids ... 82
3.1 Introduction ... 83
3.2 Materials and Methods ... 85
3.2.1 Daphnia population ... 85
3.2.2 Microsatellites ... 85
3.2.3 Growth experiments ... 87
3.2.4 Data analysis and statistics ... 88
3.3 Results ... 93
3.3.1 Somatic growth rate g ... 93
3.3.2 Susceptibility S ... 94
3.4 Discussion ... 98
3.4.1 Intrapopulation variability ... 98
3.4.2 Susceptibility to limitations by PUFA availability - a functional trait affecting population dynamics in natural Daphnia populations?... 100
3.4.3 Conclusions ... 101
Chapter 4: Effects of phytoplankton diversity on intraspecific competition in
Daphnia – The role of essential dietary fatty acids ... 102
4.1 Introduction ... 103
4.2 Materials and Methods ... 106
4.2.1 Study organism ... 106
4.2.2 Common garden experiment ... 106
4.2.2.1 Experimental design ... 106
4.2.2.2 Growth phase ... 107
4.2.2.3 Grazing phase ... 108
4.2.2.4 Environmental parameters ... 109
4.2.3 Laboratory analyses ... 109
4.2.3.1 Determination of particulate organic carbon (POC) and nitrogen (PON) ... 109
4.2.3.2 Determination of particulate phosphorus (PP) ... 110
4.2.3.3 Chlorophyll a content as a biomass proxy ... 110
4.2.3.4 Physiology of the phytoplankton community ... 110
4.2.3.5 Pigment analysis via high-pressure liquid chromatography (HPLC) ... 111
4.2.3.6 Pigment-derived phytoplankton community composition via CHEMTAX ... 112
4.2.3.7 Phytoplankton community composition derived from microscopic counts ... 114
4.2.3.8 Fatty acid analysis via gas chromatography (GC) ... 114
4.2.3.9 Estimation of Daphnia community composition via microsatellite analysis ... 115
4.2.3.10. Data analysis and statistics ... 117
4.3 Results ... 121
4.3.1 Environmental factors ... 121
4.3.2 Laboratory growth experiments with D. longispina genotypes ... 122
4.3.3 Producer and consumer dynamics ... 124
4.3.4 Stoichiometry ... 126
4.3.5 Start of the grazing phase ... 129
4.3.5.1 Pigment-derived phytoplankton community composition ... 130
4.3.5.2 Seston fatty acid composition ... 130
4.3.5.3 Relationship between phytoplankton diversity and fatty acid
diversity ... 132
4.3.6 Daphnia population dynamics ... 133
4.3.7 Response of Daphnia community to the dietary quality of the phytoplankton community ... 138
4.4 Discussion ... 143
4.4.1 Common garden experiment – General discussion ... 143
4.4.1.1 Stoichiometry ... 143
4.4.1.2 Phytoplankton community composition and fatty acid diversity . 144 4.4.1.3 Producer-consumer dynamics ... 147
4.4.2 Intraspecific competition – does it depend on fatty acid availability? ... 147
4.4.3 Can results from single clone microcosm experiments be transferred to complex natural communities? ... 153
Concluding remarks and perspectives ... 154
References ... 158
Appendix - Supplementary Information ... 183
Record of achievement ... 194
List of publications ... 196
Acknowledgements ... 197
Erklärung (gemäß §4 Abs (1) Nr. 9) ... 200
Curriculum vitae ... 201
1
Zusammenfassung
Durch den anthropogenen Einfluss verursachte Umweltveränderungen zählen zu den größten Antrieben des globalen Biodiversitätverlusts in verschiedenen Arten von Ökosystemen. Während sich unzählige Studien mit dem Einfluss des Biodiversitätverlusts auf die Ökosystemfunktionen befasst haben, ist wenig über die zugrundelegenden Mechanismen hinter der Beziehung zwischen der Biodiversität und den Ökosystemfunktionen bekannt. In den letzten Jahren folgten Studien einer „Trait“- basierten Herangehensweise, bei der die Rolle der Art- und Taxon-spezifischen funktionellen Traits (i.e. Eigenschaften) untersucht wird, wie z.B. die Aufnahme von Ressourcen oder die biochemische Zusammensetzung. Der Verlust solcher Traits verändert die Schlüsselprozesse der Ökosysteme wie Produktivität und Nachhaltigkeit.
In aquatischen Ökosystemen wird vermutet, dass der Biodiversitätverlust auf der Ebene der Produzenten eine kaskadierende Auswirkung auf multiple trophische Ebenen haben könnte. Die Phytoplankton-Zooplankton-Verbindung ist insbesondere vom Interesse, da der Phytoplanktongehalt an mehrfachungesättigten Fettsäuren (PUFAs) entscheidend für die Fitness des herbivoren Grazers Daphnia ist, welche nicht in der Lage ist, solche PUFAs de novo zu synthetisieren. Daher wird vermutet, dass essentielle PUFAs ein funktionelles Phytoplanktontrait sind, welches die Effizienz des trophischen Energietransfers und die Dynamiken zwischen Primärproduzent und Primärkonsument beeinflusst. Allerdings unterscheidet sich die Fettsäurenzusammensetzung des Phytoplanktons zwischen den einzelnen taxonomischen Gruppen. Daher stellte ich die Hypothese auf, dass eine veränderte Phytoplanktongemeinschaft verändernde Effekte auf die Diversität der Fettsäuren haben kann. Dies würde wiederrum den innerartlichen Konkurrenzkampf in Daphnia Populationen beeinflussen.
2
Um diese Hypothesen zu adressieren, wurden zunächst zwei häufig verwendete Methoden für die indirekte Bestimmung der Zusammensetzung der Phytoplanktongemeinschaft verglichen. Aus den erlangten Ergebnissen konnte man schlussfolgern, dass die Pigment-basierte Methode für eine in vitro Bestimmung der Phytoplanktondiversität eine höhere Auflösung der Diversität bietet verglichen zu der spektrofluorometrischen in vivo Methode. Zweitens, konzentrationsabhängige Wachstumsversuche wurden mit zwei verschiedenen Daphnia Arten durchgeführt um die relative Bedeutung zweier C20-PUFAs aus verschiedenen ω-Familien für die Fitness von Daphnien zu vergleichen. Dabei wurden Sättigungskonzentrationen der beiden PUFAs für das Wachstums und die Reproduktion bestimmt und zwischen den beiden Daphnia Arten verglichen. Anders als erwartet, weisen die Daten auf eine gleich starke Bedeutung von ω3- und ω6-PUFAs für die Fitness von Daphnien hin. Drittens, die Variabilität innerhalb einer natürlichen Population von koexistierenden Daphnia longispina Genotypen wurde in Hinsicht auf ihre Anfälligkeit für Fitness-Limitierung durch die Verfügbarkeit der essentiellen PUFAs bestimmt. Dabei wurden zunächst die D. longispina Individuen aus einem oligo-mesotrophen See isoliert und die verschiedenen Genotypen mittels der Mikrosatellitenanalyse identifiziert. Daraufhin wurden Wachstumsexperimente durchgeführt um die juvenile Wachstumsrate der verschiedenen D. longispina Genotypen in An- und Abwesenheit von drei verschiedenen essentiellen PUFAs zu bestimmen. Aus den erlangten Ergebnissen wurde die Anfälligkeit jedes Genotyps für das Vorhandensein der supplementierten PUFAs bestimmt. Dabei wurden innerartliche Unterschiede zwischen den verschiedenen D. longispina Genotypen gefunden.
3
Letztlich wurde ein Common garden Experiment mit einer manipulierten natürlichen Phytoplanktongemeinschaft und natürlich koexistierenden D. longispina Genotypen mit ausgeprägten Unterschieden in Ihrer Anfälligkeit für die Fitness-Limitierung durch die Abwesenheit von PUFAs durchgeführt. Die Daten demonstrieren, dass die Phytoplanktondiversität mit der Diversität von PUFAs korreliert, und dass einzelne PUFAs direkt den innerartlichen Konkurrenzkampf zwischen den getesteten D. longispina Genotypen beeinflussen. Somit deutet diese Studie auf eine potentielle Verbindung zwischen der Diversität der Phytoplankton-Traits (im Sinne von PUFA Verfügbarkeit) und den Dynamiken innerhalb der Daphnia Population hin.
4
Abstract
Anthropogenically induced environmental changes are ranked among the major drivers of global biodiversity loss in different types of ecosystems. While there have been numerous studies that examined the impact of biodiversity loss on ecosystem functioning, it is still not much known about the underlying mechanisms behind the biodiversity-ecosystem functioning relationship. In recent years, studies started to follow a trait-based approach, i.e. examining the role of species and taxon specific functional traits, such as resource uptake or biochemical composition. Loss of such traits has been shown to alter key processes of ecosystems, such as productivity and sustainability. In aquatic ecosystems, biodiversity loss on producer level is believed to have cascading effects on multiple trophic levels. In particular the phytoplankton- zooplankton interface is of high interest, as the phytoplankton content of dietary polyunsaturated fatty acids (PUFAs) was found to be crucial for the fitness of the herbivorous grazer Daphnia, which is not capable of de novo synthesis of such PUFAs.
Essential PUFAs are thus assumed to be a functional phytoplankton trait that affects the trophic transfer efficiency and dynamics between the primary producers and consumers. However, fatty acid composition of phytoplankton was shown to be taxon- specific. Thus, I hypothesized that altered phytoplankton community composition will result in an altered composition of dietary fatty acids. This in turn will affect the intraspecific competition in Daphnia. To address these hypotheses, I first compared two commonly used methods for the indirect assessment of the phytoplankton community composition. From the obtained results, I concluded that the pigment-based method for the in vitro estimation of phytoplankton diversity provides a higher resolution compared to the in vivo method based on fluorescence spectra.
5
Second, I performed dose-response growth experiments with two different Daphnia species in order to compare the relevance of two C20-PUFAs from different ω-families for Daphnia’s fitness. I estimated the growth and reproduction saturation thresholds of both PUFAs and compared these between the species. Other than expected, the results of my experiments provide evidence for equal relevance of ω3- and ω6-PUFAs for Daphnia.
Third, I assessed the intrapopulation variability in susceptibility of naturally coexisting Daphnia longispina genotypes to limitations by the availability of essential dietary PUFAs. I first isolated D. longispina individuals from an oligo-mesotrophic lake and identified different genotypes via microsatellite analyses. Subsequently, I performed standardized growth assays and determined the juvenile somatic growth rate of different D. longispina genotypes in presence and absence of three different essential PUFAs. From the obtained data, I estimated the susceptibility of each genotype to the availability of supplemented PUFAs and found intraspecific differences between the tested D. longispina genotypes. Finally, I performed a common garden experiment with diversity-manipulated natural phytoplankton community and naturally coexisting D. longispina genotypes with pronounced differences in their susceptibility to limitations by essential dietary fatty acids. The obtained data demonstrate that the phytoplankton diversity is correlated with the composition of polyunsaturated fatty acids (PUFAs), and that single PUFAs directly affect competitive interactions between the tested D.
longispina genotypes. Therefore, the present study provides evidence for a potential link between phytoplankton trait diversity (in terms of PUFA availability) and Daphnia’s population dynamics.
6
General Introduction and aim of the study
Anthropogenically induced environmental changes, such as global warming and eutrophication, are ranked among the major drivers of global biodiversity loss in different types of ecosystems (Cardinale et al., 2006; Cardinale, 2012; Loreau, 2001, 2010; Naeem et al., 2009; Hooper et al., 2012). While there have been numerous studies that examined the impact of species loss on ecosystem functioning and community dynamics, it is still not much known about the underlying mechanisms behind the biodiversity-ecosystem functioning relationship. Therefore, novel approaches were developed to provide new insights into processes coupled with the response of ecosystem properties to species loss and allow for further predictions on the consequences of the ongoing global diversity decline.
Trait-based approaches are more and more frequently applied to study mechanisms that link ecosystem functioning, community structure and eco-evolutionary dynamics within various ecosystems (Fussmann et al., 2007; Litchman and Klausmeier, 2008; Litchman et al., 2013). Such studies address different levels of organization and complexity, ranging from individuals to whole populations and ecosystems (Ackerly and Cornwell, 2007;
Litchman et al., 2007, 2010). In this context, traits are defined as measurable morphological, physiological or phenological characteristics of an organism, while functional traits are considered to affect the organismal growth, reproduction and survival, thus affect its fitness and performance (McGill et al., 2006; Violle et al., 2007;
Cadotte et al., 2015). Loss of such traits has been shown to alter key processes of ecosystems, such as productivity and sustainability (Striebel et al., 2009b, 2009a).
7
Furthermore, functional traits are crucial for the response of an individual to the surrounding environment and may play an important role in intra- and interspecific interactions (Jung et al., 2010; Bolnick et al., 2011; Violle et al., 2012). Variability in a functional trait within and among species is the basis for competition and selection and thus a driver of evolution in natural populations.
In previous studies, it has been shown that, although often underestimated or neglected, intraspecific variability occurs within populations in both terrestrial (Eichenberg et al., 2015; Bu et al., 2017) and aquatic ecosystems (De Bruin et al., 2004; White et al., 2011;
Werner et al., 2018). For example, White et al. (2011) documented an intraspecific variation in vulnerability of co-occuring genotypes of the toxic and colony-forming cyanobacterium Microcystis aeruginosa to herbivory by the filter-feeding zebra mussel Dreissena polymorpha. Furthermore, with a combination of single-trait and multi-trait analyses of five functional traits measured for 13 plant species, Albert et al. (2010) found a pronounced intraspecific variation, accounting for approximately 30% of the overall trait variability. Within a single species, a high variation in a functional trait (given either as genetical diversity or phenotypic plasticity) can promote coexistence of different genotypes by decreasing their niche overlap (Violle and Jiang, 2009; Bolnick et al., 2011). On the other hand, given that the trait-variation arises from genetic variation, such standing genetic diversity may promote local adaptation and increase the resilience to changing environmental conditions and other biotic and abiotic factors such as predation risk, toxicity and resource availability (Barrett and Schluter, 2008;
Jung et al., 2010), thus buffering biodiversity losses (Reusch, 2005; Albert et al., 2010).
8
The water flea Daphnia, a herbivorous crustacean zooplankton, is a well established model organism in ecology, in particular regarding trophic interactions and effects of trait-variation on eco-evolutionary dynamics (Hairston et al., 1999; Ebert, 2011; Stoks et al., 2016). Daphnia is a key species in freshwater food webs, as it feeds directly on phytoplankton and serves as a food source for planktivorous fish (Gaedke and Straile, 1998). Under optimal environmental conditions, Daphnia spp. produce clonal females through parthenogenesis (Stross and Hill, 1965). As Daphnia are non-selective filter feeders (DeMott, 1986), their fitness depends strongly on the diet present.
Two major factors that determine the nutritional value and thus the food quality of Daphnia’s diet are the elemental and biochemical composition of the phytoplankton (Ahlgren et al., 1990a; Müller-Navarra, 1995a; Park et al., 2002; Becker and Boersma, 2003). Besides dietary carbon to nutrient ratios (Sterner et al., 1993; Urabe et al., 1997;
Ravet and Brett, 2006), Daphnia’s performance has often been associated with the availability of polyunsaturated fatty acids (PUFAs) in their diet (Müller-Navarra, 1995b;
Wacker and von Elert, 2001; von Elert, 2002), i.e. fatty acids with two or more double bonds in their carbon chain. Essential PUFAs are thus assumed to be a functional phytoplankton trait that affects the trophic transfer efficiency and dynamics between the primary producers and consumers. However, fatty acid composition of the phytoplankton was shown to be taxon-specific (Ahlgren et al., 1990a; Lang et al., 2011).
Therefore, biodiversity loss on producer level might result in a decreased trait diversity, which can have cascading effects on multiple trophic levels. Furthermore, the outcome of such cascading effects on the level of consumers might depend of consumer’s specific functional traits coupled to their fitness and susceptibility to limitations by poor food quality.
9
In Chapter 1, I compare two methods commonly used to indirectly determine the phytoplankton community composition. This is of particular interest, as the estimation of producer’s diversity builds the basis of trait-based approaches addressing cascading effects of biodiversity loss on other trophic levels. Although other methods are available, such as microscopic counting or DNA metabarcoding, they have several disadvantages which make them unsuitable for fast assessment of the phytoplankton community complexity. Therefore, I discuss the advantages and disadvantages of a pigment-based method, which includes extraction and separation of phytoplankton pigments and subsequent complex algorithmic calculations via the matrix-factorization program CHEMTAX. On the other hand, I present the data obtained from a spectrofluorometric method and compare both methods in terms of reliability and resolution regarding the estimated phytoplankton diversity.
In Chapter 2, via dose-response growth experiments, I compare two C20-PUFAs from different ω-families, namely eicosapentaenoic acid (EPA, 20:5 ω3) and arachidonic acid (ARA, 20:4 ω6), regarding their relevance for the fitness of two Daphnia species.
Although EPA has been shown previously to strongly affect the fitness of different Daphnia species (von Elert, 2002; Becker and Boersma, 2003; Ravet et al., 2012), the role of ARA is not yet clear, which is apparent from inconsistent findings in the present literature.
In Chapter 3, I assess the intrapopulation variability in susceptibility of naturally coexisting Daphnia longispina genotypes to availability of α-linolenic acid (ALA, 18:3 ω3), EPA and ARA. Here, susceptibility is suggested to be a consumer’s functional trait that might affect intraspecific competition and community dynamics within natural Daphnia populations.
10
Finally, in Chapter 4, I perform a common garden experiment to study effects of biodiversity on phytoplankton functional trait diversity. Such biodiversity loss is suggested to alter the food quality of the phytoplankton and result in a decreased PUFA availability and diversity, which in turn might affect the population dynamics of the consumer. On the other hand, the susceptibility of different D. longispina genotypes, assessed in Chapter 3, might affect the outcome of competitive interactions within the Daphnia community. I discuss the role of sestonic PUFA content (i.e. phytoplankton functional trait) and Daphnia’s susceptibility to limitations by PUFA availability (i.e.
consumer functional trait) as potential links between biodiversity and ecosystem functioning.
In summary, the present study follows a trait-based approach to study possible links and mechanisms behind the biodiversity-ecosystem functioning relationship in aquatic ecosystems. Furthermore, this study allows for suggestions on improvement of phytoplankton diversity assessment and provides evidence for an equal relevance of a ω3- and ω6-PUFAs for the fitness of Daphnia spp.. Finally, this thesis addresses the role of intraspecific variation in a fitness-related functional trait for competitive interactions and provides evidence for a potential link between phytoplankton trait diversity (in terms of PUFA availability) and Daphnia’s population dynamics.
11
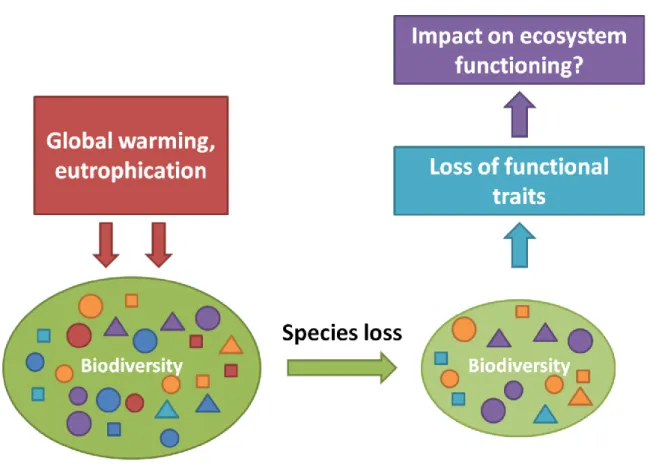
Fig. I: The general concept illustrating the potential role of functional traits as a link between biodiversity loss and ecosystem functioning.
12
Chapter 1
Determination of phytoplankton biodiversity in lakes of different
trophic state through pigment and fluorescence proxies
13
1.1 Introduction
Phytoplankton community composition has often been used as an indicator of the ecosystem productivity and trophic status of lakes (Reynolds et al., 2002) and of food quality for e.g. herbivorous zooplankton (Behl and Stibor, 2015). In the past few decades, the global biodiversity has experienced a strong decline (Cardinale, 2012;
Hooper et al., 2012). One of the major drivers of global biodiversity loss is the anthropogenic eutrophication, which further causes the formation of cyanobacterial blooms (Hooper et al., 2012; O’Neil et al., 2012). Such cyanobacterial blooms can be toxic, as some cyanobacteria are producing toxins like microcystins, anatoxins, cylindrospermopsin and nodularins, with microcystins being the most commonly detected cyanobacteria toxin (Pilotto et al., 2004; Koreivienė et al., 2014; Zamyadi et al., 2016). Microcystins have been shown to be carcinogenic and cause liver damage ((Falconer et al., 1994; Falconer, 2005; Koreivienė et al., 2014). Thus, the formation of toxic, in particular microcystin-rich cyanobacterial blooms, may have negative impacts on ecosystem properties and services such as the provision of drinking water (Jurczak et al., 2005). To ensure the sustainable use of aquatic ecosystems and to manage the water treatment operations, the European Community legislation has introduced the EU Water Framework Directive (WFD, Directive 2000/60/EC). The WFD defines the composition of the phytoplankton community as one of the most important biological parameters that determine the quality and ecological status of surface water bodies (Sarmento and Descy, 2008; Catherine et al., 2012; Escoffier et al., 2015). Because of the rapid respond of the phytoplankton community to environmental changes (Richardson et al., 2010) and a usually high number of samples that have to be processed, it is necessary to use time saving methods for the assessment of phytoplankton community composition and
14
in particular the monitoring of cyanobacteria abundances. This is of high importance, as the time delay between sampling and data processing has to be as short as possible, to ensure a fast management of necessary water treatment actions. Traditionally, the phytoplankton community composition is estimated via microscopic counting. However, this method is extremely time consuming and highly depended on the taxonomic knowledge of the respective person who identifies and counts the phytoplankton taxa.
Also, phytoplankton of a small size (picoplankton, < 5 µm) cannot be differentiated accurately(Groendahl et al., 2017). Another approach, which is new and not yet completely implemented, is DNA metabarcoding, e.g. using 18S rDNA. Although this method could help to distinguish between small phytoplankton species, it is still very costly and limited by available databases that still lack many reference sequences (Simmons et al., 2016; Groendahl et al., 2017). Thus, chemotaxonomic alternatives have been proposed, such as pigment-based spectrofluorometry and high pressure liquid chromatography (HPLC) of pigments. Both approaches are based on the differences in pigment composition of the main phytoplankton groups. For example, Dinoflagellates contain the pigment peridinin, which is a Dinoflagellate-specific pigment, while alloxanthin and lutein are pigments that are group-specific for Cryptophytes and Chlorophytes, respectively (Gieskes and Kraay, 1983). Thus, the pigment composition of the phytoplankton is commonly used for the assessment of phytoplankton community composition. The advantage of both methods is that they are less time consuming then microscopy or DNA metabarcoding. However, they only allow for a relatively low taxonomic resolution (class level, compared to microscopy and DNA metabarcoding which both allow for genus or even species level).
15
Traditionally, fluorescence-based chlorophyll a quantification methods were applied for both in vitro and in vivo (Yentsch and Menzel, 1963; Yentsch and Phinney, 1985) measurements of chlorophyll a. Subsequently, spectrofluorometric methods that use multiple excitation and/or emission wavelengths were developed and became the standard application for phytoplankton monitoring (Beutler et al., 2002; Richardson et al., 2010). The chlorophyll a fluorescence is mostly determined by the peripheral and core antennae of photosystem II (Beutler et al., 2002). While the evolutionarily conserved core antenna contains the chlorophyll a molecules in all phytoplankton taxa, the peripheral antenna includes species-dependent light-absorbing accessory pigments, which are responsible for selective excitation spectra and thus represent the fundament of the spectrofluorometric differentiation of phytoplankton groups. Based on these observations, Beutler et al. (2002) introduced a novel spectrofluorometer, the Algae Lab Analyser (bbe Moldaenke, Kiel, Germany) as a bench-top device which is commonly used by water authorities and routine laboratories. The Algae Lab Analyser contains five different light-emitting diodes (LEDs) with λ 450 nm, 525 nm, 570 nm, 590 nm and 610 nm, respectively. Based on the group-specific excitation spectra, also called norm spectra, the Algae Lab Analyser allows for differentiation of four spectral groups: the green group (Chlorophytes), the blue-green group (Cyanobacteria), the brown group (Chromophytes, which includes Chrysophytes, Diatoms and Dinoflagellates) and mixed- group (Cryptophytes and phycoerythrin-containing algae, Beutler et al., 2002).
Calculation of the contribution of each phytoplankton group to the total chlorophyll a is based on linear unmixing (solving linear equations). For details and algal species used to determine norm spectra and calculation algorithms for all four spectral algal groups, see Beutler et al. (2002). The in vivo measurement is very fast (few minutes) and the data is transferred online to a PC or lap top. Using the actual five-point excitation spectrum of a
16
water sample, the allocation of the measured chlorophyll a concentration to the four phytoplankton groups is rapidly obtained. Thus, Algae Lab Analyser seems to be very suitable for fast monitoring and assessment of the phytoplankton community composition.
Another commonly used method for the assessment of the phytoplankton community composition is the HPLC analysis of photopigments, combined with the matrix factorization programme CHEMTAX. HPLC is not only a fast and cost-effective alternative to microscopic counts, but also allows for identification of species that are usually not detectable by microscopic counting (e.g. picoplankton), as the detection limits of diagnostic pigments are usually low (Schlüter et al., 2016). The HPLC approach to analyze the pigment composition of phytoplankton communities has been widely used and is nowadays often combined with the matrix factorization programme CHEMTAX, which was developed in 1996 by Mackey et al. for marine systems, but has been used and updated since then for both marine and freshwater ecosystems (Descy et al., 2000, 2009; Buchaca, 2004; Lewitus et al., 2005; Sarmento and Descy, 2008;
Lauridsen et al., 2011; Armbrecht et al., 2015; Schlüter et al., 2016). The CHEMTAX approach is based on group-specific pigments (e.g. peridinin, lutein etc. as mentioned above) and uses input ratio matrices containing ratios of such pigments to chlorophyll a, which can be found in the literature. For example, Schlüter et al. (2006) provide an excellent summary on pigment : chlorophyll a ratios of several freshwater phytoplankton groups, estimated in laboratory cultures, which have been cultured under different light intensities, to account for different environmental conditions that can cause changes in pigment : chlorophyll a ratios of the phytoplankton species.
Recently, such ratio matrices have been developed using data from 46 German lakes along a phosphorus gradient (oligotrophic, mesotrophic and eutrophic lakes) by
17
Schlüter et al. (2016). Depending on the pigment ratio matrix and observed concentrations of the pigments, CHEMTAX provides the best fit of contributions of the predefined phytoplankton groups to the total chlorophyll a concentration and is able to differentiate between more than 4 groups (to which the Algae Lab Analyser is limited).
The number of discernible groups by CHEMTAX depends on the number of analyzed diagnostic pigments and the previous knowledge about the phytoplankton community composition of the water body of interest (Mackey et al., 1996).
Both the Algae Lab Analyser and the HPLC/CHEMTAX approach are limited in the taxonomic resolution, as they only allow a differentiation on the group level. This may not be a major constraint, as multiple studies have shown functional phytoplankton diversity to be a better predictor of ecosystem functioning than species richness (Striebel et al., 2009b; Behl et al., 2011; Stockenreiter et al., 2013). This means that both approaches might be good alternative tools to assess the phytoplankton community composition and investigate research questions. In particular for cyanobacteria monitoring, many different methods have been used, e.g. microscopic counting, quantitative polymerase chain reaction (qPCR), pigments extraction and fluorometric probes. An excellent review of such methods as well as further recommendations and proposals on cyanobacterial monitoring were recently summarized by Zamyadi et al.
(2016). Furthermore, some studies compared the suitability of spectrofluorometry and HPLC/CHEMTAX for the assessment of the phytoplankton community composition, e.g.
usage of the bbe Moldaenke FluoroProbe (Catherine et al. 2012) and the bbe Moldaenke Algae Online Analyser (Richardson et al. 2010) compared to CHEMTAX-derived community composition data. However, both these studies did not compare lakes across a gradient of trophic status, which is done here for the first time.
18
We here focused on the following specific hypotheses: (i) both methods give a good representation of the phytoplankton community composition, (ii) CHEMTAX allows for a higher resolution of the phytoplankton biodiversity as it can distinguish between more than four taxonomic groups depending on the specific marker pigment calibrated and (iii) the Algae LabAnalyser allows a more accurate determination of cyanobacteria, as the lipophilic solvent extraction of pigments used for the HPLC method does not capture the water-soluble cyanobacterial pigments phycocyanin and phycoerythrin.
19
1.2 Materials and Methods
1.2.1 Field experiment and sampling
During the summer in 2014, we simultaneously conducted large-scale mesocosm field experiments in three lakes of different trophic state situated in Upper Bavaria (Germany): Brunnsee (47° 59’ 01” N, 12° 26’ 12” E, area: 5.8 ha, maximal depth: 20 m), Klostersee (47° 58’ 26” N, 12° 27’ 10” E, area: 47.0 ha, maximal depth: 16 m) and Thalersee (47° 54’ 16” N, 12° 20’ 17” E, area: 3.8 ha, maximal depth: 7 m, Fig. S1).
Depending on the average epilimnetic total phosphorus concentration (TP, ± standard deviation) determined in summer 2014 Brunnsee can be classified as an oligotrophic (TP = 5.62 ± 1.09 µg L-1), Klostersee as an oligo-mesotrophic (TP = 9.88 ± 2.47 µg L-1) and Thalersee as a mesotrophic lake (16.80 ± 5.18 µg L-1, Nürnberg, 1996).
The mesocosms were made of white plastic foil, forming cylindrical enclosures closed at the bottom and open at the top to allow for gas exchange with the atmosphere. They had a diameter of 0.95 m and a length of 5 m (Thalersee) and 6 m (Brunnsee and Klostersee), resulting in a total volume of approx. 3.5 – 4.2 m³, respectively. Per lake, 20 mesocosms were installed and filled with surrounding water from the respective lake, which was pre-filtered over a 250 µm gaze, to exclude zooplankton and thus prevent grazing. We used disturbances of the water column via compressed air to manipulate the natural phytoplankton community in the mesocosms, in order to establish a diversity gradient (Flöder and Sommer, 1999; Hammerstein et al., 2017). We regularly (usually once a week) took water samples from the mesocosms and from the lake itself, using a 2 L integrated water sampler (KC Denmark), from the depth of 0.5 m to 2.5 m.
20
The water samples were transported to the laboratory and were kept cool and dark until further analyses (within a few hours). In total, we analyzed 562 samples (186 from Brunnsee, 187 from Klostersee and 189 from Thalersee).
1.2.2 In vivo fluorometric analysis (Algae Lab Analyser)
The fluorometric measurement of the chlorophyll a concentration was done using the Algae Lab Analyser (bbe Moldaenke). For this, the water samples were carefully shaken and 25 ml were transferred into a cuvette and measured in vivo, using the manufacturer’s default settings. The bbe++ Windows software was used to calculate the best sum of the four specific excitation norm spectra (corresponding to the four phytoplankton groups: Chlorophytes, Chromophytes, Cryptophytes and Cyanobacteria) from the measured fluorescence signal. With this, we obtained the contribution of each of the four phytoplankton groups to the total chlorophyll a concentration, given in micrograms per liter. For details on calibration of the fluorometer, default settings and mathematical equations used for the calculation of the contribution of the four phytoplankton groups to the total chlorophyll a, see Beutler et al. (2002).
1.2.3 In vitro chromatographic analysis (HPLC)
For the HPLC analyses, up to 1000 ml of the water samples from the lakes were filtered onto precombusted glass fiber filters (VWR GF/F, Ø 25 mm). The filters were wrapped in aluminium foil and stored at -20 °C until analysis. Seston samples were extracted with each 3.5 ml 100% acetone (Alfa Aesar, HPLC grade), sonicated for 2 min and then placed on ice for 1 min. This was repeated 5 times, resulting in a total of 10 min sonication and extraction time. Subsequently, the filters were kept at 4°C over night to allow for further extraction. On the following day, the filters were removed from the tubes and the
21
extracts were centrifuged for 15 min at 4500 x g (Eppendorf Centrifuge 5804) to remove cell and filter debris. 1 ml of the extracts were transferred to new tubes, evaporated to dryness under a gentle stream of nitrogen gas, re-dissolved in 100 µl acetone and transferred to HPLC vials. To correct for sample loss during the evaporation, we used trans-β-apo-8’-carotenal (Sigma Aldrich) as an internal standard (ISTD). We added 100 ng of the ISTD to 1 ml of extract prior to evaporation. 25 - 50 µl per sample were injected into the HPLC system. All samples were measured within 72 hours after extraction.
A Prominence HPLC System from Shimadzu equipped with a binary pump (LC-20AB), an autosampler SIL-A20C, a column oven CTO-10AC set at 40°C and a diode array detector (PDA) SPD-M20A was used for the analysis of phytoplankton pigments. We used a reverse phase Spherisorb ODS2 column (stationary octadecyl-phase (C18), dimensions:
25 cm x 4.6 mm, particle size: 5 µm). The pigments were separated with a method modified after Garridol and Zapata (1993): The solvents used were methanol : 1 M ammonium acetate : acetonitrile (50:20:30, v/v, Solvent A) and acetonitrile : ethyl acetate (50:50, v/v, Solvent B). The gradient system used was as follows: 0 min: A: 90%, B: 10%; 2 min: A: 90%, B: 10%; 26 min: A: 40%, B: 60%; 28 min: A: 10%, B: 90%; 30 min: A: 10%, B: 90%. The composition of the solvents was returned to initial conditions over a 1 min gradient, followed by 2 min of system re-equilibration before the next sample was injected. The flow rate was 1 ml min-1. Absorbance was recorded in the PDA from 350 to 700 nm. Pigments were identified by the retention times and the absorption spectra, which were obtained from previous measurements of the pure pigment standards. Peak areas were integrated at 436 nm and corrected for internal standard.
For the quantification of the pigments, calibration curves were estimated by measuring at least 5 different amounts of each pigment standard in triplicates and fitting a linear regression between the amount of the pigment and the observed peak area at 436 nm.
22
We determined the limit of detection and the limit of quantification as described in Hooker et al. (2005).
Based on our previous knowledge on phytoplankton groups that are usually present in the examined lakes (data from long-term monitoring), we chose 10 pigment standards, of which 9 were obtained from DHI Water (Hoersholm, Denmark): alloxanthin (marker pigment for Cryptophytes), β-carotene, chlorophyll a, chlorophyll b (marker pigment for Chlorophytes), diatoxanthin, echinenone (marker pigment for Cyanobacteria), fucoxanthin (marker pigment for Chrysophytes and Diatoms), lutein (another marker pigment for Chlorophytes) and zeaxanthin (usually used as the only marker pigment for Cyanobacteria (Havskum et al., 2004; Llewellyn, 2004; Lewitus et al., 2005), but also shared with other groups like Chlorophytes). Peridinin (marker pigment for Dinoflagellates, extracted from Symbiodinium spp. following the protocol from Rogers and Marcovich, 2007) was kindly provided by D. Langenbach from the group of M. Melkonian at the University of Cologne. With the solvent gradient described above, we were able to separate all pigment peaks to the baseline except for lutein and zeaxanthin (Fig. 1.1). Although well separated, diatoxanthin was excluded from the subsequent CHEMTAX analysis as it was detected in very low amounts and in only few samples. Also, we excluded β-carotene as it did not have any effect on the output data (previous CHEMTAX runs, data not shown).
1.2.4 CHEMTAX and data analysis
The recently published (Schlüter et al. 2016) pigment : chlorophyll a ratio matrices had been established for oligo- and for meso- and eutropic lakes, including all three lakes from our study. These ratio matrices should thus be highly suitable for our study and were used in the present study to calculate the contribution of six phytoplankton
23
groups, namely Chlorophytes, Cryptophytes, Cyanobacteria, Chrysophytes, Diatoms and Dinoflagellates, to the total chlorophyll a via CHEMTAX (Mackey et al., 1996; version 1.95 provided by S. Wright).
For the CHEMTAX calculations, 60 different ratio matrices were generated from the initial ratio matrices (separately for the oligotrophic lake and for the oligo- meso/mesotrophic lakes). 10% (n=6) of the matrices with the lowest residual root mean square (RMS) were averaged and used as new input ratio matrices. The runs were repeated using final ratio matrices from every previous run as input ratio matrix for the next run. This was repeated until the ratios became stable. For details on this procedure, see Latasa (2007) and Higgins et al. (2011). The parameters used within CHEMTAX were set as recommended by Mackey et al. (1996) and S. Wright (pers. comm.): ratio limits:
500 (this allowed initial pigment ratios to vary from r/6 to 6r, in total a 36-fold change), weighting: bounded relative (error by pigment, see Latasa, 2007), iteration limit: 100, epsilon limit: 0.0001, initial step size: 10, step ratio: 1.3, cutoff step: 100, elements varied: 5, subiterations: 1, weight bound: 30. For explanations, see Mackey et al. (1996).
Subsequently, we used the HPLC derived pigment concentrations and the CHEMTAX derived biomasses of the phytoplankton groups (in units of chlorophyll a) to calculate Shannon-Diversity Indices as estimates of pigment and phytoplankton diversity (Shannon and Weaver, 1949). For this, we used the equation (Eq. 1):
𝐻′ = − ∑ 𝑝i × ln(𝑝i)
where pi is the proportion of the pigment or phytoplankton class relative to the total amount of the pigments or the total biomass, respectively.
24
When the Shannon-Diversity Indices were calculated from the CHEMTAX data, we followed two approaches: first, we summed up the contribution of Chrysophytes, Diatoms and Dinoflagellates to the total chlorophyll a to one single data point per sample, which was comparable to the biomass estimates of Chromophytes via Algae Lab Analyser. With this, we were able to calculate and compare the Shannon-Indices based only on the biomass estimates of the four groups (Chlorophytes, Chromophytes, Cryptophytes and Cyanobacteria) from both methods (spectrofluorometrically and chromatographically estimated biomass). The second approach was to calculate the Shannon-Indices using the biomass estimates for all 6 phytoplankton groups, as CHEMTAX was able to discriminate between the subgroups of the Chromophytes (see above).
To compare the biomass (given as total chlorophyll a, in the following abbreviated as TChl a) and biodiversity estimates from the Algae Lab Analyser with those from HPLC and CHEMTAX, we estimated the Spearman correlation coefficient, rs, as the data was not normally distributed. Additionally, we calculated the ratio between the estimates from the Algae Lab Analyser and CHEMTAX, RLAB/CHEM. The ratios and the biodiversity estimates were tested for normality with the Shapiro-Wilk’s test, while the homogeneity of variances was tested with Levene’s test. We performed one-way ANOVAs for all four phytoplankton groups, with the ratio RLAB/CHEM as the dependent variable and trophic status of the lakes as the independent variable, followed by the Tukey’s HSD post hoc test (α = 0.05). Alternatively, when the data was not normally distributed and variances were heterogeneous, we applied the nonparametric Kruskal-Wallis test on both the ratios RLAB/CHEM and the biodiversity estimates, followed by Dunn’s post hoc test. For all calculations, statistics and figures, we used R (version 3.3.2, R Core Team, 2016) and RStudio (version 1.1.383, RStudio Team, 2016).
25
Fig. 1.1: HPLC chromatogram recorded at 436 nm. Shown are peaks of the pigments peridinin (Peri), fucoxanthin (Fuco), alloxanthin (Allo), diatoxanthin (Dtx), lutein (Lut), zeaxanthin (Zea), chlorophyll b (Chl b), chlorophyll a (Chl a), echinenone (Echi) and β-carotene (β-Caro). The pigment standard trans-β- apo-8’-carotenal was used as an internal standard (ISTD) and was well separated from the other pigments.
26
1.3 Results
1.3.1 Pigment composition
The most abundant pigment in the oligotrophic lake was zeaxanthin (37%), followed by fucoxanthin (36%), while the relative abundance of alloxanthin (marker pigment for the Cryptophytes) was even below 0.5%. In both the oligo-mesotrophic and the mesotrophic lake, the most abundant pigment was fucoxanthin (34% and 30%, respectively). Also, in both lakes, zeaxanthin and chlorophyll b (maker pigment for the Chlorophytes) were found in high relative abundances (Fig. 1.2). While peridinin (marker pigment for the Dinoflagellates) was moderately abundant in both the oligotrophic (14%) and the mesotrophic (16%) lake, we found only 1% of peridinin in the oligo-mesotrophic lake.
The pigment diversity per sample ranged from 0.57 to 1.39 and was on average 1.11.
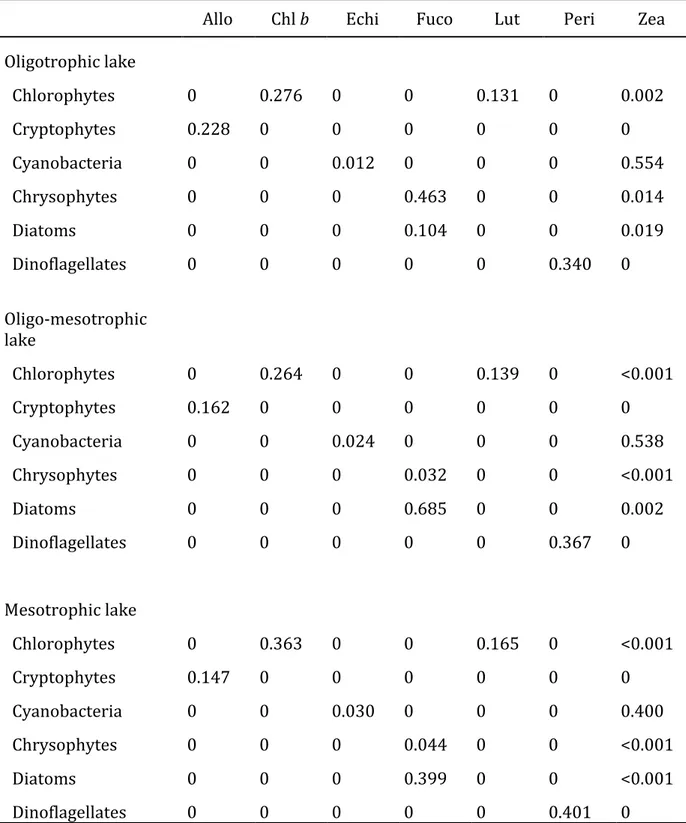
1.3.2 CHEMTAX final output ratio matrices
The final output ratio matrices from CHEMTAX calculations for all three lakes can be found in the Tab. 1.1. Both the final output peridinin : chlorophyll a and echinenone : chlorophyll a ratios were lower in all three lakes compared to the input ratios from Schlüter et al. (2016).
The zeaxanthin : chlorophyll a ratios for the Cyanobacteria were found to be higher in the output ratio matrices from the oligotrophic and the oligo-mesotrophic lake, while the final output zeaxanthin : chlorophyll a and chlorophyll b : chlorophyll a ratios for the Chlorophytes were lower compared to the input ratios. In the mesotrophic lake, the opposite was the case.
27
While the fucoxanthin : chlorophyll a ratios between the Diatoms and the Chrysophytes were similar in both input ratio matrices, the ratios changed during the CHEMTAX calculations: in the oligotrophic lake, the final output fucoxanthin : chlorophyll a ratio for Chrysophytes was higher than the fucoxanthin : chlorophyll a ratio for Diatoms (0.463 and 0.104, respectively). Interestingly, in both the oligo-mesotrophic and the mesotrophic lake, the final output fucoxanthin : chlorophyll a ratio for Chrysophytes was found to be much lower than the fucoxanthin : chlorophyll a ratio for Diatoms (0.032 and 0.685 in the oligo-mesotrophic lake and 0.044 and 0.399 in the mesotrophic lake, respectively).
Fig. 1.2: Pigment composition of the natural phytoplankton communities of the lakes Brunnsee (oligotrophic), Klostersee (oligo-mesotrophic) and Thalersee (mesotrophic). Shown are relative abundances of pigments alloxanthin, chlorophyll b, echinenone, fucoxanthin, lutein, peridinin and zeaxanthin, given as an average over the whole duration of the experiment, including both mesocosms and the lake itself.
28
Tab. 1.1: Final pigment : chlorophyll a ratio matrices after CHEMTAX calculations for each of the lakes:
oligotrophic (Brunnsee), oligo-mesotrophic (Klostersee) and mesotrophic lake (Thalersee). Allo:
alloxanthin, Chl b: chlorophyll b, Echi: echinenone, Fuco: fucoxanthin, Lut: lutein, Peri: peridinin, Zea:
zeaxanthin.
Allo Chl b Echi Fuco Lut Peri Zea
Oligotrophic lake
Chlorophytes 0 0.276 0 0 0.131 0 0.002
Cryptophytes 0.228 0 0 0 0 0 0
Cyanobacteria 0 0 0.012 0 0 0 0.554
Chrysophytes 0 0 0 0.463 0 0 0.014
Diatoms 0 0 0 0.104 0 0 0.019
Dinoflagellates 0 0 0 0 0 0.340 0
Oligo-mesotrophic lake
Chlorophytes 0 0.264 0 0 0.139 0 <0.001
Cryptophytes 0.162 0 0 0 0 0 0
Cyanobacteria 0 0 0.024 0 0 0 0.538
Chrysophytes 0 0 0 0.032 0 0 <0.001
Diatoms 0 0 0 0.685 0 0 0.002
Dinoflagellates 0 0 0 0 0 0.367 0
Mesotrophic lake
Chlorophytes 0 0.363 0 0 0.165 0 <0.001
Cryptophytes 0.147 0 0 0 0 0 0
Cyanobacteria 0 0 0.030 0 0 0 0.400
Chrysophytes 0 0 0 0.044 0 0 <0.001
Diatoms 0 0 0 0.399 0 0 <0.001
Dinoflagellates 0 0 0 0 0 0.401 0
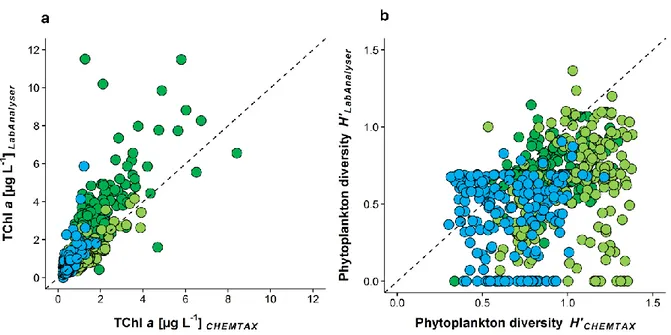
29 1.3.3 Total biomass
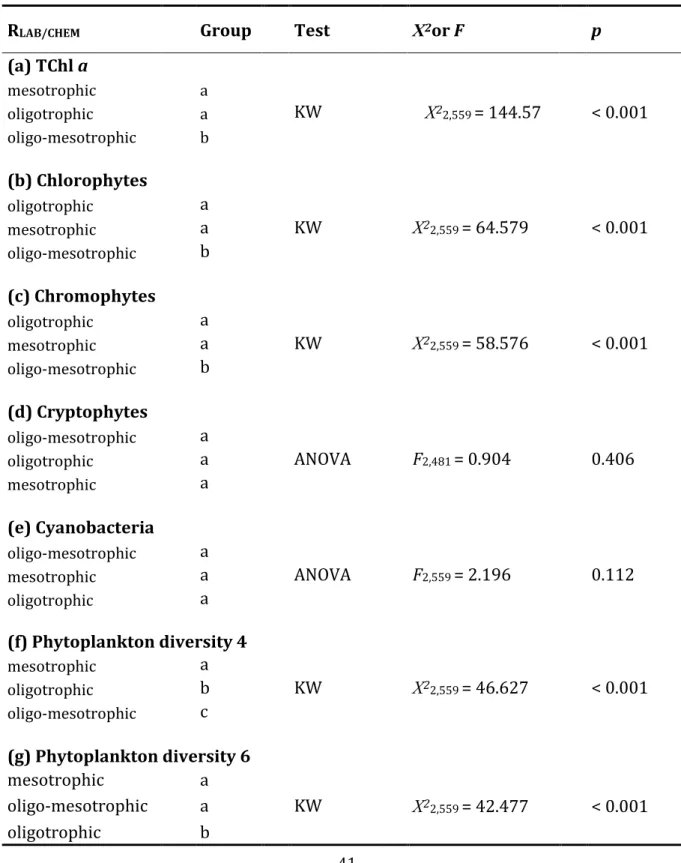
The biomasses per sample, given as TChl a, ranged between 0.01 and 11.51 µg TChl a L-1, as determined with the Algae Lab Analyser, and between 0.22 and 12.92 µg TChl a L-1, as determined via HPLC (Fig. 1.3a). The average TChl a per lake was higher when determined with Algae Lab Analyser (0.86 in the oligotrophic, 1.27 in the oligo- mesotrophic and 3.19 µg L-1 in the mesotrophic lake) compared to the values determined via HPLC (0.53, 1.26 and 2.01 µg L-1, respectively). Despite those differences, we found a high positive correlation for the estimated TChl a between the two methods (rs = 0.82, Tab. 1.2) across all three lakes. The ratio RLAB/CHEM for TChl a was 1.47 and differed significantly from the 1:1 relationship (Tab. 1.3). The best match between the two methods was found in the oligo-mesotrophic lake (Kruskal-Wallis test, Χ22,559 = 144.57, p < 0.001, Tab. 1.4), where the ratio RLAB/CHEM was not significantly different from 1 (value of 1 included in the 95% confidence interval, Tab. 1.3).
1.3.4 Phytoplankton community composition and biodiversity
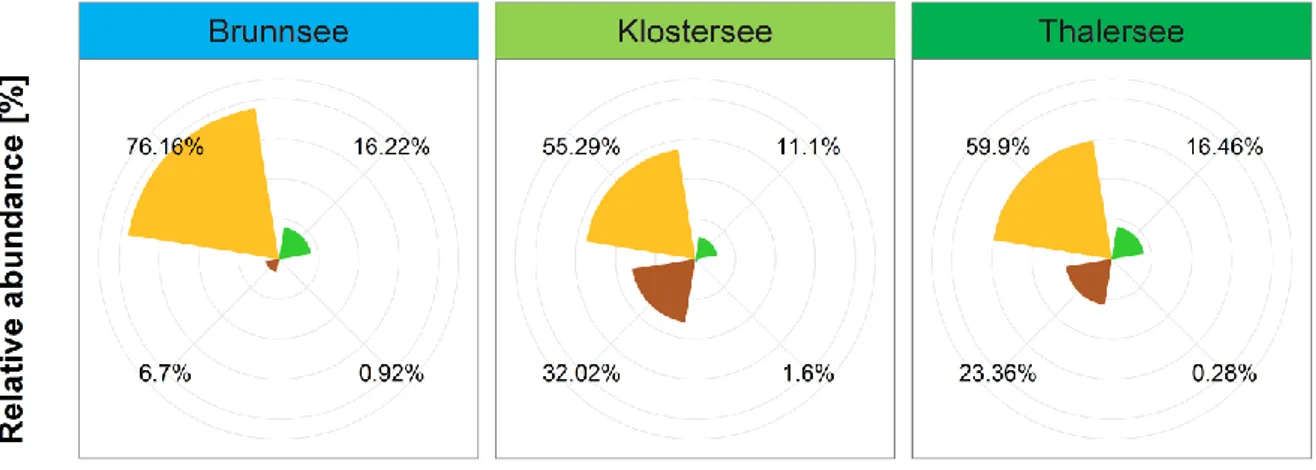
The phytoplankton communities of all three lakes were strongly dominated by Chromophytes, as determined by Algae Lab Analyser (Fig. 1.4). Their relative abundance ranged from 55% in the oligo-mesotrophic lake to 76% as found in the oligotrophic lake.
Second most abundant group in the oligo-mesotrophic and the mesotrophic lake were Cryptophytes (32% and 23%, respectively), while the Chlorophytes were the second most abundant group in the oligotrophic lake (16%). Cyanobacteria were found only in very low abundances being even below 2% (Fig. 1.4).
30
Fig. 1.3: (a) Total chlorophyll a concentration (µg L-1) and (b) phytoplankton diversity H’ (Shannon-Index) determined spectrofluorometrically in vivo with Algae Lab Analyser (y-axis) and chromatographically in vitro via HPLC and CHEMTAX (x-axis). The dashed lines represent the 1:1 relationship. Color of the circles represents the trophic state of the lakes, blue: oligotrophic (n=186); light green: oligo-mesotrophic (n=187); dark green: mesotrophic (n=189); n in parentheses indicates the number of water samples per lake used in the study.
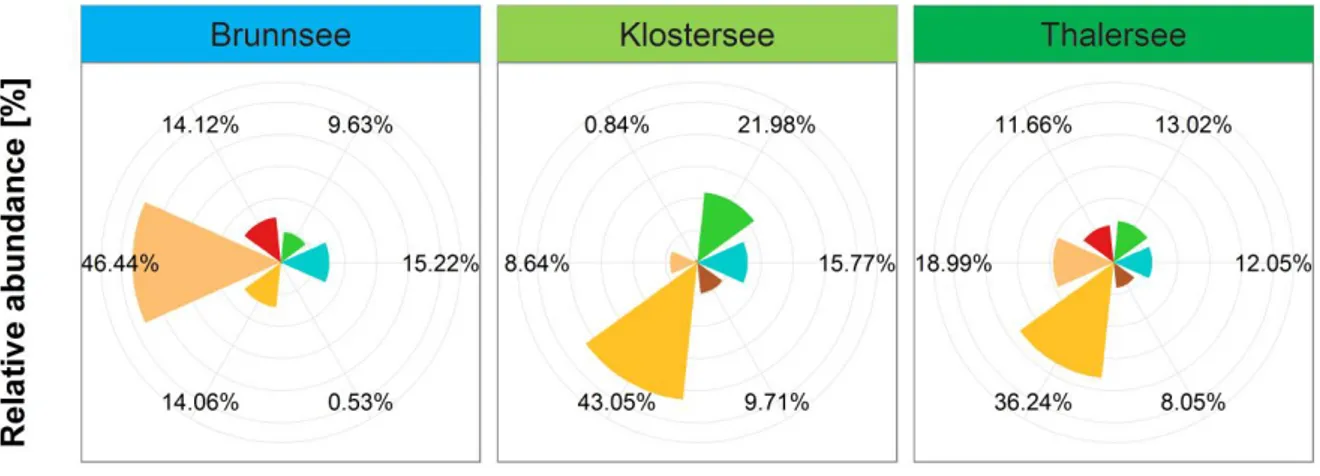
With CHEMTAX, we were able to differentiate between the subgroups of Chromophytes (Chrysophytes, Diatoms and Dinoflagellates) and thus received a higher taxonomical resolution of the phytoplankton community composition compared to Algae Lab Analyser. According to the CHEMTAX calculations, in the oligotrophic lake, the Diatoms were the most abundant phytoplankton group (46.44%), followed by Cyanobacteria (15.22%), Dinoflagellates (14.12%) and Chrysophytes (14.06%), while the relative abundance of the Cryptophytes was below 1% (Fig. 1.5), as indicated by very low amount of alloxanthin in the oligotrophic lake (Fig. 1.2). In both the oligo-mesotrophic and the mesotrophic lake, we found high relative abundances of Chrysophytes (43.05%
and 36.24%, respectively). As indicated by high amounts of zeaxanthin, chlorophyll b and lutein in the oligo-mesotrophic lake (Fig. 1.2), the Chlorophytes (21.98%) were the
31
second most abundant phytoplankton group in this lake, followed by Cyanobacteria (15.77%, Fig. 1.5). In the mesotrophic lake, which was dominated by Chrysophytes and Diatoms (in total 55.23%), as indicated by high amounts of fucoxanthin, the other 4 phytoplankton groups were all present in relatively similar abundances, ranging from 8.05% (Cryptophytes) to 13.02% (Chlorophytes, Fig. 1.5). Interestingly, in more than 63% of the samples, we found only 1 or 2 functional groups when using Algae Lab Analyser (47 and 311 samples, respectively) while 3 or 4 groups were found in 184 and 20 samples, respectively. With CHEMTAX, we found all four phytoplankton groups in 484 out of 562 samples, while 78 samples had a functional richness of 3 (Fig. 1.6).
Fig. 1.4: Composition of the natural phytoplankton communities of the lakes Brunnsee (oligotrophic), Klostersee (oligo-mesotrophic) and Thalersee (mesotrophic), as determined via Algae Lab Analyser.
Shown are relative abundances of phytoplankton groups Chlorophytes, Chromophytes, Cryptophytes and Cyanobacteria, given as an average over the whole duration of the experiment, including both mesocosms and the lake itself.
32
Fig. 1.5: Composition of the natural phytoplankton communities of the lakes Brunnsee (oligotrophic), Klostersee (oligo-mesotrophic) and Thalersee (mesotrophic), as determined via HPLC and CHEMTAX.
Shown are relative abundances of phytoplankton groups Chlorophytes, Cryptophytes, Cyanobacteria, Chrysophytes, Diatoms and Dinoflagellates, given as an average over the whole duration of the experiment, including both mesocosms and the lake itself.
Fig. 1.6: Functional richness of the natural phytoplankton communities in each sample from the lakes Brunnsee (oligotrophic, n=186), Klostersee (oligo-mesotrophic, n=187) and Thalersee (mesotrophic lake, n=189), as determined via Algae Lab Analyser (left panel) and CHEMTAX (right panel). Only the four phytoplankton groups Chlorophytes, Chromophytes, Cryptophytes and Cyanobacteria are included.
33
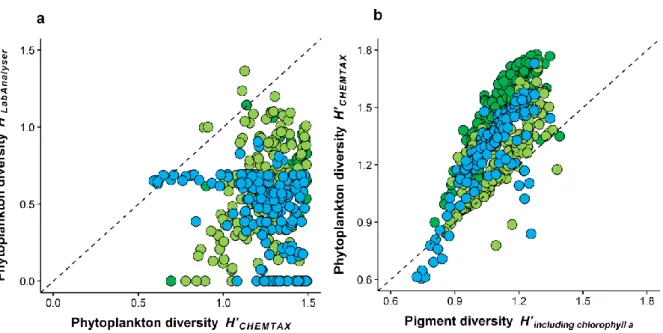
The phytoplankton diversity (given as Shannon-Diversity Index) based on the biomass estimates of four phytoplankton groups (Chlorophytes, Chromophytes, Cryptophytes and Cyanobacteria) from the Algae Lab Analyser ranged from 0 (only one group present) to 1.37 and was on average 0.59 across all three lakes. The average phytoplankton diversity based on CHEMTAX biomass estimates was higher (0.88) and ranged between 0.30 and 1.38 (Fig. 1.3b), resulting in a ratio significantly below 1 (RLAB/CHEM = 0.7±0.03 (95% confidence interval), Tab. 1.3). The highest average diversity of the phytoplankton community was found in the oligo-mesotrophic lake (H’ = 1.03±0.21 (mean ± standard deviation); Kruskal-Wallis test, Χ22,559 = 199.34, p < 0.001) based on CHEMTAX biomass estimates, while the mesotrophic lake was the most diverse lake based on biomass estimates from Algae Lab Analyser (H’ = 0.72±0.15; Kruskal-Wallis test, Χ22,559 = 131.52, p < 0.001). We found the lowest average phytoplankton diversity in the oligotrophic lake as indicated by both the Algae Lab Analyser and CHEMTAX biomass estimates (0.43 and 0.66, respectively).
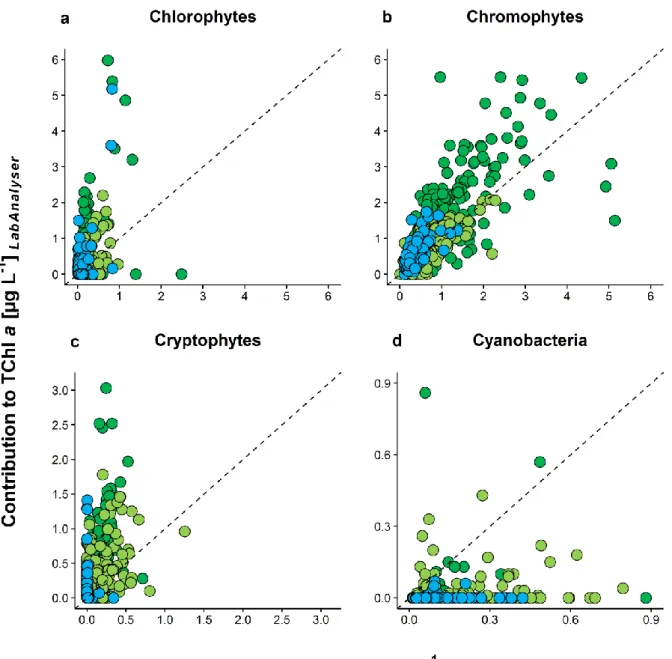
1.3.5 Comparison of the biomass estimates from both methods
We found a very low, but nevertheless significant correlation between the two methods for the biomass estimates of the Chlorophytes (rs= 0.19, p < 0.001, Tab. 1.2). As determined via the Algae Lab Analyser, the contribution of the Chlorophytes to the TChl a was on average 0.36 µg L-1 and ranged from 0 to 8.05 µg L-1. With CHEMTAX, we found lower average contribution of the Chlorophytes to the TChl a (0.20 µg L-1), with a maximum value of only 3.21 µg L-1 in the mesotrophic lake (Fig. 1.7a), which resulted in an average ratio RLAB/CHEM of 2.97 (Tab. 1.3). The best correlation for the Chlorophytes was found in the oligo-mesotrophic lake (rs = 0.41, p < 0.001, Tab. 1.2 and Tab. 1.4),
34
which was also the only lake where the average contribution of the Chlorophytes to the TChl a was higher when determined via CHEMTAX than Algae Lab Analyser (RLAB/CHEM = 0.58, Tab. 1.3 and Fig. 1.8a).
The highest correlation between the biomass estimates from both methods was found for the Chromophytes (rs = 0.77, p < 0.001, Tab. 1.2). The average contribution of the Chromophytes to the TChl a was 1.07 (Algae Lab Analyser) and 0.82 µg L-1 (CHEMTAX, Fig. 1.7b). Again, we found the best fit between the two methods in the oligo- mesotrophic lake (rs = 0.72, p < 0.001, Tab. 1.2 and Tab. 1.4), with an average ratio RLAB/CHEM of 1.17 (Tab. 1.3). Compared to the biomass estimates of the other phytoplankton groups, the ratios RLAB/CHEM for Chromophytes were the closest to 1 in all three lakes (Fig. 1.8b).
The contribution of the Cryptophytes to the TChl a ranged from 0 to 6.75 µg L-1 and from 0 to 1.25 µg L-1 as determined via Algae Lab Analyser and CHEMTAX, respectively (Fig.
1.7c). On average, we found only 0.09 µg L-1 of the Cryptophytes in our samples according to the CHEMTAX calculations, while with the Algae Lab Analyser, the average biomass of the Cryptophytes was 4 times higher (0.36 µg L-1). Still, we found a highly significant positive correlation between the biomass estimates from the two methods across all lakes (rs = 0.62, p < 0.001, Tab. 1.2), while the best fit was found in the mesotrophic lake (rs = 0.5, p < 0.001, Tab. 1.2). The worst fit for the Cryptophytes was found in the oligotrophic lake, but was still significant (rs = 0.15, p < 0.05, Tab. 1.2). The ratios RLAB/CHEM found for the biomass estimates of the Cryptophytes were in many cases very high and ranged up to about 2 x 10⁶ as found in the oligo-mesotrophic lake (Fig.
1.8c), which was due to very low concentrations of alloxanthin in the samples and thus, a very low contribution of the Cryptophytes to the TChl a as determined via CHEMTAX.
35
The lowest correlation between the two methods was found for the Cyanobacteria (rs = 0.07, p > 0.05, Tab. 1.2 and Fig. 1.7d). Although the biomass estimates for the Cyanobacteria from Algae Lab Analyser and CHEMTAX were in a very similar range (0 to 0.86 µg L-1 and 0.01 to 0.88 µg L-1, respectively), the overall ratio RLAB/CHEM was only 0.1 (Tab. 1.3 and Fig. 1.8d). Interestingly, we found Cyanobacteria in all samples as determined via CHEMTAX, but the same was the case in only 69 samples when using Algae Lab Analyser. In 493 samples (88% of all samples), Cyanobacteria were not found at all according to the Algae Lab Analyser. In the oligotrophic and the mesotrophic lake, this was even the case in 96% and 93% of the samples, respectively. The only positive correlation between the two methods was found in the oligotrophic lake, but was very low (rs = 0.17, p < 0.05, Tab. 1.2). For both the Cryptophytes and the Cyanobacteria, no significant differences between the ratios RLAB/CHEM were found between the lakes (Tab. 1.4).
Tab. 1.2: Spearman rank correlation coefficients (rs) between the chlorophyll a concentrations (µg L-1) determined fluorometrically with Algae Lab Analyser and chromatographically via HPLC and CHEMTAX estimated across all lakes and for each lake separately; significance levels are indicated with asterisks:
* p < 0.05, *** p < 0.001.
Chlorophyll a (µg L-1)
All lakes oligotrophic oligo-mesotrophic mesotrophic rs (n = 562) rs (n = 186) rs (n = 187) rs (n = 189)
Total 0.82*** 0.56*** 0.59*** 0.71***
Chlorophytes 0.19*** -0.06 0.41*** 0.26***
Chromophytes 0.77*** 0.66*** 0.72*** 0.62***
Cryptophytes 0.62*** 0.15* 0.33*** 0.5***
Cyanobacteria 0.07 0.17* 0 -0.12
36
Fig. 1.7: Contribution of (a) Chlorophytes, (b) Chromophytes (Chrysophytes, Diatoms and Dinoflagellates), (c) Cryptophytes and (d) Cyanobacteria to the total chlorophyll a concentration (µg L-1) determined spectrofluorometrically in vivo with Algae Lab Analyser (y-axis) and chromatographically in vitro via HPLC and CHEMTAX (x-axis). The dashed lines represent the 1:1 relationship. Color of the circles represents the trophic state of the lakes, blue: oligotrophic (n=186); light green: oligo-mesotrophic (n=187); dark green: mesotrophic (n=189); n in parentheses indicates the number of water samples per lake used in the study.
37
Fig. 1.8: The distribution of the ratios (RLAB/CHEM + 1, to be able to use a logarithmic scale for the y-axis) between the contribution of four phytoplankton groups (a) Chlorophytes, (b) Chromophytes (Chrysophytes, Diatoms and Dinoflagellates), (c) Cryptophytes and (d) Cyanobacteria to the total chlorophyll a determined spectrofluorometrically in vivo with Algae Lab Analyser and chromatographically in vitro via HPLC and CHEMTAX for all three lakes of different trophic status.
38
1.3.6 CHEMTAX derived phytoplankton diversity including all 6 phytoplankton groups The average ratio between the Shannon-Diversity Indices from two the methods was even lower when all 6 phytoplankton groups (Chlorophytes, Cryptophytes, Cyanobacteria, Chrysophytes, Diatoms and Dinoflagellates) were included into CHEMTAX derived phytoplankton diversity (Fig. 1.9a). Here, the correlation coefficient rs between Algae Lab Analyser and CHEMTAX derived diversity was only 0.3, while the average ratio RLAB/CHEM across all lakes was 0.44 (Tab. 1.3).
When we compared the HPLC derived pigment diversity (including chlorophyll a) and phytoplankton diversity determined via CHEMTAX (all 6 groups included, Fig. 1.9b), we found a highly significant positive correlation (rs = 0.67, p < 0.001), which was found to be the highest in the mesotrophic lake (rs = 0.82, p < 0.001). The average ratio Rphytoplankton/pigments was 1.23 across all lakes and ranged between 0.67 and 1.50. The ratio most closely to 1 was found in the oligo-mesotrophic lake (Rphytoplankton/pigments = 1.13;
Kruskal-Wallis test, Χ22,559 = 290.9, p < 0.001).
39
Fig. 1.9: (a) Correlation between the phytoplankton diversity H’ (Shannon-Index) determined spectrofluorometrically in vivo with Algae Lab Analyser (y-axis) and chromatographically in vitro via HPLC and CHEMTAX (x-axis, including all 6 taxonomic groups: Chlorophytes, Cryptophytes, Cyanobacteria, Chrysophytes, Diatoms and Dinoflagellates). (b) Correlation between the phytoplankton diversity estimated with HPLC and CHEMTAX (including all 6 taxonomic groups) and pigment diversity (including chlorophyll a). The dashed line represents the 1:1 relationship. For legend, see Fig. 1.3.