Volodymyr Averkov
Inaugural-Dissertation
Tissue-specific roles of Snail-like transcription factors in the embryogenesis of Drosophila melanogaster
Köln
2015
Tissue-specific roles of Snail-like transcription factors in the embryogenesis of Drosophila melanogaster
Inaugural-Dissertation zur
Erlangung des Doktorgrades
der Mathematisch-Naturwissenschaftlichen Fakultät der Universität zu Köln
vorgelegt von Volodymyr Averkov
Aus Charkiw (Ukraine)
Berichterstatter: Prof. Dr. Maria Leptin Prof. Dr. Siegfried Roth
Datum der Disputation: 16. Juni 2015
O snail,
Slowly climb Mount Fuji Up to the peak!
(Kobayashi Issa, 1763 - 1828)
Table of Content
1 Frequently used abbreviations ... 8
2 Introduction ... 9
2.1 Binding of TFs to DNA ... 10
2.1.1 Tissue-specific binding of TFs to enhancers ... 11
2.2 Methods that allow the identification of enhancers and TF binding sites ... 12
2.2.1 ChIP techniques and their modifications ... 13
2.2.2 Generation of tagged proteins using FlyFosmid libraries ... 15
2.2.3 Sequencing techniques applied in ChIP-seq ... 16
2.2.4 Bioninformatic approaches used in ChIP-seq ... 18
2.3 Snail/Scratch superfamily ... 20
2.3.1 Discovery of Snail ... 20
2.3.2 Structure of Snail-like TFs ... 20
2.3.3 The diversity of Snail/Scratch superfamily of TFs ... 20
2.3.4 Evolution of Snail/Scratch superfamily ... 21
2.3.5 General functions of Snail-like TFs ... 21
2.3.6 Snail-like TFs in mammalian neurogenesis ... 23
2.3.7 Regulation of the activity of Snail-like TFs ... 24
2.4 Snail/Scratch superfamily in Drosophila ... 25
2.4.1 Family 1: Snail-like TFs ... 25
2.4.2 Family 2: Scratch ... 25
2.5 Functions of Snail in Drosophila embryogenesis ... 26
2.5.1 Snail in mesoderm invagination ... 26
2.6 Early Drosophila neurogenesis ... 29
2.7 Roles of Snail, Worniu and Escargot ... 32
2.7.1 Snail-like TFs in development of the central nervous system ... 32
2.7.2 Other functions of worniu... 33
2.7.3 Other functions of escargot ... 34
2.7.4 Redundancy of Snail, Worniu and Escargot in eye formation ... 35
2.8 Datasets of DNA binding sites available for Drosophila Snail-like TFs ... 35
2.9 Aim of the research project ... 36
3 Materials and Methods ... 37
3.1 Materials ... 37
3.1.1 Computer software ... 37
3.1.2 Laboratory equipment ... 38
3.1.3 Chemicals ... 39
3.1.4 Affinity gels ... 40
3.1.5 Protein A beads ... 40
3.1.6 Enzymes ... 40
3.1.7 Embedding media ... 40
3.1.8 Kits ... 41
3.1.9 Lab plastic ... 41
3.1.10 Glassware ... 42
3.1.11 Solutions, buffers, media ... 42
3.1.12 DNA constructs ... 46
3.1.13 Antibodies ... 49
3.1.14 Fly stocks used in the experiments ... 51
3.2 Methods ... 53
3.2.1 Molecular cloning... 53
3.2.2 Fly work ... 53
3.2.3 Immunohistochemistry ... 57
3.2.4 In situ hybridizations ... 57
3.2.5 Imaging ... 59
3.2.6 Protein biochemistry ... 59
3.2.7 Chromatin immunoprecipitation procedures ... 60
3.2.8 Molecular manipulations with FlyFosmids ... 65
3.3 Generation of the transgenic lines that express V5- and HA-tagged Snail, Worniu and Escargot ... 69
3.3.1 Generation of FRT-KanR-FRT-Start-V5-HA and FRT-KanR-FRT-Start-HA- V5 recombination cassettes ... 69
3.3.2 FlyFosmid recombineering using fosmid recombination cassettes ... 72
3.3.3 Establishment of the FlyFosmid transgenic fly lines ... 76
4 Results ... 79
4.1 Expression patterns of snail, worniu and escargot ... 79
4.1.1 Expression patterns of snail, worniu and escargot during early embryonic development detected with in situ hybridizations ... 80
4.1.2 Expression of endogenous Snail, Worniu and Escargot;... 96
4.1.3 Expression of transgenic V5-HA-snail, HA-V5-worniu and V5-HA-escargot 99 4.1.4 Comparison of expression patterns of Snail and HA-V5-Worniu ... 100
4.2 Chromatin immunoprecipitation ... 105
4.2.1 Detection of V5- and HA-tagged transgenic proteins on western blot .. 105
4.2.2 Immunoprecipitation of V5- and HA-tagged transgenic proteins ... 106
4.2.3 Collection of large amounts of tightly staged embryos ... 108
4.2.4 Establishment of the ChIP protocol ... 110
4.2.5 Anti-Snail ChIP ... 125
5 Discussion ... 131
5.1 Expression analysis of snail, worniu and escargot. ... 131
5.1.1 Expression of snail ... 131
5.1.2 Expression of worniu ... 132
5.1.3 Post-transcriptional control of worniu and snail ... 132
5.1.4 Cooperation of snail, worniu and escargot ... 134
5.1.5 Possible roles of Snail, Worniu and Escargot, suggested by their expression patterns ... 136
5.2 Evolutionary conserved functions of Snail-like TFs ... 137
5.2.1 Snail-like TFs and the epithelial-mesenchymal transition ... 138
5.2.2 Snail-like TFs and neurogenesis ... 138
5.2.3 Snail-like TFs and stem cell identity ... 139
5.2.4 Snail-like TFs in cell survival and asymmetric cell division ... 139
5.2.5 Snail-like TFs in arthropod development ... 140
5.3 ChIP-seq ... 142
5.3.1 Challenges of the experiment ... 142
5.3.2 Analysis of ChIP-seq datasets ... 143
5.3.3 Primary analysis of the binding sites of Snail in mesoderm and neuroblasts 144 5.3.4 Mesodermal and neuroblast targets of Snail ... 144
5.4 Future directions ... 146
6 Bibliography ... 147
7 Abstract ... 161
8 Zusammenfassung ... 162
9 Acknowledgements ... 163
10 Declaration ... 164
11 Lebenslauf ... 165
1 Frequently used abbreviations
AEL after egg lay
bp base pairs
ChIP chromatin immunoprecipitation ChIP-seq ChIP with following sequence analysis CNS central nervous system
CRM cis-regulatory modules
DamID DNA adenine methyltransferase identification EMT epithelial-mesenchymal transition
EtOH ethanol
fig. figure
GFP green fluorescent protein GMC ganglion mother cell
GP guinea pig (source of immune serum) hpf hours post fertilization
HRP horseradish peroxidase
MP2 midline precursor 2: a neuroblast lineage
NaAc Sodium acetate
Nb neuroblast
NGS next generation sequencing PNS peripheral nervous system PWM position weight matrix
TF transcription factor
TSS transcription start site
UTR untranslated region
V5, HA oligopeptide epitops
The genes and proteins were abbreviated according to the standard FlyBase
abbreviation list.
2 Introduction
Transcription factors (TFs) are key regulators of gene expression. TF binding to chromatin depends on multiple conditions, such as tissue identity, developmental stage or stress conditions to name a few, so called differential binding of TFs. To gain an understanding of the mechanisms of differential binding of TFs to DNA is one of the important aims of present day functional genomics and systems biology (Spitz and Furlong, 2012).
Extensively studied Drosophila development provides multiple examples of differential binding of TFs (Shlyueva et al., 2014a; Yáñez-Cuna et al., 2012). Multiple novel assays, developed over the past years, allowed a description of TF binding events on a genomic level (Gilchrist et al., 2009; Shlyueva et al., 2014b). However, the studies performed on Drosophila mainly compared TF binding profiles in a single tissue at different developmental stages. The TF Snail provides an opportunity to compare binding profiles of a TF in different tissues without complicated tissue dissection procedures. At stages 4-7 of Drosophila embryonic development (2-4 hours post fertilization, hpf at 25°C) Snail is expressed in mesoderm (Leptin and Grunewald, 1990). Later at stages 8-11 (4-6 hpf at 25°C) Snail is expressed in the neuroblasts of the developing ventral nerve cord (Ashraf et al., 1999). The functions of Snail in mesoderm are well known and mesodermal target genes have been described (Kölsch et al., 2007; Leptin, 1991; Macarthur et al., 2009; Rembold et al., 2014), but the functions of Snail in neuroblasts remain obscure. In mesoderm Snail performs its functions without cooperation partners. In neuroblasts Snail cooperates and acts redundantly with the TFs Worniu and Escargot, paralogs of Snail (Ashraf and Ip, 2001;
Ashraf et al., 1999; Cai et al., 2001).
In this work I analyze and compare the binding profiles of Snail in mesoderm and
neuroblasts, and try to decipher the mechanisms of tissue-specific cooperation of Snail,
Worniu and Escargot.
2.1 Binding of TFs to DNA
Each TF specifically binds a particular short DNA sequence (usually in the range of 6 to 15 bp), which are called TF binding motifs. TF binding motifs tolerate certain levels of sequence variability. The TF Snail binds to an extended E-box motif with the core CAGGTG.
The CA nucleotides at position 1 and 2 are invariant, i.e. their mutation completely abolishes Snail´s binding, whereas G at the 6
thposition can be substituted by A without a major impact on binding affinity. The variant sequence CAGGTA was thus described as an
“alternative Snail motif” (Mauhin et al., 1993; Rembold et al., 2014).
TF binding motifs can be represented as consensus sequences or as position weight matrices (PWM), calculated by comparison of multiple experimentally proven binding sites for a given TF. A PWM calculates the probability of a given nucleotide at a given position as well as the information content of this position. The information content (calculated in bits from 0 to 2) represents the sequence conservation: positions with a high tolerance for substitutions have low information content in contrast to highly conserved positions.
Positions at which only one specific nucleotide is allowed have the maximum information content of 2. The PWM can be visualized with so-called sequence logos, in which the height of the corresponding symbol in a stack shows the relative frequency of this base at this position. The sequence logos of the PWM of Snail and Twist binding motifs are shown in the fig. 1 (Rembold et al., 2014; Stormo, 2000).
Figure 1. Examples of TF binding motifs. The position weight matrices of the binding motifs for Snail and Twist are represented as sequence logos. The y-axis specifies the information content of a specific position in bits, where 2 indicates that only a single nucleotide can occur at this position. The total height of the stack at one position specifies the information content of this position and the height of a nucleotide symbol within a stack indicates the relative frequency of this nucleotide at this position. Image modified from (Rembold et al., 2014).
The affinity of a TF for to a given DNA fragment depends on two main conditions.
First, on the the DNA sequence of the fragment. Second, on post-translational modifications, homo- or hetero-dimerization of the TF. For instance, Twist homodimers activate the transcription of myogenic genes, such as Mef2. In contrast, Twist/Daughterless heterodimers recognize a different set of targets and repress somatic myogenic genes (Castanon et al., 2001; Wong et al., 2008).
Often multiple TF binding sites are clustered in a small DNA region into a non-coding DNA sequence, called enhancer. Enhancers are commonly identified as the compact non- coding DNA regions, whose deletion reduce or drastically changes expression of a gene.
Enhancers are located within a regulated gene, in the upstream or downstream non- transcribed region of a target gene, or can control expression of a distant gene skipping one or two other genes (Kvon et al., 2014).
The word “enhancer” reflects the “enhancing” effect of this sequence on transcription from a promoter that was first described for a 72-bp fragment of the SV40 virus genome, which drastically enhanced the transcription of a reporter gene in HeLa cells (Banerji et al., 1981). Since enhancers can also mediate repression of a gene the term “cis- regulatory modules” (CRMs) is often used as a synonym or as a replacement for the term
“enhancer”.
2.1.1 Tissue-specific binding of TFs to enhancers
Even though TFs might be present in cells, they do not necessarily bind to each of their target binding sites: a histone modification or a prior binding of additional TFs is required to make enhancers accessible. Binding of a TF to enhancers that depends on the cellular context is called “context-specific binding” (reviewed in Spitz and Furlong, 2012).
Context-specific binding of TFs and context-specific enhancer activation in an organism may occur in a temporarily and spatially controlled manner.
Multiple studies monitored binding of a TF to enhancers in different cell contexts in
multiple model organisms at a genome-wide scale: in yeasts under different growth
conditions (Buck and Lieb, 2006; Zeitlinger et al., 2003), in C.elegans at different
developmental stages (Zhong et al., 2010), in Drosophila (Sandmann et al., 2007; Wilczyński
and Furlong, 2010; Zinzen et al., 2009), in mice and human (Lin et al., 2010; Palii et al.,
2010). Spatiotemporal changes in TF binding to DNA, not the expression of the TF itself, correlate with dynamic patterns of target expression (Wilczyński and Furlong, 2010).
To bind and activate an enhancer a TF often requires co-binding of other TFs (Sandmann et al., 2007; Wilczynski and Furlong, 2010; Wilczynski et al., 2012; Zinzen and Furlong, 2008). In turn, the TFs require the binding motifs included into the enhancer´s sequence to bind it. Thus, the sequence of enhancer, in particular TF binding motifs within the enhancer, specifies the spatio-temporal pattern of enhancer activation. The motif content of an enhancer can therefore be used to predict its activity.
Several recent studies were dedicated to the in silico prediction of spatio-temporal patterns of enhancer expression based on the sequence of enhancer elements. Machine learning algorithms have been developed that analyze multiple enhancer elements, and compare their motif composition to data on the of enhancer´s expression pattern. These algorithms are able to effectively predict TF binding profiles and activity of genomic enhancers, mutant enhancers and newly designed enhancers (Yáñez-Cuna et al., 2012;
Zinzen et al., 2009).
2.2 Methods that allow the identification of enhancers and TF binding sites
Historically the first enhancers were discovered and characterized using “enhancer trap” procedures. Genomic DNA fragments, usually upstream of the transcriptional start site, were ligated into a plasmid containing a reporter gene. After transgenesis or transient cell transfection the activity of the reporter gene was measured to identify those genomic fragments that displayed enhancer activity. However, testing enhancer properties of multiple DNA sequences surrounding a gene of interest required time and effort and was therefore restricted to a limited number of enhancers (reviewed in M. Hoy, 2013). Later numerous approaches have been developed to allow enhancer identification and characterization at the genomic scale: there are multiple advanced versions of the
“enhancer trap” procedure like immunoprecipitation-based assays or predictions based on DNA aссessibility in nuclei (reviewed in Shlyueva et al., 2014b).
Active enhancers, as well as other active regions of DNA, are generally more
accessible than non-active genomic regions. This characteristic of chromatin is used in
methods such as DNase-seq and FAIRE-seq (formaldehyde-assisted identification of regulatory elements followed by deep sequencing) chromatin is cross-linked and subjected to DNase treatment. Active regions, such as actively transcribed genes, promoters and enhancers are accessible and cut by the enzyme. Tightly packed inactive DNA, in contrast, is protected by proteins and therefore remains intact. Next generation sequencing analysis is then applied to generate a map of the frequently cut regions, i.e. highly active regions of DNA, which include actively transcribed genes, active promoters and enhancers (reviewed in Shlyueva et al., 2014b).
The DamID (DNA adenine methyltransferase identification) technique employs the expression of a protein chimera, consisting of a DNA-binding protein fused to the enzyme domain of bacterial DNA adenine methyltransferase (Dam). Being bound to DNA, the protein chimera methylates adenines within GATC sequences in the neigbouring DNA. This DNA modification is not characteristic for eukaryotes and therefore specifically marks binding sites of the chimeric protein. However, the DamID methods works with an average resolution of ~1 kb (average TF binding site is 5-15 bp long) and therefore cannot be used to identify TF binding sites with precise resolution (van Steensel and Henikoff, 2000).
Numerous bioinformatic scripts were developed to search for the genomic regions that satisfy the criteria specific for enhancers. The programs search features like ‘non- protein-coding’, ‘conserved’, ‘enriched for TF binding sites’. Other programs analyze the distribution of multiple TFs on DNA, using datasets of TF binding available from the experimental work performed previously, compare TF distribution to the localization of RNA polymerase molecules and to the enrichment of enhancer-specific histone modifications. Despite machine-based methods being quick and effective, they always require subsequent in vivo tests of the predicted regions (reviewed in Shlyueva et al., 2014).
2.2.1 ChIP techniques and their modifications
Chromatin immunoprecipitation (ChIP) is a method extensively used today to map
the interaction of proteins with DNA with a genome-wide scale. The technique became
popular because of its simple design and the high level of precision and resolution. The
technique is based on affinity purification of proteins that were crosslinked in vivo to the
genomic regions they are bound to (Gilchrist et al., 2009; Ho et al., 2011). It has been
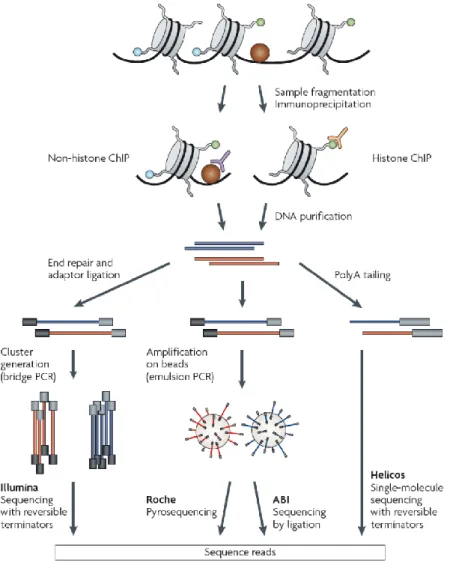
successfully applied to study TF binding, histone modifications or chromatin modifying enzymes, epigenetic marks and the location of RNA Polymerase II (Park, 2009). In short, after isolation of nuclei and fragmentation of chromatin, antibodies are applied to selectively precipitate chromatin fragments, cross-linked to the protein or histone modification of interest. The purified DNA fragments are mapped to the genome. ChIP-seq (ChIP with following sequence analysis) employs sequencing techniques to read the precipitated DNA and is able to identify the binding sites with ~10-50 bp resolution (Park, 2009; fig. 2).
Figure 2. Overviewed ChIP-seq pipeline (from Park, 2009). Main steps of the workflow protocol: chromatin fragmentation, immunoprecipitation, DNA purification, library preparation and following sequence analysis. Several possible DNA sequencing approaches are illustrated: Illumina sequencing with reversible terminators, Roche pyrosequencing, ABI sequencing by ligation, Helicos single-molecule sequencing with reversible terminators. As Illumna technology was used for sequence analysis in the current work, it is going to be explained in the following chapters.
ChIP followed by hybridization to DNA microarrays (ChIP-chip) in contrast, identifies TF-binding sites with a resolution of several hundred bps. Several modifications to the basic technique have been developed. Bits-ChIP for instance allows the analysis of tissue-specific binding or chromatin states. The cells of a single tissue are fluorescently labeled with a fluorescent marker and sorted from the entire body lysate by FACS (Bonn et al., 2012).
2.2.2 Generation of tagged proteins using FlyFosmid libraries
The availability of high quality antibodies is crucial for the success of a ChIP experiment. The antibody should recognize the protein of interest with high specificity and show minimal cross-reactivity to other proteins. An alternative method is the use of ChIP- quality antibodies against protein tags, such as V5, HA, FLAG or GFP. Multiple recombination techniques are available to produce tagged versions of TFs. For instance, fosmid recombination allows the insertion of a tag-coding sequence into the gene, while preserving the gene’s genomic environment and expression pattern.
Fosmids are bacterial vectors, designed to carry large DNA fragments (up to 50 kb), for instance fragments of genomes. FlyFosmid is a library of Drosophila genomic fragments cloned into the fosmid vector, specially designed for Drosophila transgenesis (pFlyFos) (Ejsmont et al., 2009). The library covers ~96% of the genes of Drosophila, with an average size of the genomic fragments of 36 kb, the majority ranging between 20 kb and 50 kb. The pFlyFos vector contains DNA sequences required for all necessary fosmid manipulations in bacteria (such as an origin of replication and antibiotic resistance gene), as well as the elements used for Drosophila transgenesis. The vector contains the attB recombination site for φC31-mediated integration into attP sites present in Drosophila landing lines and a gene encoding red fluorescent protein (dsRed) under control of a Drosophila eye-specific enhancer as a selection marker (Ejsmont et al., 2009).
FlyFosmid DNA can be easily manipulated. In this work I used the homologous
recombination system Red derived from λ prophage (Copeland et al., 2001). The Red system
requires specially developed bacterial strains, such as the EL250 strain, containing the red
recombination genes exo, bet, and gam integrated into their genome. The bacteria must be
electroporated first with a FlyFosmid that carries the gene of interest and later with a linear
DNA molecule, the recombination cassette. Two 50 bp long homology arms at the termini of the recombination cassette direct the recombination event to the identical 50 bp homology regions on the FlyFosmid. The expression of exo, bet and gam, normally repressed by temperature-sensitive repressor cI857, is activated upon heat-shock. The recombination system recognizes homology arms on the cassette as double-stranded DNA breaks and starts repair (Lee et al., 2001). The 5'-3' exonuclease Exo creates single-stranded overhangs on the linear DNA of the recombination cassette. Bet protects the overhangs and assists with the recombination process. Gam prevents degradation of linear DNA by inhibiting the E. coli RecBCD protein. Bacterial reparation system exchanges fosmid DNA between homology regions by the recombination cassette DNA. Recombination is very efficient and requires homology arms as long as only 30-50 bp (Copeland et al., 2001). Depending on the cassette design, the recombination could be used to insert, delete or modify any piece of FlyFosmid DNA.
The recombination cassette usually contains an antibiotic resistance gene, as a selection marker for recombination. The marker is framed by FRT sites, so that it can be removed after a successful recombination. The flippase gene is present in the genome of the EL250 strain under control of the arabinose operator.
2.2.3 Sequencing techniques applied in ChIP-seq
In the ChIP-seq workflow a ChIP DNA sample must be sequenced and the sequencing
reads must be mapped onto the genome. Conventionally these steps are done using next-
generation sequencing (NGS) techniques, designed to sequence a large number of DNA
molecules in parallel. Several different high-throughput sequencing techniques are
available, of which Roche 454, SOLiD, Illumna sequencing is one of the most commonly used
systems (fig. 3). The technique relies on sequencing by synthesis (SBS) with fluorescently
labeled terminator bases. The fragments can bend over and the adaptor at the free end
basepairs with the primers on the slide (bridge amplification). The DNA is amplified with
unlabeled nucleotides to produce local DNA colonies of identical molecules. The sequencing
cycle starts with the addition of fluorescently labeled reversible terminator bases (ddA,
ddT, ddG, ddC) along with primers and polymerase. After the termination base has been
incorporated a microscopic image of the entire slide is taken and stored. The color of the
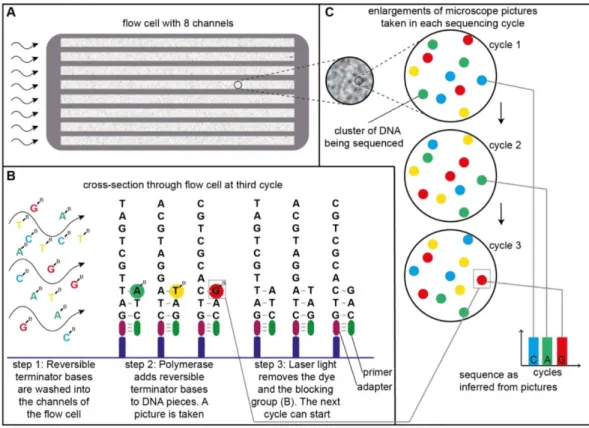
DNA colony identifies the base pair that has been incorporated. As each DNA molecule within one cluster has incorporated the same nucleotide, the signal becomes strong enough to be recorded. To start the new cycle the reversible terminator base is enzymatically cleaved to allow the incorporation and recording of the next base. The color sequence of each colony on the slide can thus be translated into a nucleotide sequence (fig. 3.; Bennett, 2004; Bentley et al., 2008; Meyer and Kircher, 2010; Shen et al., 2005).
Figure 3. General principles of the Illumina sequencing technology.
a. The Illumna flow cell with eight channels, a platform for the sequencing reaction. DNA fragments are linked to the cell via the DNA linker fragments and replicated to produce colony clusters of the identical DNA fragments. One cluster is represented by a single DNA fragment in b., or by a color circle in c.
b. Schematic representation of the sequencing cycle. One cycle is required to sequence a single base pair.
Sequencing of multiple DNA clusters is performed in parallel. First step: DNA polymerase adds a reversible terminator base to the DNA fragment, linked to the flow cell via DNA adaptor. Terminator base blocks following DNA synthesis, therefore only one base pair is added to the growing chain. Each kind of the terminator base (A, T, G, C) is stained with a specific fluorescent dye. Second step: the excess base pairs are washed away and a microscopic image of the cell is taken. Third step: The terminator base is substituted by a usual base and a fluorescent dyes are chemically removed to start a new sequencing cycle.
c. Schematic representation of a flow cell under high enlargement. During each sequencing cycle each DNA colony cluster gains a certain color that indicates the base pair incorporated into the growing DNA chain. Following of the DNA cluster colors throughout all sequencing reaction reveals the sequence of the DNA fragments in the cluster.
Figure modified from tucf-genomics.tufts.edu with the kind help of Dominik Stappert.
2.2.4 Bioninformatic approaches used in ChIP-seq
NGS Illumna allows high throughput sequencing and the data generated (dataset of reads) is in the order of several millions of successfully sequenced DNA fragments. These short-sequence reads (usually 100-300 bp) must be first mapped to the genome (fig. 4).
Thereafter the genomic coverage of the reads must be analyzed to evaluate the quality of the sequenced ChIP library: genome coverage, complexity and amount of background. If the ChIP was successful, TF-bound genomic fragments are going to be abundantly represented (enriched) in the library, whereas the majority of genome would be underrepresented (depleted). Since the DNA reads are going to be read from both DNA strands, the enrichment peaks mapped to genome are going to be shifted to the 3´ direction of a correspondent DNA strand.
After the reads are mapped, the decision must be made, which genome regions are going to be selected as “TF bound peaks” and which parts of genome are going to be
“background”. Model-based analysis of ChIP-seq (MACS): were used to analyze the ChIP data produced in this project (Feng et al., 2011, 2012; Zhang et al., 2008).
MACS workflow pipeline consists of the following steps: initially the program removes redundant reads generated by PCR over-amplification by excluding precisely coincided reads. Taking 1000 highest-enrichment regions the program calculates the base pair shift between the enrichment regions found independently upon + and - DNA strands, calculates the average base pair shifts for genome database, and shifts all reads to average shift/2 distance. After the reads are shifted, the overlapping enriched peaks are merged and the highest pileup of the reads is characterized as the peak summit.
MACS calculates λ
BG, a parameter of the Poisson model of reads distribution in the
genome. For each given peak summit the program estimates λ
local, the maximal value out of
(λ
BG, λ
1k, λ
5k, λ
10k), where λ
1k, λ
5k, λ
10kare the distribution parameters, calculated for 1 kb, 5
kb and 10 kb fragments, centered in the summit of analyzed peak. Comparing λ
localbetween
experiment and control samples the program evaluates the local biases of read
distributions and thus calculates p-values of each candidate peak to remove potential false
positives. Candidate peaks with p-values below a defined threshold are called (Feng et al.,
2011, 2012; Zhang et al., 2008).
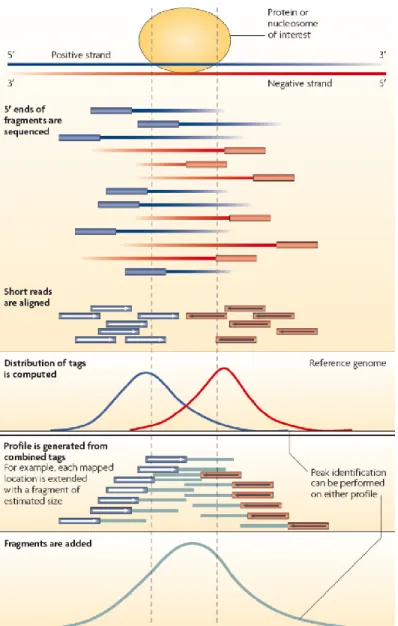
Figure 4. Mapping of the ChIP seq reads to the genome. Strand-specific peak localization within an enriched region (from Park, 2009).
DNA fragments precipitated in ChIP experiment derive from both + and - DNA strands, but both are sequenced from the 5´ end. Thus, the majority of reads are shifted towards the 5´ end of the DNA strand they derived from.
Therefore each protein binding peak is composited of two shifted peaks (each peak derives from one DNA strand).
The distance between the shifted peaks depends on the average size of the DNA fragments after chromatin sonication. The peaks frame the actual binding location of the precipitated protein. The script that performs peak calling must be able to recognize the strand-specific peaks, calculate average distance between them and transform the double strand-specific peaks into a single protein-binding one.
2.3 Snail/Scratch superfamily
The Snail/Scratch superfamily of TFs is a subgroup in the superfamily of zinc finger TFs.
2.3.1 Discovery of Snail
The founding member of the superfamily was identified in Drosophila by the team of C. Nüsslein-Volhard, E. Wieschaus and I. Kluding in the screen for Drosophila mutations affecting embryonic development. Mutant embryos displayed a phenotype that resembled a snail and were defective in mesoderm invagination during gastrulation (Alberga et al., 1991; Leptin and Grunewald, 1990; Simpson, 1983; Wieschaus et al., 1984). Later similar proteins were discovered in multiple species throughout the animal kingdom (Barrallo- Gimeno and Nieto, 2009; Hemavathy et al., 2000; Nieto, 2002; Wu and Zhou, 2010). The entire group of TFs was named after the first discovered member: “Snail-like family of TFs”
or simply “Snail-like TFs”. Together with the closely related Scratch family they form the Snail/Scratch superfamily of zinc-finger TFs.
2.3.2 Structure of Snail-like TFs
A typical Snail-like TF consists of five (sometimes six) C
2H
2type zinc-finger DNA binding domains on the C-terminus (reviewed in Knight and Shimeld, 2001; Nieto, 2002).
The zinc fingers share high levels of homology between organisms (50-70% between fly and human TFs: Hemavathy et al., 2000). The more divergent N-termini of Snail-like TFs contain conserved motifs that mediate interaction with co-repressor proteins: the CtBP (carboxy-terminal binding protein) domain in Drosophila and other insects or the SNAG (Snail/Gfi) domain in vertebrates and some invertebrates (Barrallo-Gimeno and Nieto, 2009; Langeland et al., 1998; Nakayama et al., 1998; Nibu et al., 1998a, 1998b; Nieto, 2002;
Qi et al., 2008).
2.3.3 The diversity of Snail/Scratch superfamily of TFs
More than 150 genes of the Snail/Scratch superfamily were characterized in 52
species ranging from placozoan Trichoplax to Homo sapiens. Apart from the founding family
member the Drosophila genome encodes two additional Snail-like TFs, worniu and escargot,
as well as three scratch genes: scratch, scratch-like1 and scratch-like2 (Barrallo-Gimeno and Nieto, 2009; Hemavathy et al., 2000; Nieto, 2002; Wu and Zhou, 2010).
The mouse genome contains Snai1 (Snail), Snai2 (Slug), Snai3 (Smuc) and two homologues of scratch: Scrt1 and Scrt2. In the human genome the members of Snail/Scratch superfamily genes are very similar to the mouse gene: SNAI1 (SNAIL), SNAI1P1, SNAI2 (SLUG), SCRT1 and SCRT2 (Barrallo-Gimeno and Nieto, 2009; Hemavathy et al., 2000; Nieto, 2002; Wu and Zhou, 2010).
2.3.4 Evolution of Snail/Scratch superfamily
The six genes of the Drosophila Snail/Scratch superfamily, which are present in all twelve Drosophila species with sequenced genomes, are the result of a tandem duplication of a single ancestral snail and a single scratch gene. In all other insects, including the closely related Dipteran mosquitoes, a full set of scratch genes is present, whereas only one snail member can be found. Out of three genes of the Drosophila Snail-like family, non- Drosophilidae snail has highest homology with escargot. Therefore snail and worniu genes can be considered as a product of a tandem duplication of escargot (fig. 5; Barrallo-Gimeno and Nieto, 2009).
2.3.5 General functions of Snail-like TFs
Snail-like TFs are best known for triggering epithelial-mesenchymal transition
(EMT) and, consequently, for their involvement in multiple cancer types (reviewed in Wu
and Zhou, 2010). However, the family is also involved in mammalian gastrulation (Carver et
al., 2001), cell cycle progression, apoptosis, control of the neuronal stem cell self-renewal
process and pluripotency (reviewed in Barrallo-Gimeno and Nieto, 2009 and Nieto, 2002).
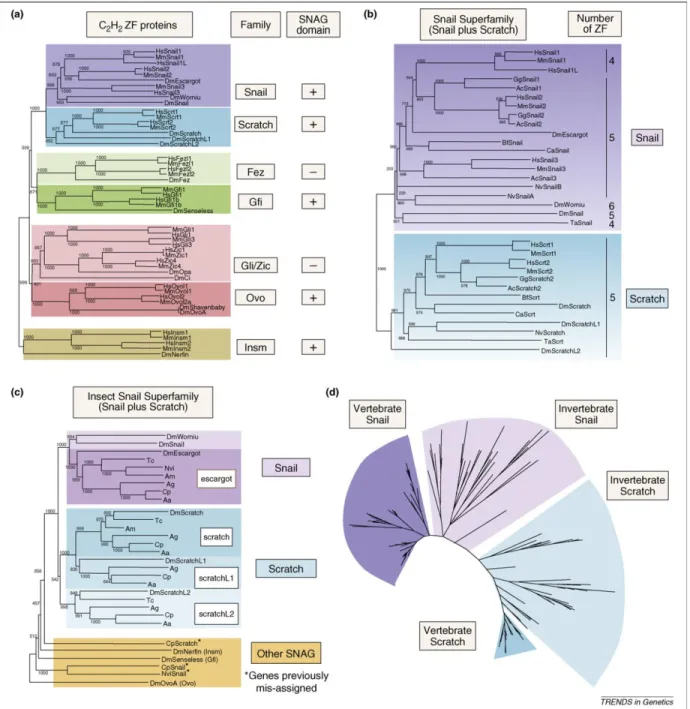
Figure 5. Evolution of Snail/Scratch superfamily (from Barrallo-Gimeno and Nieto, 2009).
a. Snail/Scratch superfamily and its evolutionary relationship to other conserved C2H2 TFs. Neighbor-joining (NJ) phylogenetic tree including Drosophila and vertebrate (mouse and human orthologues). Additional columns show the name of the family and the presence of the SNAG domain.
b. NJ phylogenetic tree of the Snail/Scratch superfamily. Drosophila and vertebrate members are shown. The number of the zinc fingers is given.
c. The Snail/Scratch superfamily in insects. The tandem duplication of the escargot gene is unique for Drosophila. In contrary, duplication of scratch is characteristic for all insect species studied. Some genes annotated as Snail do not belong to the Snail/Scratch superfamily (labeled with asterisk).
d. Phylogenetic tree of the Snail/Scratch superfamily generated by the BI method, 153 sequences from 52 species are included.
As a mammalian proto-oncogene, Snail regulates the expression of matrix metalloproteases (MT1-MMP, MT4-MMP, MMP9), the enzymes that degrade extracellular matrix and increase the motility of a cell (Huang et al., 2009; Shields et al., 2012; Welch- Reardon et al., 2014; Zhang et al., 2011). In mice and chick embryos Snail regulates cell- cycle progression and survival, particularly the components of the early to late G1 transition and the G1/S checkpoint, including repression of Cyclin D2 transcription and the increase of p21/Cip1 expression (Takahashi et al., 2004; Vega et al., 2004). snail-like genes are employed in different types of cell migration, such as migration of neural crest cells of Xenopus (Aybar et al., 2003), and in the anterior migration of the axial mesendoderm of zebrafish (Blanco et al., 2007). Snail-like TFs trigger migration of multiple cancer tumors (Hu et al., 2008; Usami et al., 2008).
snail-like genes regulate several aspects of stem cell biology. Transient co-expression of Slug, a homolog of Snail, together with Sox9, converts differentiated luminal cells of the mammary gland into mammary stem cells (Guo et al., 2012). The combination of Slug and Sox9 activates an endogenous stem cell auto-regulatory network, which remains stable for many days after silencing of the ectopic TF genes. Moreover, Slug and Sox9 are overexpressed in multiple metastatic cancer tumors (Guo et al., 2012). In the mouse embryonic cortex genetic ablation of Snail-like family leads to p53 dependent cell death of neurons and neuronal precursors. Loss of snail-like family causes a decrease in proliferation of neonatal cortical neural precursors and mis-localization as well as mis-specification of cortical neurons (Zander et al., 2014a).
2.3.6 Snail-like TFs in mammalian neurogenesis
Throughout the animal kingdom Snail-like TFs regulate different aspects of neurogenesis. In mammals Snail-like TFs regulate embryonic radial precursor proliferation and survival by regulation of two distinct targets: p53 and cdc25b, while Snail/Scratch superfamily member Scratch regulates delamination of newborn cortical neurons from the cortical apical epithelium by transcriptionally repressing downstream targets like the neurogenins and E-cadherin (Zander et al., 2014a, 2014b). In the embryonic cortex Snail-like TFs regulate radial precursor numbers and proliferation as well as neuronal localization.
Inducible ablation of Snail-like TFs in embryonic precursors and their progeny in the
postnatal cortex leads to deficits of postnatal precursors and neurons (Zander et al., 2014a).
Together with Sox10, Snail-like TFs are expressed in neural crescent stem cells and specifically marks undifferentiated cells (Guo et al., 2012; Motohashi et al., 2007; Xu et al., 2014).
Scratch1 and Scratch2 are expressed downstream of pro-neural genes and control the very first step of neuronal migration; namely the cell´s departure from the ventricular surface (Itoh et al., 2013; Roark et al., 1995).
2.3.7 Regulation of the activity of Snail-like TFs
The expression of Snail-like TFs is tightly regulated by several major signaling pathways, such as FGF, EGF, TGFβ and BMP (Ciruna and Rossant, 2001; Haraguchi, 2009; Lu et al., 2003).
Subcellular localization of vertebrate Snail-like family members is tightly controlled.
Nuclear transportation of Snail-like TFs is controlled by nuclear karyopherins, among them importin alpha, which imports Snail-like TFs into the nucleus in a zinc-finger dependent manner and exportin 1 together with exportin 5 as major exporters (Muqbil et al., 2014;
Yamasaki et al., 2005). Mouse Snail-like TFs, containing a leucin-rich nuclear exclusion signal (LX
(1-3)LX
(2-3)LX
(1-2)L), shuttles between cytoplasm and nucleus, while an NES is not present in Slug, whose localization is found to be exclusively nuclear (Lischka et al., 2001).
Multiple kinases and phosphatases (e.g. Lats2 and SCP) link nuclear transport of Snail-like TFs to WNT, TGFβ and FGF signaling pathways (Kim et al., 2012; Muqbil et al., 2014).
The stability of Snail-like TFs is regulated by molecular interactions and post- translational modifications. In mammalian cells the catalytic domains of the lysine hydroxylases, LOXL2 and LOXL3, bind to the N-terminal domain of Snail1, but not Snail2 to repress E-cadherin transcription and cause an EMT (reviewed in Peinado et al., 2007).
Snail1 and Snail2 use their SNAG domains, bind to the LIM domains of the co-repressor proteins LIMD1 and WTIP, recruit them to the nucleus and enhance repression. Mammalian Snail1 and Snail2 are regulated via phosphorylation by GSK3β which causes their ubiquitination and degradation (reviewed in Sou et al., 2010).
No data about post-translational modifications and regulations is available for
Drosophila Snail-like TFs.
2.4 Snail/Scratch superfamily in Drosophila
2.4.1 Family 1: Snail-like TFs
There are three snail genes in Drosophila genome. snail together with its paralogs worniu and escargot is located in tandem duplication on the second chromosome (fig. 6), in the cytogenetic region 35D. The C-terminal domains of the proteins consist of five (six in Worniu) zinc-finger domains, which share 75-85% of homology in amino-acid sequence. N- terminal domains contain Ebi and dCtBP-interaction amino-acid motif (Ashraf and Ip, 2001;
Ashraf et al., 1999).
Figure 6. Localization of snail, worniu and escargot (red arrows) on the second chromosome of Drosophila.
Screenshot of the Dmel UCSC genome browser. http://genome.ucsc.edu/
2.4.2 Family 2: Scratch
Scratch is a Snail-like pan-neural TF, named after the mild rough eye phenotype characteristic for homozygous mutant flies. Scratch together with snail, worniu, hunchback (hb) and deadpan (dpn) form the group of the embryonic pan-neuronal TFs. Unlike the other TFs of this group, scratch expression persists in ganglion mother cells (GMCs; Roark et al., 1995). scratch mutants do not exhibit mutant embryonic phenotypes, however the combination of scratch and dpn mutation leads to the drastically reduced number of neuroblasts. Ectopic expression of scratch results in the formation of additional neuronal clusters (Roark et al., 1995). At later developmental stages scratch expression can be detected in the central nervous system (CNS) and peripheral nervous system (PNS), as well as in the neuronal cells of the imaginal discs. Adult mutant flies show mild rough eyes and impaired bristle polarity.
Two paralogues of scratch, namely scratch-like1 and scratch-like2, were annotated in
the Drosophila genome. Their function is unknown.
2.5 Functions of Snail in Drosophila embryogenesis
2.5.1 Snail in mesoderm invagination
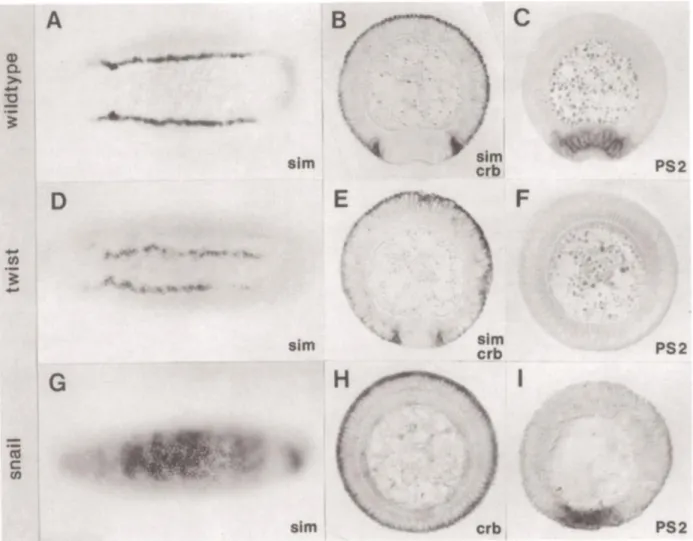
Snail is the only Snail-like TF in the Drosophila genome that is expressed in the mesoderm and has mesoderm-specific functions. In mesoderm during gastrulation Snail represses ectoderm and mesectoderm determinants, e.g. rhomboid (rho) and single minded (sim) (Leptin, 1991; fig. 7). snail mutations arrest disassembly of the junctions at sub-apical positions and disable apical constriction of the mesoderm cells (Kölsch et al., 2007; Martin et al., 2010) interfering with gastrulation.
As a repressor, Snail interacts with the co-repressor proteins Ebi and CtBP (Nibu et al., 1998a, 1998b; Qi et al., 2008) and prevents the formation of enhancer-promoter loops, in this manner disrupting target-gene activation (Chopra and Levine, 2009). However, Snail works both as a transcriptional repressor and as a transcriptional activator. Gene expression profiling of snail mutant embryos showed that 53% of differently expressed genes are up-regulated, i.e. repressed by Snail in wild type. The remaining 47% are down- regulated, in other words activated by the Snail protein. Detailed analysis for expression profiles of Snail-activated enhancers with wild type and mutated Snail binding sites proved that the transcriptional activation arises from direct binding of Snail to enhancer DNA, not by de-repression of a third party transcriptional activator (Rembold et al., 2014).
In contrast to the majority of mesodermal TFs, which are required for the post-
gastrulation differentiation of the mesoderm-derived tissues, Snail is expressed in
mesoderm only transiently. At stage 7 mesodermal expression of snail ceases. Instead snail
expression emerges in the neuroblasts, the precursors of the central nervous system
(Alberga et al., 1991; Ip et al., 1994; Kosman et al., 1991; Leptin, 1991).
Figure 7. Twist and Snail as a pair of positive and negative transcription regulators of gene expression during Drosophila gastrulation. (Figure and legend from from Leptin, 1991).
a., d., g. Ventral views of in situ hybridizations of whole-mount embryos at cellular blastoderm; all other panels are transverse sections of embryos during early gastrulation, dorsal side up.
b., c. the ventral furrow has begun to form.
a., d., g. sim is expressed in two stripes, each one cell wide, at the edge of the mesoderm in twist mutants these lines lie closer together (d.).
g. in snail mutants, the gene is expressed over the whole width of the mesodermal territory.
b., e. Embryos hybridized simultaneously with probes for sim and crumbs. Because crumbs RNA is localized only in the apical part of each cell and sim is distributed over the whole cytoplasm, their expression domains can be distinguished in sectioned embryos. In twist- embryos, both the sim cells and the edges of the crumbs domain lie farther ventrally and closer to each other than in wild type.
h. snail mutant hybridized with the crumbs probe. crumbs is expressed around the whole periphery of the embryo.
c., f., i. Embryos hybridized with a PS2 probe. PS2 is not expressed in twist mutants (f.) but is expressed normally in snail mutants (i.). In embryos mutant for both twist and snail, the crumbs expression pattern looks like that in (h.), and PS2 looks like that in (f.).
Expression of snail in mesoderm and in neuroblasts is regulated by several different enhancers (Dunipace et al., 2011; Ip et al., 1994; Perry et al., 2010). Mesoderm expression is driven by two enhancers: a proximal enhancer (within 2.8 kb upstream from the start site) and a distal “shadow” enhancer (located within the exon of the neighbor gene Tim17b2).
The two enhancers generate similar mesodermal expression patterns. Each enhancer is fully able to recapitulate expression of the gene and a BAC transgene containing either of the enhancers is able to rescue the gastrulation. However, under extreme heat shock conditions only the presence of both enhancers ensures robust gastrulation (Perry et al., 2010). The neurogenic expression of snail is controlled by two enhancer elements with two distinct expression patterns. One, proximal, localized within 1 kb upstream the start site, drives expression of snail in the peripheral nervous system, while the second, distal (2-3 kb upstream), is required for snail expression in the central nervous system (Ashraf and Ip, 2001; Ip et al., 1994; fig. 8).
Figure 8. The upstream flanking region of the snail gene. The cis regulatory modules are represented as horizontal bars and the transcription start site (+1 bp) is indicated by the arrow. CNS denotes the region of the snail enhancer required for expression in the central nervous system and includes expression in early neuroectoderm cells, neuroblasts and postmitotic neurons. PNS denotes the region of the snail enhancer sufficient for expression in PNS sensory mother precursor cells and in postmitotic neurons. Meso is the enhancer element required for mesoderm expression. (modified from Ip et al., 1994).
2.6 Early Drosophila neurogenesis
The formation of the embryonic nervous system in Drosophila starts with the delamination of single cells – neuroblasts (Nb) – from the neurogenic ectoderm.
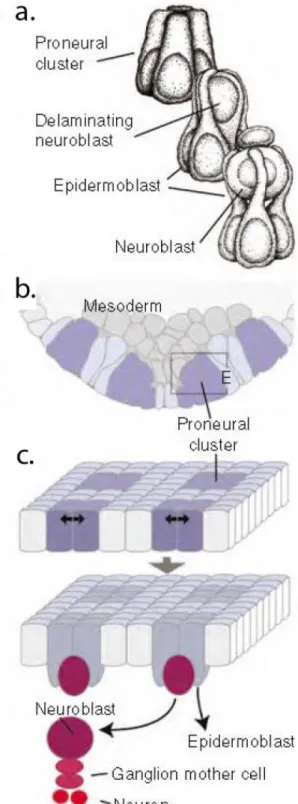
At late stage 8 the expression of patterning genes in the ectoderm identifies 10 groups of 6-8 cells per each hemisegment. These cells, defined as the “proneural clusters”, express combinations of the three proneural genes: achaete, scute and lethal of scute (Cabrera et al., 1987; Romani et al., 1987; Skeath and Carroll, 1992). Via lateral inhibition, a Notch signaling dependent process, one cell is selected to become a neuroblast. The remaining cells develop into epidermoblasts. The neuroblast cell delaminates from the single cell layer of epidermal ectoderm via cell shape changes, summarized in fig. 9 (from Hartenstein and Wodarz, 2013, originally published in Doe, 1992; reviewed in Hartenstein and Wodarz, 2013; Kohwi and Doe, 2013).
Neuroblasts delaminate following a stereotyped spatiotemporal pattern, repeated in
every body segment. The neuroblast segregation occurs in five delamination waves: SI, SII,
SIII, SIV and SV (Doe, 1992; Hartenstein and Campos-Ortega, 1984). The location of a
neuroblast within the delamination pattern identifies neuroblast lineage characteristics and
the future identity of the neuroblast’s progeny. Multiple studies were performed to
generate a precise maps of neuroblast formation patterns (Broadus and Doe, 1995; Doe,
1992; fig. 10). After delamination the mitotic spindle of the neuroblast rotates to change its
orientation from lateral-lateral to apical-basal and the cell starts division in a stem cell
mode to produce a new neuroblast and a GMC which divides later again to generate a pair
of cells (a neuron and/or a glia cell; Campos-Ortega, 1993, 1994)
Figure 9. Neuroblast delamination. The figure and the legend are modified from (Hartenstein and Wodarz, 2013).
d. Artistic rendering of proneural cluster before (top), during (middle) and after neuroblast delamination (bottom;
Reprinted from Doe, 1992; Copyright 1992 The Company of Biologists).
c. Schematic cross-section of neuroectoderm, indicating pattern of proneural clusters (purple shading).
f. Two-step model of neuroblast specification. Expression of proneural genes defines proneural clusters (top);
lateral inhibition in each cluster selects neuroblast (bottom).
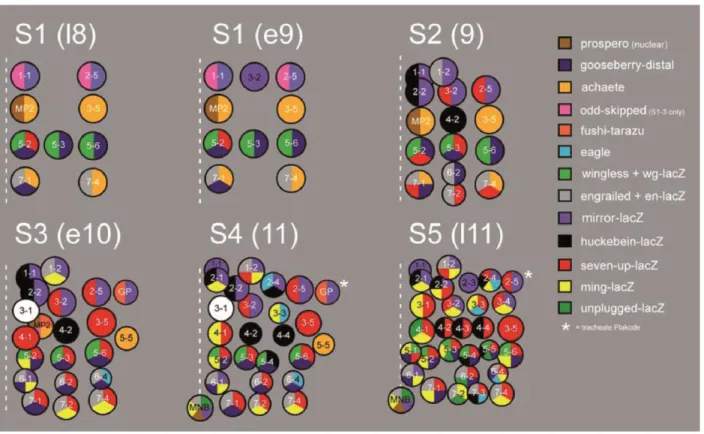
Individual number was specified for each neuroblast lineage. The first wave of delamination forms the neuroblasts 1-1, 3-2, 2-5, MP2, 3-5, 5-2, 5-3, 5-6, 7-1 and 7-4.
Second wave generates the neuroblasts num. 1-2, 2-2, 4-2, 6-2 and 7-2 (fig. 10). Following delamination waves contribute more lineages to the neuroblast population. Each lineage has its unique spatial localization within a segment as well as an individual set of TFs and cellular markers expressed in the cell. For instance, during the second wave of delamination wingless expression is characteristic for the neuroblasts 5-2, 5-3 and 5-6, while the expression of engrailed marks the cells 6-2, 7-1, 7-2 and 7-4. Expression of cell-specific markers enables the identification of neuroblast cell identity (Doe, 1992).
Figure 10. The map of neuroblast delamination according to (Broadus and Doe, 1995; Doe, 1992).
Each delaminating neuroblast expresses a specific combination of the marker genes, which allows precise identification of the neuroblast identity. The expression of the marker genes is represented in a color code. Every cartoon shows one hemisegment; anterior is at the top, dot line indicates the embryonic midline. The asterisk marks the location of the trachea (the segment border).
The figure and the legend are modified from the PhD thesis of Christian Berger (Gerd Technau group, Mainz, 2004).
In addition to the spatial differentiation by the expression of a specific set of TFs and
cellular markers, neuroblasts show also a temporal succession of the TFs expression. At the
embryonic developmental stages 9-10 neuroblasts express the transcriptional factor Hb. At the time point that differ for each neuroblast, the cell starts expression of seven-up (svp), which down-regulates expression of hb and starts expression of kruppel (kr) (Kanai et al., 2005). Later in development expression of kr is substituted by pdm. Altogether the stereotypic sequence of time-specific TFs expressed in the neuroblasts can be summarized as: hb -> svp -> kr -> pdm (Isshiki et al., 2001; Kambadur et al., 1998; Novotny et al., 2002).
The neuroblast cells consequently switch TF expression profiles, while all cells of neuroblast’s progeny (GMC and neurons) maintain the TF identity of the ancestor neuroblast at the moment of neuroblast division. Thus, the progeny of each single neuroblast is segregated according to the neuroblast’s temporal identity (Li et al., 2013).
The mechanisms of such temporal transition are poorly understood and remain mainly speculative. Nevertheless, isolated neural stem cells cultured in vitro are able to recapitulate the sequential generation of different neuron types indicating a cell-intrinsic control of TF temporal patterning (Brody and Odenwald, 2000; Grosskortenhaus et al., 2005).
MP2 is a special cell among the neuroblast pool. While all other neuroblast cells divide asymmetrically to produce one GMC and one new neuroblast, MP2 divides symmetrically to generate two neurons (vMP2 and dMP2; Doe et al., 1988; Thomas et al., 1988), i.e. it is a neuroblast which does not possess stem cell identity.
During late embryogenesis the neuroblasts become quiescent to re-enter cell cycle and start a second wave of neurogenesis in larvae.
2.7 Roles of Snail, Worniu and Escargot
2.7.1 Snail-like TFs in development of the central nervous system
In early neurogenesis Snail, Worniu and Escargot act in concert. Their DNA-binding
zinc-finger domains are highly similar and show 85% (118/139 amino acids) homology
between Escargot and Worniu, and 74% (103/139 amino acids) homology between Snail
and Worniu (Ashraf et al., 1999). The DNA binding motif of Snail and Escargot is almost
identical (Fuse et al., 1994; Mauhin et al., 1993).
In the embryonic CNS Snail, Worniu and Escargot have strong functional redundancy. The deletion of just one gene has no significant effect on the expression of CNS markers. In contrast, the embryos with double deletion of snail/worniu or triple deletion of snail/worniu/escargot lose expression of the early CNS marker genes even skipped and fushi tarazu. The expression of inscuteable (insc), a regulator of asymmetric cell division in neuroblasts, is lost. Thus, the subsequent division and differentiation of neuroblasts in double- and triple-mutant embryos is defective. Surprisingly, the neuroblast delamination from the neuroectoderm was reported to occur in the mutant embryos without major problems. Expression of the early neuroblast markers (hunchback, achaete, deadpan, scratch, lethal of scute) was reported to be unchanged (Ashraf et al., 1999; Ashraf and Ip, 2001; Cai et al., 2001).
The transgenic expression of either a snail, worniu or escargot transgene under control of the neuroblast-specific snail 2.8 kb enhancer partially rescues expression of fushi tarazu and inscuteable in CNS the neuroblast of snail/worniu/escargot triple deletion mutants (Ashraf and Ip, 2001; Ashraf et al., 1999). In contrast, ectopic expression of worniu or escargot in the mesoderm is not able rescue the snail mutant gastrulation phenotype (Ashraf and Ip, 2001; Hemavathy et al., 2004).
The transgenic expression of worniu, in the mesoderm under the 2.8-kb snail promoter cannot rescue the mesodermal phenotypes of snail mutation. However, if the Worniu zinc-fingers are fused to the Snail N-terminus a certain degree of rescue is achieved.
Another chimeric construct, the DNA-binding Snail zinc-fingers fused to the Worniu N- terminus is not functional (Hemavathy et al., 2004). That indicates that, (a) Snail and Worniu bind similar, if not the same DNA sequences and (b) that the N-terminus of Snail has unique mesoderm-specific functions that cannot be replaced by Worniu.
In summary, Snail cooperates with it paralogs in a context-dependent way. While it alone is sufficient to ensure mesoderm development and gastrulation, it acts in synergy with Escargot and Worniu during neuroblast development.
2.7.2 Other functions of worniu
Expression of worniu starts with formation of the first neuroblasts (stage 8) and
persists in the neuroblast cells of the developing nerve system (Ashraf and Ip, 2001; Lai et
al., 2012). At stage 13 worniu expression is detectable in the developing brain hemispheres and in the ventral nerve cord. At late embryonic stages worniu expression is down- regulated and almost gone by stage 16, that correlates with the gradually lower activity of embryonic neuroblasts. During larval development worniu expression can be detected in the proliferating centers of brain hemispheres (Ashraf et al., 2004).
worniu is required to maintain stem cell identity of larval neuroblasts (Lai et al., 2012). Expression profiling showed down-regulation of neuroblast-specific genes and up- regulation of neuroblast differentiation genes in worniu mutant cells. worniu maintains neuroblast self-renewal in two ways: it promotes cell-cycle progression and suppresses the levels of Elav protein to inhibit premature cell differentiation (Lai et al., 2012). RNAi experiments proved that worniu is required for brain development in larvae: loss of worniu expression (via shRNA injections) results in abnormal elongated brain morphology (Ashraf et al., 2004).
2.7.3 Other functions of escargot
Escargot is the third Snail-like TF, which is expressed in Drosophila neuroblasts.
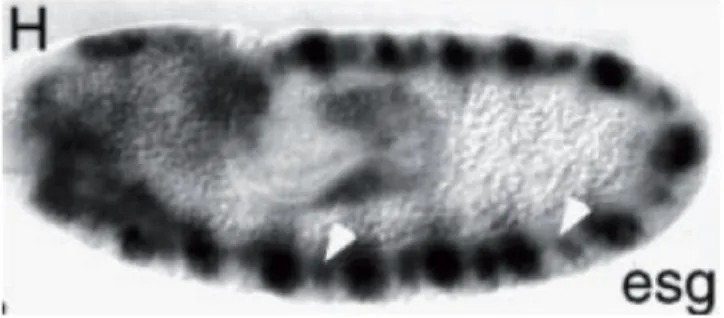
Neuroblast-specific expression of escargot was reported as transient (Ashraf et al., 1999:
fig. 11), while escargot is actively expressed in the neuroectoderm, a neuroblast-generating tissue (Whiteley et al., 1992).
Figure 11. Expression of escargot in Drosophila embryo at stage 10. Color in situ hybridization. The embryo is shown from the lateral side; anterior is to the left. escargot-positive CNS precursors are indicated by white arrows. (The figure and the legend are from Ashraf et al., 1999).