Article
PD-L1 Influences Cell Spreading, Migration and Invasion in Head and Neck Cancer Cells
Jonas Eichberger
1,2, Daniela Schulz
1,2, Kristian Pscheidl
1, Mathias Fiedler
1,2, Torsten Eugen Reichert
1, Richard Josef Bauer
1,2,*
,†and Tobias Ettl
1,†1
Department of Oral and Maxillofacial Surgery, University Hospital Regensburg, 9305 Regensburg, Germany;
Jonas.Eichberger@stud.uni-regensburg.de (J.E.); daniela.schulz@ukr.de (D.S.);
Kristian.Pscheidl@stud.uni-regensburg.de (K.P.); mathias.fiedler@web.de (M.F.);
torsten.reichert@ukr.de (T.E.R.); tobias.ettl@ukr.de (T.E.)
2
Department of Oral and Maxillofacial Surgery and Center for Medical Biotechnology, University Hospital Regensburg, 9305 Regensburg, Germany
* Correspondence: richard.bauer@ukr.de
† These authors contributed equally to this work.
Received: 22 September 2020; Accepted: 27 October 2020; Published: 29 October 2020
Abstract: The programmed cell death protein-1 (PD-1)/programmed cell death ligand-1 (PD-L1) axis blockade has been implemented in advanced-stage tumor therapy for various entities, including head and neck squamous cell carcinoma (HNSCC). Despite a promising tumor response in a subgroup of HNSCC patients, the majority suffer from disease progression. PD-L1 is known to influence several intrinsic mechanisms in cancer cells, such as proliferation, apoptosis, migration and invasion. Here, we modulated PD-L1 expression in three HNSCC cell lines with differential intrinsic PD-L1 expression.
In addition to an alteration in the epithelial-to-mesenchymal transition (EMT) marker expression, we observed PD-L1-dependent cell spreading, migration and invasion in a spheroid spreading assay on four different coatings (poly-L-lysine, collagen type I, fibronectin and Matrigel
®) and a chemotactic transwell migration/invasion assay. Furthermore, the overexpression of PD-L1 led to increased gene expression and small interfering ribonucleic acid (siRNA) knockdown and decreased gene expression of Rho-GTPases and related proteins in a RT
2Profiler™ PCR Array. Rac1 and Rho-GTPase pulldown assays revealed a change in the activation state concordantly with PD-L1 expression. In summary, our results suggest a major role for PD-L1 in favoring cell motility, including cell spreading, migration and invasion. This is presumably caused by altered N-cadherin expression and changes in the activation states of small Rho-GTPases Rho and Rac1.
Keywords: PD-L1; head and neck squamous cell carcinoma; HNSCC; Rho-GTPase; migration; invasion
1. Introduction
Head and neck cancer is the seventh most common form of malignancies worldwide, accounting for more than 880,000 new cases and 453,000 fatalities in 2018, and is particularly increasing in low- to middle-income countries [1]. The most effective treatment is a multidisciplinary approach including surgery, radio- and chemotherapy and increasingly targeted therapies. While surgery or radiotherapy alone are the established methods for early stage I or II disease, multimodal therapy is necessary for patients with locally advanced stages of cancer [2]. Immunotherapy plays a major role in recurrent or metastatic head and neck cancer therapy. The programmed cell death protein-1 (PD-1)/programmed cell death ligand-1 (PD-L1) axis blockade has achieved revolutionary therapeutic success [3–5]. Meanwhile, anti-PD-1 drugs nivolumab and pembrolizumab are Food and Drug Administration (FDA)-approved to treat recurrent and metastatic head and neck squamous
Int. J. Mol. Sci.2020,21, 8089; doi:10.3390/ijms21218089 www.mdpi.com/journal/ijms
cell carcinoma (HNSCC). PD-1 is a 55 kDa type I transmembrane protein present on a variety of cells, including the membrane of thymocytes during selection as well as on mature B- and T-cells, antigen-presenting cells (APCs) and activated monocytes [6–8]. The expression of its two main ligands, PD-L1 and programmed cell death ligand 2 (PD-L2), can be constitutive or inducible. PD-L1 is found in lymphatic organs such as spleen and thymus. It is also expressed on a variety of different nonhematopoietic tissues, including cancer cells. The presence of PD-L2 is restricted to dendritic cells mainly in the thymic cortex [9]. The expression of PD-L1 is, for instance, induced by the activation of toll-like receptors and interferon (IFN)- γ -activated signaling pathways [10,11]. The interaction with PD-1 ultimately results in the suppression of T-cell response by the dephosphorylation of signaling cascades downstream to the T-cell receptor [12], which is physiologically desirable for central and peripheral tolerance under normal conditions. During cancer progression, tumor cells exploit the PD-1/PD-L1 signaling axis to evade the immune system. So far, PD-L1 expression has been found in various tumor entities, including breast, lung and colorectal cancer, glioblastoma, melanoma and head and neck cancers. In all these tumors, PD-L1 expression was strongly associated with poor prognosis [13–18]. Studies in patients with recurrent and/or metastatic head and neck squamous cell carcinoma showed a significantly better overall survival with the clinical use of antibodies against PD-1, such as nivolumab and pembrolizumab [19,20]. Part of this patient cohort still suffers from little improvement or even disease hyperprogression. The reason why patients respond differently to anti-PD-1 treatment is not clear yet. However, it could be due to an immune-system-independent mode of action of PD-L1. Several independent studies have recently suggested that PD-L1 may have intrinsic effects on cellular behavior [21–23]. Here, we present data demonstrating the role of PD-L1 in cell motility, including cell spreading, migration and invasion, thus creating the potential for lymph node and distant metastasis. Recent studies have shown a positive correlation between PD-L1 and epithelial-to-mesenchymal transition (EMT) expression in epithelial tumors, suggesting higher migrational and invasive capabilities [24–27]. Therefore, we investigated the possible role of PD-L1 in cell migration and invasion by studying the expression levels of epithelial and mesenchymal markers and conducting various functional assays with different types of HNSCC cell lines. We identified different genes involved in cell motility that could be possibly regulated by PD-L1 by performing RT
2Profiler™ PCR Array Human Cell Motility. Furthermore, triggered by the results of those arrays, we investigated the different expression levels and activation states of small GTPases of the Rho family, enzymes that are vital for the organization and stabilization of the cytoskeleton.
2. Results
Our previous studies revealed HNSCC cell lines with low (PCI 13), moderate (PCI 8) and high (PCI 52) PD-L1 expression. We demonstrated that PD-L1 expression is associated with radioresistance, proliferation and the expression of markers for the epithelial-to-mesenchymal transition (EMT) [28].
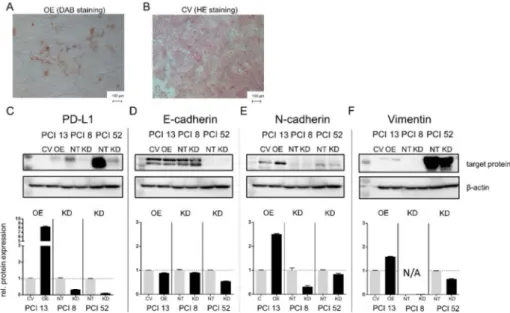
Immunocytochemical staining of PD-L1-overexpressing HNSCC cells revealed an elongated, spindle-shaped morphology, which additionally indicates EMT. In contrast, cells transfected with a control vector that were subsequently stained by HE showed a characteristic consistent cobblestone morphology typical for epithelial cells (Figure 1).
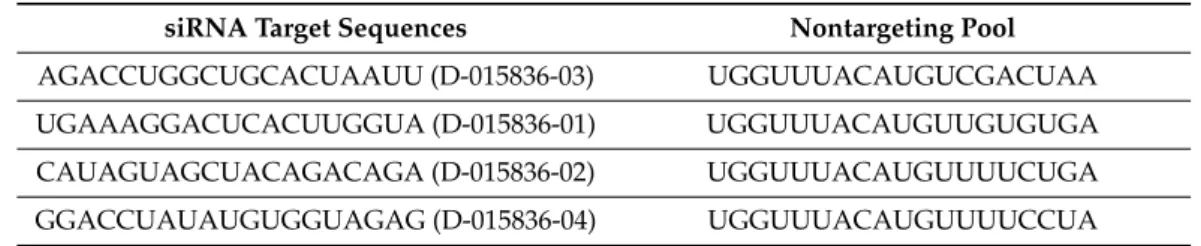
Cells with a switch in the EMT program are often equipped with an increased migratory capacity and changes in integrin-dependent adhesion [29]. Therefore, we hypothesized that PD-L1 expression might be associated with migration and/or invasion changes, which also affects cytoskeletal protein expression. In the following experiments, PD-L1 expression was reduced via siRNA knockdown in intrinsically high and moderate PD-L1-expressing cell lines PCI 8 and PCI 52 and overexpressed via plasmid transfection in the low PD-L1-expressing cell line PCI 13.
Figure 1C indicates the efficiency of PD-L1 overexpression (OE) and knockdown (KD) in 3D
cultured cells. HNSCC cell lines with low and moderate intrinsic PD-L1 expression (PCI 13 control
vector (CV) and PCI 8 nontargeting (NT)) demonstrated a distinct E-cadherin expression, a marker
for epithelial cell adhesion. In contrast, the cell line PCI 52 with a high intrinsic PD-L1 expression
(NT) revealed only a minor E-cadherin expression. Here, either PD-L1 OE or KD did not markedly alter E-cadherin expression (Figure 1D). PCI 13 control cells (CV) revealed an intrinsic expression of N-cadherin and Vimentin with PD-L1 overexpression leading to the increased expression of both proteins (Figure 1E,F). PCI 8 control cells (NT) contained slight intrinsic N-cadherin levels, which were diminished by PD-L1 KD. PCI 52 showed a moderate intrinsic N-cadherin (NT) expression, which was only slightly influenced by PD-L1 KD (Figure 1E). There was a slight intrinsic Vimentin protein expression in PCI 13 control cells (NT) and strong expression in the PD-L1 high-expressing cell line PCI 52 (CV). Here, Vimentin expression was influenced by PD-L1 OE and KD (Figure 1F).
Figure 1. PD-L1 dependent expression of EMT markers. (A) Programmed cell death ligand-1 (PD-L1)-dependent expression of epithelial-to-mesenchymal transition (EMT) markers in 3D cultured cells may lead to morphological changes. PD-L1 overexpression in the head and neck squamous cell carcinoma (HNSCC) cell line PCI 13 with low intrinsic PD-L1 expression. Immunocytochemical staining reveals that PD-L1 overexpression resulted in cells with an elongated spindle-shaped morphology in contrast to cells transfected with the empty control vector cells (B). (C–F) Western blot analysis of PCI 13 after PD-L1 overexpression (OE) and PCI 8/PCI 52 after PD-L1 knockdown (KD). E-cadherin expression and expression of the mesenchymal markers N-cadherin and Vimentin are associated with PD-L1 expression. Lower lane: semiquantitative evaluation of Western blots for relative protein expression. Treated cells were normalized to their respective control. For Western blot analysis, 30 µg total protein lysate was used. β-actin served as a loading control. The results are expressed as means ± SD (standard deviation) for two experiments. CV = cells transfected with the empty control vector, OE = cells transfected with a vector containing the coding sequence for PD-L1, NT = cells transfected with nontargeting small interfering ribonucleic acid (siRNA) control, KD = knockdown cells transfected with siRNA against PD-L1.
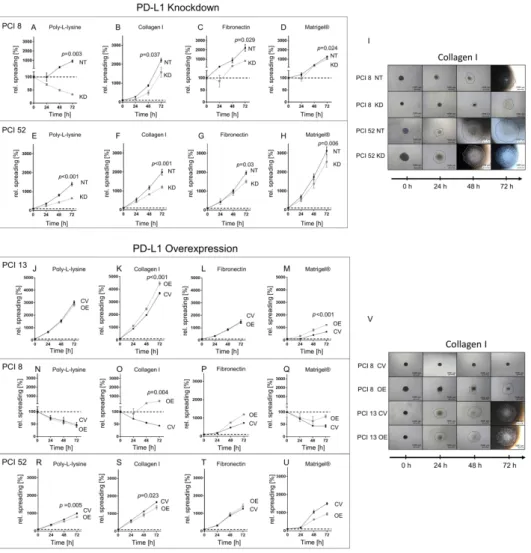
We hypothesized that PD-L1 expression might have an impact on cell spreading. Therefore, we investigated whether the modulation of PD-L1 expression in HNSCC cell lines with different PD-L1 intrinsic expression levels affects the capability of HNSCC cells’ spreading on surfaces coated with different extracellular matrix components (poly-L-lysine, collagen type 1, fibronectin and Matrigel
®(laminin-rich matrix)).
Figure 2 shows the spreading of HNSCC spheroids with low (PCI 13), moderate (PCI 8) and
high (PCI 52) intrinsic PD-L1 expression after siRNA knockdown or overexpression on coatings
with different matrix components within 72 h. Poly-L-lysine coating served as a control coating for
nonspecific integrin-independent adhesion.
Figure 2. PD-L1-dependent cell spreading on various matrices. Spheroids from cell lines with low (PCI 13), moderate (PCI 8) and high PD-L1 expression (PCI 52) were seeded onto four differently coated surfaces: collagen type I, fibronectin and Matrigel
®, a laminin-rich matrix. Poly-L-lysine served as control. Cell spreading was measured over a period of 72 h. The dotted line represents the initial area.
(A–H) Spreading of PCI 8 and 52 spheroids after PD-L1 KD. (I) Exemplified images of cell spreading of NT and PD-L1 KD PCI 8 and PCI 52 spheroids on collagen type I. (J–U) Cell spreading of PD-L1 OE spheroids of PCI 13, PCI 8 and PCI 52. (V) Exemplified images of CV and PD-L1 OE PCI 8 and PCI 13 on collagen type I. Scale bar = 1000 µM, black line depicts spreading area measured and calculated with the ImageJ software. The results are expressed as means ± SD, n = 4; endpoints after 72 h were statistically compared by unpaired Student’s t-test.
PD-L1 KD in PCI 8 spheroids with an intrinsically moderate PD-L1 expression led to cell death on the poly-L-lysine coating resulting in a decrease in the spread of the area. The addition of matrix components led to cell spreading. However, spreading on each of the coatings was significantly reduced in KD cells compared to NT controls (Figure 2).
Compared to poly-L-lysine, PD-L1 KD in intrinsically high PD-L1-expressing PCI 52 spheroids did not show a significant change in their extent of spreading on different matrix components compared to the poly-L-lysine coating. However, when comparing KD cells with NT controls, the spreading of KD cells was significantly reduced in each case.
Additionally, we investigated if PD-L1 OE also affected cell spreading in high and moderate
PD-L1-expressing cells PCI 52 and PCI 8. PD-L1 OE in high-expressing PCI 52 spheroids did not
impact cell spreading on any of the coatings. Interestingly, PD-L1 OE led to increased cell spreading in
moderately-expressing PD-L1 spheroids (PCI 8) on the collagen type I surface coating (Figure 2P,V).
Furthermore, PD-L1 OE in low PD-L1-expressing PCI 13 spheroids demonstrated a significant increase in spreading on coatings with collagen type I (1.2-fold) and Matrigel
®(1.8-fold) (Figure 2K,M,V).
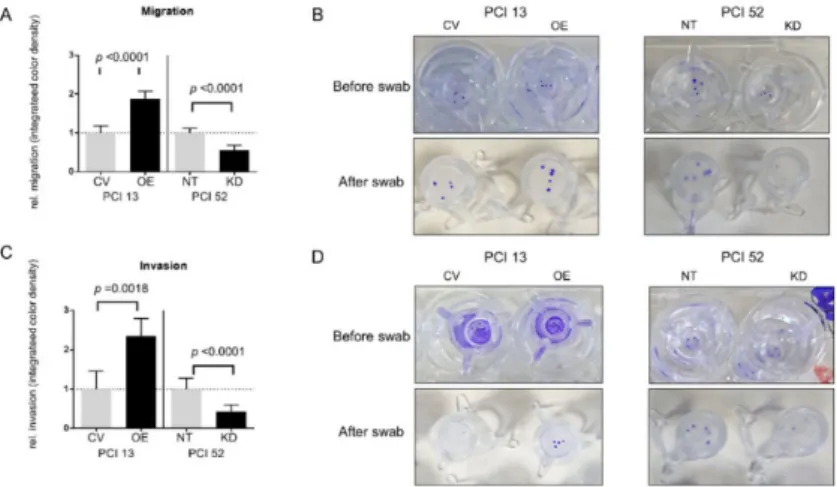
As we observed a PD-L1-dependent difference in the spreading of low-, moderate- and high-expressing HNSCC spheroids on different coatings, we hypothesized that cells would also show PD-L1-dependent migration and invasion along a chemotactic gradient. For this purpose, we observed the behavior of spheroids in Boyden chamber assays. Spheroids of cell lines PCI 13 with an intrinsically low and PCI 52 with an intrinsically high PD-L1 expression were used in the transwell assays. After the modulation of PD-L1 expression, differences in chemotactic migration and invasion were observed in all spheroids compared to their respective controls, which were nontarget (NT) for siRNA knockdown and empty control vector (CV) for overexpression experiments (Figure 3).
Overall, after PD-L1 OE in intrinsically low PD-L1-expressing spheroids (PCI 13), we noticed a significant increase in migration and invasion along the chemotactic gradient. Migration after OE increased by about 1.9-fold. In addition, there was an average 2.4-fold increase in invasion after PD-L1 OE. On the contrary, after siRNA KD, there was a significant 1.8-fold reduction in migration and about a 2.4-fold reduction in invasion compared to control cells in high basal PD-L1-expressing cells (PCI 52).
Figure 3. Influence of PD-L1 on migration and invasion. To evaluate the role of PD-L1 in the migration and invasion of HNSCC cell lines along a chemotactic nutrient gradient, a transwell Boyden chamber assay was conducted. (A,B) Chemotactic migration of PCI 13 and PCI 52 spheroids with PD-L1 siRNA knockdown (KD) or overexpression (OE). PD-L1 overexpression in PCI 13 (OE) showed a significantly increased transwell migration of spheroids compared to control cells (CV). In contrast, there was a markedly reduced migration after siRNA knockdown (KD) in PCI 52 cells compared to control cells (NT). Accordingly, PD-L1 overexpression led to a significantly increased chemotactic invasion of PCI 13 through a thin layer of Matrigel
®and siRNA knockdown in PCI 52 to a marked reduction (C,D). (B,D) Photographic documentation of transwell migration assays before and after swabbing nonmigrated/noninvaded cells. The results are expressed as means ± SD, n = 4; unpaired Student’s t-test.
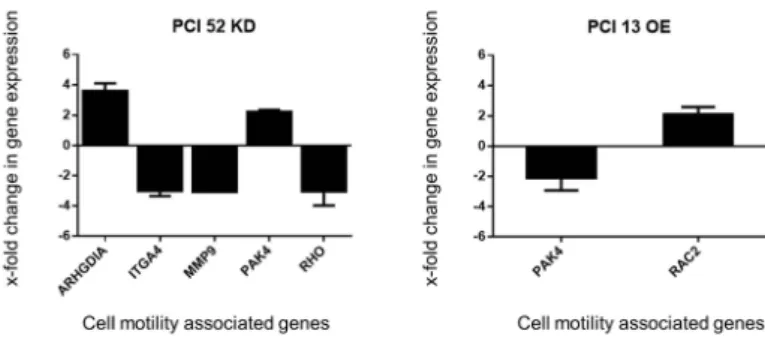
Based on the previous results, we assumed that PD-L1 might influence the gene expression of
proteins that are part of the cytoskeletal structure and its organization. To obtain an insight into
whether there is a PD-L1-dependent expression of cytoskeletal-associated genes, a corresponding
RT
2Profiler™ PCR Array Human Cell Motility array was performed. The intrinsically low and high
PD-L1-expressing PCI 13 and PCI 52 were used exemplarily. In PCI 13 spheroids, PD-L1 was transiently
overexpressed, and in PCI52 spheroids, a transient siRNA knockdown was performed. After PD-L1
modulation, the expression of several genes related to cell motility and cytoskeletal organization was
affected such that they differed by at least two-fold from the expression in NT or CV controls: RAC2,
ARGHDIA, PAK4, ITGA4, MMP9 and RHO (Figure 4).
C PCI 52 KD C
0 0 PCI 13 OE
en en
en 6 en 6
Q) Q)
L.. L..
c.. 4 c..
>< >< 4
Q) Q)
Q) 2 Q) 2
C C
Q) Q)
0) 0 0) 0
C C
·- ·-
Q) -2 Q) -2
0) 0)
C -4 C -4
co co
..c ..c
(_) -6 (_) -6
"'O
9'?- ,}' ~":, ~ ~o "'O ~ v"'
~ I ~(j ~(j ~~ q~ ~ ~ q~ ~
'
I>< ~ ><
Cell motility associated genes Cell motility associated genes