H N P D I S C U S S I O N P A P E R E c o n o m i c s o f To b a c c o C o n t r o l P a p e r N o . 13
About this series...
This series is produced by the Health, Nutrition, and Population Family (HNP) of the World Bank’s Human Development Network. The papers in this series aim to provide a vehicle for publishing preliminary and unpolished results on HNP topics to encourage discussion and debate. The findings, interpretations, and conclusions expressed in this paper are entirely those of the author(s) and should not be attributed in any manner to the World Bank, to its affiliated organizations or to members of its Board of Executive Directors or the countries they represent. Citation and the use of material presented in this series should take into account this provisional character. For free copies of papers in this series please contact the individual authors whose name appears on the paper.
Enquiries about the series and submissions should be made directly to the Editor in Chief Alexander S. Preker (apreker@worldbank.org) or HNP Advisory Service (healthpop@worldbank.org, tel 202 473-2256, fax 202 522-3234). For more information, see also www.worldbank.org/hnppublications.
The Economics of Tobacco Control sub-series is produced jointly with the Tobacco Free Initiative of the World Health Organization. The findings, interpretations and conclusions expressed in this paper are entirely those of the authors and should not be attributed in any manner to the World Health Organization or to the World Bank, their affiliated organizations or members of their Executive Boards or the countries they represent.
The editors for the Economics of Tobacco Control papers are: Joy de Beyer (jdebeyer@worldbank.org), Emmanuel Guindon (guindone@who.int) and Ayda Yurekli (ayurekli@worldbank.org).
THE WORLD BANK
1818 H Street, NW
Washington, DC USA 20433 Telephone: 202 477 1234 Facsimile: 202 477 6391 Internet: www.worldbank.org
E-mail: feedback@worldbank.org Tobacco Free Initiative
World Health Organization
WORLD HEALTH ORGANIZATION
Regional Office for South-East Asia World Health House, Indraprastha Estate Mahatma Gandhi Marg New Delhi 110002, India Telephone: 233 70804; 233 0809-11 Facsimile: 23370197, 2337 9395 E-mail:registry@whosea.org
A Study on the Economics of Tobacco in Nepal
Yagya B. Karki, Kiran Dev Pant and Badri Raj Pande
October 2003
Public Disclosure AuthorizedPublic Disclosure AuthorizedPublic Disclosure AuthorizedPublic Disclosure Authorized
28887
A STUDY ON THE ECONOMICS OF TOBACCO IN NEPAL
YAGYA B. KARKI, KIRAN DEV PANT AND BADRI RAJ PANDE
October 2003
Health, Nutrition and Population (HNP) Discussion Paper
This series is produced by the Health, Nutrition, and Population Family (HNP) of the World Bank’s Human Development Network ( HNP Discussion Paper). The papers in this series aim to provide a vehicle for publishing preliminary and unpolished results on HNP topics to encourage discussion and debate. The findings, interpretations and conclusions expressed in this paper are entirely those of the authors and should not be attributed in any manner to the World Bank, to its affiliated organizations or to members of its board of executive directors or the countries they represent. Citation and the use of material presented in this series should take into account this provisional character. For free copies of papers in this series please contact the individual authors whose names appear on the paper.
Enquiries about the series and submissions should be made directly to the editor- in-chief. Submissions should have been previously reviewed and cleared by the sponsoring department that will bear the cost of publication. No additional reviews will be undertaken after submission. The sponsoring department and authors bear full responsibility for the quality of the technical contents and presentation of material in the series.
Since the material will be published as presented, authors should submit an electronic copy in a predefined format (available at www.worldbank.org/hnppublications on the guide for authors page) as well as three camera-ready hard copies (copied front to back exactly as the authors would like the final publication to appear). Rough drafts that do not meet minimum presentational standards may be returned to authors for more work before being accepted.
The editor-in-chief of the series is Alexander S. Preker (apreker@worldbank.org); For information regarding this and other World Bank publications, please contact the HNP Advisory Services (healthpop@worldbank.org) at +1 202 473 2256 (telephone) or +1 202 522 3234 (fax).
__________________________________________________________________________
The Economics of Tobacco Control sub-series is produced jointly with the Tobacco Free Initiative of the World Health Organization. The findings, interpretations, and conclusions expressed in this paper are entirely those of the authors and should not be attributed in any manner to the World Health Organization or to the World Bank, their affiliated organizations or to members of their executive boards or the
countries they represent.
The editors of the Economics of Tobacco Control papers are Joy de Beyer (jdebeyer@worldbank.org), Emmanuel Guindon (guindone@who.int) and Ayda Yürekli (ayurekli@worldbank.org).
For free copies of papers in this series please contact the individual authors whose names appear on the paper or one of the editors. Papers are posted on the publications pages of these websites:
www.worldbank.org/hnp and www.worldbank.org/tobacco ISBN 1- 932126- 56-2
© 2003 The International Bank for Reconstruction and Development/The World Bank 1818 H Street, NW
Washington DC 20433 All rights reserved.
Health, Nutrition and Population (HNP) Discussion Paper ECONOMICS OF TOBACCO CONTROL PAPER NO. 13
A Study on the Economics of Tobacco in Nepal Yagya B. Karki
a, Kiran Dev Pant
band Badri Raj Pande
ca
Principal Investigator, Nepal Health Economics Association, Kathmandu, Nepal
b
Research Officer, Nepal Health Economics Association, Kathmandu, Nepal
c
Research coordinator, President, Nepal Health Economics Association, Kathmandu, Nepal
Paper prepared for the World Health Organization’s Regional Office for South- East Asia. Presented at a meeting on the Economics of Tobacco Control in the South- East Asia Region, in Jakarta, Indonesia,
December 3- 4, 2003.
Abstract: This study is based both on secondary and primary data. The primary data were collected using a smoking behaviour survey and a purposive sample survey among tobacco- cultivating farmers. The overall smoking prevalence in Nepal for the population aged 15 or more is estimated at 37.4%, and is higher (47.4%) among males than among females (27.6%). Poor people are more likely to consume tobacco than their better-off counterparts, resulting in
increased health hazards and the diversion of scarce income. The tobacco industry is a lucrative business for the private sector and government; the private sector makes large profits, and the tax revenue is substantial. Economic analysis estimated the price elasticity of demand for cigarettes and bidi at –0.882. It is found also that the poor and the young are the groups most sensitive to price changes. Therefore, considering health and economic benefits and poverty alleviation goals, a policy of real price increase through taxation of all types of tobacco product would be a
desirable public policy for the government of Nepal to consider.
Keywords: Nepal, tobacco, tobacco revenue, cigarette, bidi, poor, tobacco tax, price, price elasticity, policy.
Disclaimer: The findings, interpretations and conclusions expressed in the paper are entirely those of the authors, and do not represent the vie ws of the World Bank or the World Health Organization, their executive directors or the countries they represent.
Correspondence details: Yagya B. Karki, Nepal Health Economics Association, Kathmandu, Nepal. GPO Box 3108, Kathmandu, Nepal, telephone +977 1 552 4290; e- mail:
chandimai@wlink.com.np ; fax +977 1 437 3054.
ABBREVIATIONS AND ACRONYMS
CBS Central Bureau of Statistics
COPD Chronic obstructive pulmonary disease CPI Consumer price index
DALY Disability-adjusted life year
FY Fiscal year
GDP Gross domestic product GNP Gross national product
HIV/AIDS Human immunodeficiency virus/acquired immune deficiency syndrome IHD Ischaemic heart disease
IMR Infant mortality rate
INGO International nongovernmental organization MOF Ministry of Finance
MOH Ministry of Health
MOPE Ministry of Population and Environment NPC National Planning Commission
NGO Nongovernmental organization
NHEICC National Health Education, Information and Communication Centre NLSS Nepal Living Standard Survey
NRB Nepal Rastra Bank (Central Bank of Nepal) PAR Population-attributable risk
RR Relative risk
STP Smokeless tobacco product VDC Village development committee
WB World Bank
WHO World Health Organization
WHO/SEARO World Health Organization Regional Office for South-East Asia
TABLE OF CONTENTS
ABBREVIATIONS AND ACRONYMS ... V NOTE FROM REGIONAL DIRECTOR, OFFICE FOR SOUTH-EAST ASIA, WORLD
HEALTH ORGANIZATION ...XI FOREWORD ... XIII ACKNOWLEDGEMEN TS ... XV SUMMARY ...XVII
1. GENERAL SITUATION OF THE COUNTRY ...1
1.1. Country background ...1
1.2. Demographic characteristics ...1
1.3. Health system ...3
1.4. Literacy...4
1.5. Economic indicators ...5
2. THE TOBACCO INDUSTRY IN NEPAL ...10
2.1. Tobacco industry statistics ...10
2.2. Production, trade and consumption of manufactured tobacco ...12
2.3. Tobacco agriculture statistics...15
2.4. Tobacco household economics: the tobacco cultivation survey...17
2.5. Tobacco advertising and promotion by tobacco companies ...23
3. PREVALENCE AND CONSUMPTION...24
3.1. Prevalence of tobacco use ...24
3.2. Consumption of tobacco products...30
4. PRICES, TAXES, AND THE DEMAND FOR TOBACCO PRODUCTS ...33
4.1. Prices, taxes and government revenues ...33
4.2. Smuggling of tobacco products...38
4.3. The demand for tobacco products in Nepal...38
4.4. Simulation analysis: tobacco taxes as a revenue-generating tool...47
5. HEALTH AND TOBACCO CONTROL...48
5.1. Health consequences of tobacco use ...48
5.2. Tobacco control measures ...50
6. POLICY RECOMMENDATIONS ...51
APPENDICES ...57
Appendix 1. Health service infrastructure by year ...58
Appendix 2. Cigarette production 1984–85 to 1998–99 ...59
Appendix 3. Sampling design for Nepal smoking behaviour survey, 2000 ...60
Appendix 4. Nepal smoking behaviour survey questionnaire, 2000 ...63
Appendix 5. Nepal tobacco cultivation survey questionnaire, 2000 ...71
Appendix 6. Ho usehold expenditure ...76
Appendix 7. Hausman test...77
Appendix 8. Proportion of smokers...78
Appendix 9. Relative risks for major diseases in China...79
REFERENCES ...81
TABLES
Table 1.1. Population size and growth rates, Nepal, 1911–2001...2
Table 1.2. Percentage distribution of population by age, sex and residence, 2001...2
Table 1.3. Trend of infant mortality rate and life expectancy in the past 50 years...3
Table 1.4. Causes of death in Nepal...4
Table 1.5. Literacy (aged 10+), Nepal, 1952–54 to 1996 ...5
Table 1.6. GDP and population growth rates, Nepal, 1964–65 to 1998–99 ...6
Table 1.7. National urban consumer price index. Base year 1983–84 = 100...7
Table 1.8. Percentage distribution of the employed population (aged 10+) by major employment sector for rural and urban areas, Nepal, 1991...8
Table 1.9. Percentage distribution of the employed population (aged 10+) by major employment sector and sex, Nepal, 1971– 91 ...8
Table 1.10. Labour force by sector, Nepal, 1998/99...9
Table 1.11. Occupational classification of the economically active population 10 years and over, Nepal, 1984/85 and 1995/96...9
Table 2.1. Industrial (manufacturing) establishments in Nepal, 1996/97 ...10
Table 2.2. Employment in the tobacco-producing and retail sector, 2000, Nepal...11
Table 2.3. Tobacco employees by skill category...11
Table 2.4. Selected industrial statistics, manufactured tobacco, Nepal, 1986–1996...12
Table 2.5. Production of cigarettes and bidi, 1986/87 to 1999/2000 (million sticks)...12
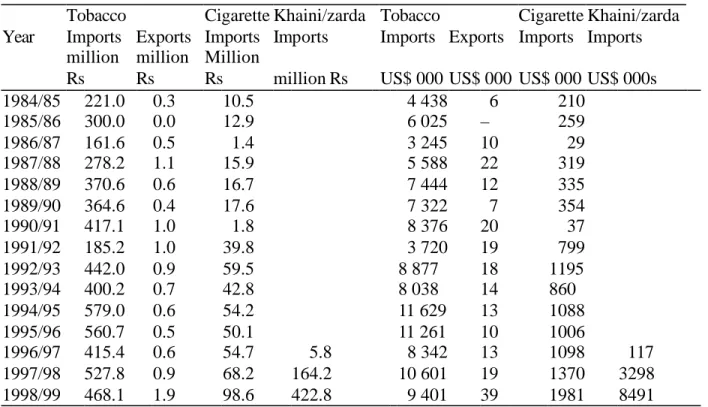
Table 2.6. Tobacco imports and exports, 1984/85 to 1998/99, real 1995/96 Rs and US$ ...13
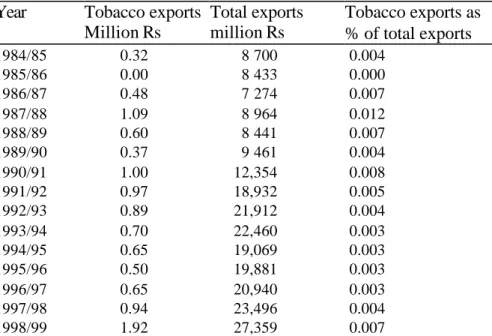
Table 2.7. Tobacco exports and total exports, 1984/85 to 1998/99 (1995/96 million Rs) ...14
Table 2.8. Tobacco imports and total imports, Nepal, 1984/85 to 1998/99 (1995/96 million Rs) ...14
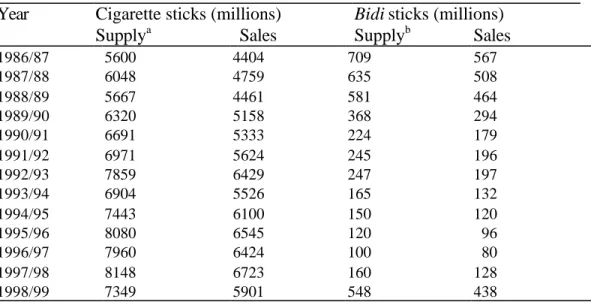
Table 2.9. Supply and sales of cigarettes and bidi, 1984/85 to 1998/99, Nepal ...15
Table 2.10. Crop area (000 hectares) by crop type, Nepal, 1981/82 and 1991/92 ...16
Table 2.11. Tobacco production and yield, Nepal, 1984/85 to 1999/2001 ...16
Table 2.12. Household income sources by ecological region and residence, Nepal, 2000 (Rs)...18
Table 2.13. Nominal household and per capita income by geographical group (annual income in 2000 rupees)...18
Table 2.14. Nominal per capita income by quintile (rupees)...19
Table 2.15. Distribution of the population by nominal per capita income by quintile and geographical group, Nepal, 2000...19
Table 2.16. Household income sources by quintile income group, Nepal, 2000 (Rs)...19
Table 2.17. Tobacco farmers’ household income sources for four districts, Nepal, 2000 (Rs)...20
Table 2.18. Nominal annual per capita income of tobacco farmers, quintiles (2000 rupees) ...20
Table 2.19. Household income sources, tobacco farmers by quintile, Nepal, 2000 (Rs)...21
Table 2.20. Household expenditure of tobacco farmers in four districts, Nepal, 2000 ...22
Table 2.21. Household expenditures of tobacco farmers by income quintile, Nepal, 2000 ...22
Table 3.1. Unstandardized and standardized smoking prevalence rates by age, sex and residence, Nepal, 1980s and 2000...25
Table 3.2. Prevalence of daily smoking among youths aged 8–19 in a rural hill area in 1983– 84 and among youths aged 10–19 in rural hills and Tarai in 2000, Nepal...26
Table 3.3. Unstandardized and standardized smoking prevalence rates by age, sex and region, Nepal, 1980s and 2000...27
Table 3.4. Smoking prevalence of population aged 10 years and over, by gender, region and literacy, 2000 ...27
Table 3.5. Number of cigarettes/bidi smoked during most recent pregnancy by literacy, Nepal, 1997 ...28
Table 3.6. Smoking prevalence (%),males and females 10 years and older by 5-year age group, Nepal, 2000 ...29
Table 3.7. Mean age at first smoking by region and sex, Nepal, 2000...30
Table 3.8. Consumption of tobacco products and money spent on them by region and sex, Nepal, 2000 ...31
Table 3.9. Cigarette and bidi smoking rates (%) for population 15 years of age and over and estimates of per capita consumption of cigarettes and bidi, Nepal, 2000 ...31
Table 4.1. Nominal cigarette prices, Nepal, 1991–2000 (Rs per pack of 20) ...34
Table 4.2. Specific excise per 1000 sticks in Nepal, 1997/98 to 2002/03 (Rs)...35
Table 4.3. Tax incidence of selected tobacco products, Nepal, selected years ...36
Table 4.4. Revenue from tobacco products, Nepal, 1984/85 to 1998/99 (real 1995/96 million Rs)...37
Table 4.5. Total government revenue and total tobacco products revenue, Nepal, 1984/85 to 1998/99 (1995/96 million Rs)...37
Table 4.6. Household expenditure groups by region and residence, Nepal, 2000 (Rs)...40
Table 4.7. Household expenditure by income group, all households, Nepal, 2000 ...41
Table 4.8. Tobacco-using households’ expenditure on tobacco products*...41
Table 4.9. Price elasticity for the overall population and by age groups ...44
Table 4.10. Price elasticity by income quintile ...45
Table 4.11. Price elasticity by geographical location ...45
Table 4.12. Income elasticity for the overall population and by age group...46
Table 4.13. Income elasticity by income quintile ...46
Table 4.14. Income elasticity by geographical location...47
Table 4.15. Potential revenue from tobacco taxes ...48
Table 7.1. Sample selection ...62
Table 7.2. Hausman test...77
Table 7.3. Proportion of smokers ...78
Table 7.4. Relative risks for major diseases in China (men aged 35 and above) ...79
Table 7.1. Relative risks for major diseases in China (women aged 35 and above)...79
FIGURES
) LJ XUH6 P RNLQJ SUHYDOHQFHDP RQJ SRSXODWLRQE\ UHJ LRQDQGVH[ 1 HSDO ...25) LJ XUH6 P RNLQJ SUHYDOHQFHHGXFDWLRQDP RQJ DGXOWVRI DQGROGHU1 HSDO ...28
) LJ XUH6 P RNLQJ SUHYDOHQFHIRUP DOHVDQGIHP DOHVE\ -year age groups, Nepal, 2000...29
) LJ XUH&LJ DUHWWHUHDOSULFHVDQGFRVWOLQHVV1 HSDO –73 to 2000– 01 ...33
) LJ XUH5 HDOFLJ DUHWWHSULFHV5 VDQGSHUFDSLWDFLJ DUHWWHFRQVXP SWLRQ ...39
NOTE FROM REGIONAL DIRECTOR, OFFICE FOR SOUTH-EAST ASIA, WORLD HEALTH ORGANIZATION
The trend in tobacco consumption in many developing countries is worrying. This is not only because of the millions of deaths and related suffering that it involves, but also due to its negative impact on economic development. Experiences from many countries have shown that cost effective tobacco control measures can be taken that could bring net economic gains for the country. Proven, cost-effective measures include: public education and information; a ban on tobacco advertising; tobacco smuggling deterrence and increased tobacco taxes. All these measures can be incorporated in national anti- tobacco legislation. Studies and research from countries around the world have revealed that an increase in tax on tobacco products is perhaps the most effective tool for tobacco control, and is especially effective in reducing tobacco use among young people and people with low incomes. Higher tobacco taxes can help a country in a number of ways – by generating additional revenue, reducing tobacco use leading to less tobacco-related morbidity and mortality and reduced expenditure on treatment of tobacco- related diseases.
Effective collaboration between health and finance ministries is essential to address
appropriately the economic and fiscal aspects of tobacco control. Such collaboration could ensure improved health for millions of people by protecting them and their families from the harmful effects of tobacco use.
I am confident that the findings of the study initiated by World Health Organization and World Bank will encourage the policy makers, in particular, in the health and finance ministries, to take appropriate and coordinated action for tobacco control.
10 October, 2003
Dr Uton Muchtar Rafei
Regional Director
World Health Organization
Office for South East Asia
FOREWORD
In 1999, the World Bank published Curbing the epidemic: governments and the economics of tobacco control, which summarizes the trends in global tobacco use and the resulting immense and growing burden of disease and premature death. By 1999, there were already 4 million deaths from tobacco each year. This number is projected to grow to 10 million per year by 2030, given present trends in tobacco consumption. Already about half of these deaths are in high- income countries, but recent and continued increases in tobacco use in the developing world is causing the tobacco-related burden to shift increasingly to low- and middle- income countries. By 2030, seven of every ten tobacco-attributable deaths will be in developing
countries. Curbing the epidemic also summarizes the evidence on the policies and interventions that have proved to be effective and cost-effective in reducing tobacco use in countries around the world.
Raising taxes to increase the price of tobacco products is the most effective way to reduce tobacco use, and the single most cost-effective intervention. It is also the most effective way to persuade young people to quit or not take up smoking. This is because young people, like others with low incomes, tend to be highly sensitive to price increases.
Why are these proven cost-effective tobacco control measures not adopted or implemented more strongly by governme nts? Many governments hesitate to act decisively to reduce tobacco use because they fear that tax increases and other tobacco control measures might harm the economy by reducing the economic benefits their country gains from growing, processing, manufacturing, exporting and taxing tobacco. The argument that tobacco contributes revenues, jobs and incomes is a formidable barrier to tobacco control in many countries. Are these fears supported by the facts?
In reality, these fears turn out to be largely unfo unded when the data and evidence on the economics of tobacco and tobacco control are examined. A team of about 30 internationally recognized experts in economics, epidemiology and other relevant disciplines who contributed to the analysis presented in Curbing the epidemic reviewed a large body of evidence. The team concluded that in most countries tobacco control would not lead to a net loss of jobs and could, in many circumstances, actually generate new jobs. Tax increases would increase (not decrease) total tax revenues, even if cigarette smuggling increased to some extent. Furthermore, the evidence shows that cigarette smuggling is caused at least as much by general corruption as by high tobacco product tax and price differentials. The team recommended that governments not forego the benefits of tobacco tax increases because they feared the possible effect on
smuggling. Rather, they should act to deter, detect and punish smuggling.
Much of the evidence presented and summarized in Curbing the epidemic was from high- income countries. However, the main battleground against tobacco use is now in low- and middle- income countries. If needless disease and millions of premature deaths are to be prevented, then it is crucial that developing counties raise tobacco taxes, introduce
comprehensive bans on advertising and promotion of tobacco products, ban smoking in public
places, inform their citizens about the harm that tobacco causes and the benefits of quitting, and provide advice and support to help people quit.
In talking to policy- makers in developing countries, it became clear there was a great need for country-specific analytic work to provide a basis for policy making within a sound economic framework. The World Bank and WHO’s Tobacco Free Initiative (as well as several other organizations, acting in partnership or independently) began to commission and support analysis of the economics of tobacco and tobacco control in many countries around the world.
The report presented in this paper makes a valuable contribution to our understanding of the issues and likely economic impact of tobacco control. Our hope is that the information, analysis and recommendations contained herein will prove helpful to policy- makers and result in
stronger policies to reduce the unnecessary harm caused by tobacco use.
Joy de Beyer
Tobacco Control Coordinator
Health, Nutrition and Population
World Bank
ACKNOWLEDGEMENTS
The authors would like to express their indebtedness to the World Health Organization’s Regional Office for South- East Asia and to the government in Nepal for facilitating this study.
Thanks are due to Jin Shuigao, WHO consultant, for providing assistance in the early stage of the study. The authors would like to thank the officials of the Nepalese Department of Health Services, particularly LR Ban, Director of the National Health Education, Information and Communication Centre, and his officials, the Departments of Industries and Commerce and other government institutions, and Nepal Rastra Bank for their assistance. We would also like to record our appreciation for the input provided by MR Pandey and Gaja Nand Agrawal,
Department of Economics, Tribhuvan University, Kathmandu. The authors are grateful to Anne- Marie Perucic and Emmanuel Guindon of the World Health Organization, Geneva, for their assistance and advice in econometric analyses.
The authors are also grateful to the World Bank publishing the report as an HNP discussion
paper.
SUMMARY Demographic and health situation
Nepal’s population of 23.1 million (2001) is growing at an annual rate of 2.27%, given high fertility and fast-declining mortality. About 40% of the population is aged between 0 and 14.
Life expectancy in 2000 was 60 years. Almost 90% of the population lives in rural areas.
Literacy rates in 2001 were 67% for men and 41% for women. The main causes of death were infectious, maternal and perinatal, at just under 50%; non-communicable and congenital conditions accounted for about 40% of deaths.
Tobacco production and trade
In 1996/97 there were four cigarette manufacturers in Nepal—three private, one public—plus an agent for foreign cigarettes. There was also a handful of small and poorly organized manufacturers of other tobacco products, mainly bidi (sticks made from inferior tobacco wrapped loosely in leaf); their numbers are declining. Cigarette production is increasing.
Tobacco and tobacco product imports are increasing, although they represent only 1% of Nepal’s total import value. Most imported tobacco comes from India. Nepal’s tobacco farming and exports are negligible.
Smuggling of tobacco products, especially smokeless products, into Nepal is believed to be common. The country has long porous borders, and such border controls as exist are beset by local corruption. The introduction of a value-added tax in 1997 is thought to have exacerbated matters, but there are no data to verify this.
Smoking behaviour and tobacco consumption survey
A purposive survey of 1,438 households (nearly 6,000 people) carried out for this study in November-December 2000 collected information on household incomes, smoking behaviours and tobacco cultivation.
The survey found that annual per capita income was US$ 175, 25% lower than the official per capita GDP of $230 (World Bank, 2003). Urban households earned more than rural household s.
Farm-related earnings accounted for 40% of income, and non- farm income comprised 47%.
Income from tobacco-related activities was negligible-- less than 1% of all income. The wealthiest 20% of households accrued 56% of total income, a shift in distributio n towards the wealthy since 1996. Income distribution appears to be more equitable in the mountain region.
The survey found a smoking prevalence of 48% among men aged 15 and older, and 29% among adult women, much lower among men than found in previous sur veys. Prevalence is
considerably higher in rural areas, and among men. Other studies note that smoking rates are
among the highest in the world. Smoking prevalence tends to increase with age; indeed, the
survey found a decline in smoking prevalence among the young in recent years. Smoking is
inversely related to education level and literacy.
Annual average consumption among those 10 and over was just over 2000 sticks. Except in the mountain region, females are slightly heavier smokers than males. Smokers spent about US$ 30 a year on cigarettes and bidi – a remarkably high 17% of income. Men tended to spend more on cigarettes and to buy more expensive brands than women. Traditional forms of tobacco
consumption seem to be decreasing as cheap cigarettes become more widely and cheaply available; cigarette smoking has a certain social cachet.
Prices, taxes and demand
Cigarette real prices have fallen by about one-third since 1970. With rising incomes, this has made cigarettes about 60% more affordable in 2000 than at the beginning of the 1970s. Price trends were not available for other tobacco products, but bidi and smokeless (chewed) tobacco products tend to be more affordable than cigarettes.
Three types of tax on manufactured cigarettes are levied in Nepal: an excise tax, a health (smoking) tax and a 10% value-added tax. The most important is the excise tax, levied
according to the type and length of the cigarette. In 2002/03, the total tax incidence ranged from 25% on highly priced international brands to just over 50% on popular domestic brands. This is quite low in comparison to international tobacco tax incidence levels, which often reach 75% to 85% and well below the World Bank recommendation that the tax component of the price of a pack of cigarettes be between two-thirds and four-fifths of the total retail cost. Moreover, since the taxes are specific—that is, fixed amounts per 1,000 cigarettes, inflation continually erodes their value. The small health tax, used for cancer control, has not changed since 1994–95, although the real value of the currency has fallen by more than 90%.
Tobacco tax revenue has stayed fairly stable since 1985 at about US$ 50 million (in real terms).
As the tax base has grown and diversified, tobacco tax revenue has fallen as a percentage of total tax revenue and total government revenue, although it still accounts for about 11% and 9%
respectively.
About two-thirds of household expenditure went on food, energy and clothing, with education and health accounting for about 20%. Expenditure on tobacco products was 3.5% of total expenditure for all households, and 7% among tobacco-using households. As might be expected, poorer and rural households spent a greater proportion of their (lower) incomes on tobacco products.
Price and income elasticities were estimated for the population as a whole and for age and income groups. The total price elasticity for the whole population was found to be –0.88 and significant, which means that a price increase of 10% would result in an 8.8% fall in
consumption. Separate estimates of the elasticity of smoking participation and the conditional
elasticity of demand show that decisions to smoke or not, and changes in the amount smoked,
are about equally affected by changes in the price of tobacco. The empirical analysis found that
younger people would be more sensitive to price changes than older people, possibly because
they have less disposable income and/or are less likely to be addicted. As expected, poorer
households were found more sensitive to price changes than wealthier ones. Urban smokers are
more sensitive to price change than rural ones, reflecting higher urban cigarette prices.
Income elasticity was found to be usually positive but small, implying that each 10% increase in income would lead to a 1.8% increase in tobacco consumption.
In addition to the health benefits they create by reducing tobacco use, tax increases also generate additional government revenue. This is contrary to the misconception that lower consumption necessarily means lower tax revenue.
In order to show the revenue-generating potential of tobacco taxes in Nepal, the paper simulated the effect of a 5% annual increase in real prices compared to a baseline scenario of constant real prices. The household analysis price and income elasticity estimates of –0.88 and 0.18 were used. It was assumed that the entire 5% real price increase would be driven by higher tax rates and that real GDP per capita in the region would grow at an annual rate of 4%. (This is a fairly conservative estimate in light of the latest detailed projections published by the
International Monetary Fund.) Government revenues from tobacco taxes were simulated to 2010 from a 1998 baseline. All other factors that might influence the consumption of tobacco products were assumed to remain the same. The simulation showed that Nepal could generate an additional Rs 22,808 million (US$ 368 million) between 2000 and 2010 by steady 5%
annual real increases in tobacco prices, using higher tax rates to raise prices.
Health and tobacco control
People in Nepal, particularly in rural areas, are largely unaware of the health risks of tobacco.
Consumption of tobacco is a social habit; for some it is also a status symbol.
Recent data on smoking-related diseases in Nepal are scant. There were 60,000 cancer patients reported in Nepal in 1997. A 1988 study showed a high prevalence of chronic bronchitis (33.9%
among men and 28.3% among women) and chronic obstructive lung disease. Prevalence of tobacco use combined with the use of unventilated indoor fires for cooking and heating produce high rates of lung disease in Nepal.
Costs due to tobacco consumption include costs for treatment of tobacco-attributable illness and opportunity costs of income foregone through disability and premature death. The lack of data made it impossible to determine morbidity and mortality rates and costs incurred due to tobacco consumption, but they are likely to be high.
The Ministry of Health is actively engaged in controlling tobacco use in Nepal. The Ministry’s
National Health Education, Information and Communication Centre is primarily responsible for
carrying out health education and communication programs against smoking. Anti-smoking
communication campaigns use many media—radio, print, hoarding boards, television and video
and workshops across the country. In 1993/94, the Ministry introduced a levy on each cigarette
to be allocated for health care, although its real valued has been hugely eroded by inflation. All
tobacco products must carry health warnings, and advertising of tobacco in public places or
through electronic media is banned. However, other media channels are extensively used, the
national daily newspapers and magazines are full of cigarette advertisements, and the warning
on cigarette packages is too small. A bill before parliament calls for a complete ban on tobacco
use in public places and on the sale of tobacco to minors. It also proposes tighter regulation of
advertising. The bill is expected to become law, despite resistance from the tobacco industry.
Policy recommendations
The high prevalence of tobacco use in Nepal needs to be reduced to avert a growing burden of disease. The government’s attempts at using mass communication to modify behaviour have been hampered by Nepal’s linguistic diversity, and tobacco use is just one of the many health challenges competing for priority.
The paper suggests that each 10% increase in price would decrease consumption of cigarettes and bidi by nearly 9%. Tax increases would increase government revenues. The poor are highly sensitive to price change, falls in tobacco use enable them to use money now spent on tobacco for other uses. The paper recommends that taxes on non-cigarette tobacco products, which are disproportionately less taxed, be increased, and tax increases be used to increase prices of all tobacco products each year by at least 5% above the rate of inflation. The paper further recommends that the health tax be increased to make up for the inflation of the past 10 years and be increased in line with inflation in future.
As the degree of smuggling in a country is linked to a country’s overall corruption, the government should take steps to reduce corruption. Tighter import controls should be introduced at border posts.
Despite the government’s anti-smoking measures, tobacco companies are investing heavily in tobacco promotion. The tobacco control bill before parliament should be enacted without delay.
The goal should be a complete and comprehensive ban on all tobacco product advertising and promotion, direct and indirect.
The paper notes the lack of available information on the tobacco industry and tobacco use and the difficulty in collecting it. A reliable system of data collection and record-keeping is needed for cigarettes and other tobacco products. This would improve revenue collection and deter corruption.
Primary and secondary data on the health risks and medical costs of tobacco use are not available. A detailed study would be needed to address these gaps. Information would be needed on cigarette smoking and other tobacco products, and related causes of death and morbidity broken down by region, residence, sex and age, treatment costs, both direct and indirect, for major tobacco-attributable illnesses.
Tobacco control measures should be integrated into other public health initiatives in Nepal, and their priority increased. As literacy and smoking prevalence are inversely correlated, a drive to increase literacy rates might also help to decrease smoking.
Tobacco production and use and tobacco-related health issues touch many different spheres of government, including health, finance, industry and labour, and nongovernmental organizations.
A Tobacco Free Initiative unit or task force should be set up to coordinate tobacco-control
activities. Tobacco tax revenues, in spite of leakage and smuggling, contributes about 9% of all
government revenues, the Ministry of Finance should have a strong interest in raising tax rates
regularly, and introducing tighter controls. This will also help control smuggling.
1. GENERAL SITUATION OF THE COUNTRY
1.1. Country background
Nepal is a landlocked country. India surrounds her on the east, south and west, and to the north is the Tibetan region of China. The total land area of the country is 147,181 km
2. The country is divided into five development regions, which are further subdivided into 14 zones and 75 districts. In addition, the country is characterized by three distinct geographic areas running east to west, referred to as the Mountains, the Hills and the Tarai.
The mountain areas range in altitude from 4880 metres to 8848 metres above sea level and include such mountains as Everest, Kanchanjunga, Makalu, Dhaulagiri and Annapurna. The area accounts for almost 35% of the total land area of the country and according to the 1991 census about 8% of the country’s 18.5 million population lives in this area.
The hill areas range in altitude from above 305 metres to 4880 metres. The Hills account for 44%
of the total land of the country and about 45% of the total population.
The Tarai areas range from about 60 metres to 305 metres above sea level and include some of the most fertile land in the country. Slightly over one-fifth of the total land area and about 47% of the total population are located in the Ta rai.
Population density, which reached 126 per km
2nationally in 1991, is rather unevenly distributed through these areas. The Tarai has the highest density at 254 persons per km
2, followed by the Hills at 137 and the Mountains at only 28 persons per km
2.
1.2. Demographic characteristics
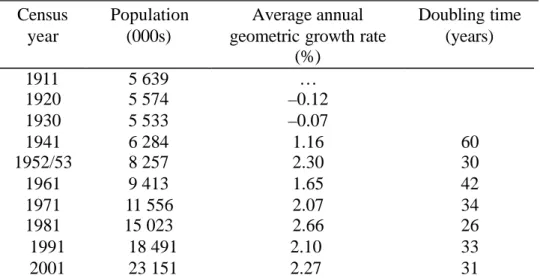
Nepal’s fertility is high and mortality is declining fast, resulting in a high rate of population growth. It took 60 years for the 1911 census population of 5.6 million to double to 11.6 million in 1971. The 1991 census yielded a total population of 18.5 million, an average annual growth rate of 2.1% for 1981–1991. The 2001 census showed Nepal’s population reaching 23.1 million—an average annual growth rate of 2.27%. If this trend continues, Nepal’s population will again doub le by 2032 (Table 1.1).
Demographically, Nepal’s population is very young. The proportion of the 0–14 age group in total population has remained at 40% or more since 1961 -- the proportions of 0–14 population were 40.0%, 40.5%, 41.4%, and 42.4% in 1961, 1971, 1981 and 1991 respectively (Karki, 1993).
Table 1.2 shows slightly lower proportion of young age population in urban areas (37.3%)
compared to the rural areas (42.9%) of Nepal. According to the most recent population census of
2001 (Central Bureau of Statistics and UNFPA, 2002) the age structure still remains quite young
as the population 0–14 is reported to be as high as 39.3% (Table 1.2).
Table 1.1. Population size and growth rates, Nepal, 1911–2001 ____________________________________________________________
Census year
Population (000s)
Average annual geometric growth rate
(%)
Doubling time (years)
1911 5 639 …
1920 5 574 –0.12
1930 5 533 –0.07
1941 6 284 1.16 60
1952/53 8 257 2.30 30
1961 9 413 1.65 42
1971 11 556 2.07 34
1981 15 023 2.66 26
1991 18 491 2.10 33
2001 23 151 2.27 31
Source: Central Bureau of Statistics, 1958: Population census 1952–54, Table 2; Central Bureau of Statistics, 1968:
Population census 1961, Vol. 3, Part 2, Table 2; Central Bureau of Statistics, 1975: Population census 1971, Vol. 1, Table 5; Central Bureau of Statistics, 1984, Population census 1981, Vol. 2, Table 4; Central Bureau of Statistics, 1993, Population census 1991, Vol. 1, Table 5; and Central Bureau of Statistics and UNFPA, 2002, Population census 2001: National Report.
Table 1.2. Percentage distribution of population by age, sex and residence, 2001 _____________________________________________________________________________
Urban (%) Rural (%) Total (%)
Age
(years) Male Female Total Male Female Total Male Female Total
<5 9.4 9.6 9.5 12.8 12.3 12.6 12.3 11.9 12.1
5–14 23.6 23.5 23.6 28.6 27.1 27.8 27.9 26.6 27.2
15–29 31.6 32.2 31.9 25.0 27.2 26.1 26.0 27.9 27.0
30–49 24.1 23.2 23.7 20.5 21.0 20.7 21.0 21.3 21.2
50+ 11.2 11.5 11.4 13.1 12.3 12.7 12.8 12.2 12.5
Total population
(millions)
1.7 1.6 3.3 19.9 10.0 19.9 11.6 11.6 23.2
Source: Central Bureau of Statistics and UNFPA, 2002, Population census 2001: National Report.
About 86% of the total population of Nepal reside in rural areas. In 1971 more than half of the total urban population lived in the three cities of the Kathmandu valley, but by 2001 this proportion had declined to about 30.9%. Now 45.5% of the total urban population live in the Tarai areas. According to the 1991 census, the urban population was 9.2% (see Table 1.2), but by the end of 1997 this had changed to 12.7% because of the reclassification of some rural areas as urban centres
1(Bastola, July 2000), and by 2001 the urban proportion was 14.2% (see Table 1.2).
1 In 1991 there were 33 municipalities but at the beginning of 1992 an additional three areas were designated as urban areas.
Further, at the beginning of 1997, 15 more areas were designated as urban and at the end of 1997 another seven areas were designated as urban areas.
1.3. Health system
Health care delivery system
The Ministry of Health (MOH) is the main body providing health services to the Nepalese people. As of fiscal year 1999/2000 there were 4,421 government health institutions, comprising 83 hospitals, 13 health centres, 705 health posts, 275 ayurvedic health facilities, 3,185 sub-health posts and 160 primary health care centres. (Ministry of Finance, May–June 2000). There were 78,203 people engaged in providing health services to the people of Nepal through various types of health facility. In Appendix 1, health services data since 1981–82 are presented (health
statistics from fiscal year 1994–95 onwards are only for the government sector).
Besides government facilities, there are many private and nongovernmental organizations, national and international, that provide health services to people in different parts of the country.
Many of these organizations specialize in specific health areas.
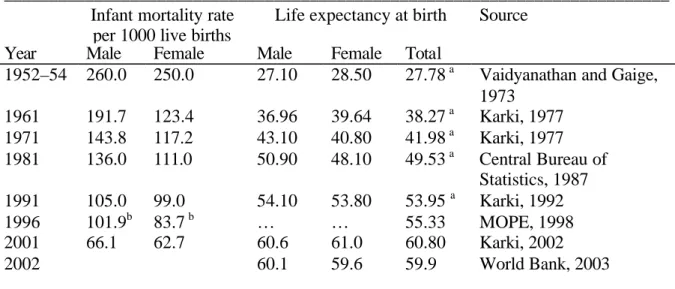
During the last half of the 20th century, Nepal has made tremendous improvements in mortality, which is evident from Table 1.3. The infant mortality rate and life expectancy at birth have improved—infant mortality has gone down by more than half, and life expectancy has nearly doubled. Nevertheless, these indicators are still not very good by world standards. Among the south Asian countries, life expectancy in Nepal in 2002 was lower than all other countries:
Bangladesh—male 62 years and females 63 years; India—male 62 years and females 64 years;
Pakistan—male 63 years and female 65 years; and considerably lower than Sri Lanka—male 72 years and female 76 years (World Bank, 2003).
Table 1.3. Trend of infant mortality rate and life expectancy in the past 50 years __________________________________________________________________________
Infant mortality rate per 1000 live births
Life expectancy at birth Source Year Male Female Male Female Total
1952–54 260.0 250.0 27.10 28.50 27.78
aVaidyanathan and Gaige, 1973
1961 191.7 123.4 36.96 39.64 38.27
aKarki, 1977 1971 143.8 117.2 43.10 40.80 41.98
aKarki, 1977 1981 136.0 111.0 50.90 48.10 49.53
aCentral Bureau of
Statistics, 1987 1991 105.0 99.0 54.10 53.80 53.95
aKarki, 1992
1996 101.9
b83.7
b… … 55.33 MOPE, 1998
2001 2002
66.1 62.7 60.6
60.1
61.0 59.6
60.80 59.9
Karki, 2002 World Bank, 2003
__________________________________________________________________________
a Life expectancy for both sexes was arrived at by using a sex ratio (male:female) of 105.
b MOH, 1997.
Causes of death
The World Bank
1documented the burden of diseases for Nepal (Table 1.4). The study pointed out that causes of illness and deaths were not systematically collected in government hospitals. The data used were from private hospital records, which were fairly representative of the population.
Half of all deaths were due to infectious and parasitic diseases, and perinatal and reproductive disorders. The highest risk groups are children under five and women of reproductive age.
Although under-fives represent only 16% of the population, they account for 50% of the
disability-adjusted life years lost (DALYs
2). It is also found that until age 44 females were 25%
more likely to die or suffer serious disability than males. In the context of the Nepalese social and cultural value system, which generally favours males, addressing women’s health is a big
challenge.
Striking in Table 1.4 is that well over 40% of all deaths in Nepal were from non-communicable diseases (NCDs) and congenital problems. As the epidemiological and demographic transitions proceed, NCDs tend to weigh ever more heavily in country’s health burden. Tobacco use is a key risk factor for many non-communicable diseases, and also increases the risk of some infectious diseases, notable tuberculosis, bronchitis, and asthma.
Table 1.4. Causes of death in Nepal
Cause of death Male
(%)
Female (%)
Total (%) Group 1. Infectious, maternal, perinatal and
nutritional problems (pneumonia, bacterial diseases, intestinal infections, bronchitis, asthma, abortion complications, tuberculosis, etc.)
48.1 51.3 49.7
Group 2. Non-communicable and congenital problems (digestive disorders, cardiovascular diseases, diseases of the nervous system, etc.)
44.0 40.2 42.1
Group 3. Injuries and accidents 6.8 7.0 6.9
Unclassified 1.0 1.5 1.0
Total (number) 120 539 125 839 246 432
Source: World Bank, June 2000.
1.4. Literacy
Information on literacy (ability to read and write) has been collected in Nepal since the 1950s.
Table 1.5 shows literacy since the 1952–54 census for males and females by residence. The
1 World Bank, June 2000. Although the final report came out in June 2000, the data used for analysis were from the eighth plan period (1992–97).
2 DALY combines potential years of life lost as a result of death at a given age and years of life lived with disability, using appropriate disability weights depending on the severity of illness. One DALY is thus one lost year of healthy life. See Murray CJL, Lopez AD, 1996. The global burden of disease. Summary. WHO, Harvard School of Public Health and World Bank.
Cambridge, Massachusetts, Harvard University Press.
national literacy level for both sexes combined increased from about 5% (9.5% male and 0.7%
female) in 1952–54 to 53.8% (66.5% male and 41.4% female) in 2001 (Central Bureau of Statistics and UNFPA, 2002, Population census 2001: National Report). The literacy level of females remained less than half that of males until 1996.
In Nepal, as elsewhere, urban literacy is much higher (about 65%) than rural literacy (about 36%). The striking feature of Nepalese society is that literacy is persistently low among women even in urban areas.
Table 1.5. Literacy (aged 10+), Nepal, 1952–54 to 1996
Year Urban (%) Rural (%) Total (%) Source
Male Female Total Male Female Total Male Female Total
1952–
54
n.a. n.a. n.a. n.a. n.a. n.a. 9.5 0.7 5.3 1
1961 57.5 19.6 40.0 14.6 1.1 7.7 16.4 1.8 8.9 1
1971 62.4 28.0 47.0 22.9 2.7 12.9 24.7 3.7 14.3 1
1981 62.0 37.2 50.6 32.9 9.8 21.6 34.9 11.5 23.5 1
1991 77.5 52.3 65.5 51.3 19.6 36.2 54.0 22.7 38.1 2
1996* 77.3 50.5 64.2 50.1 22.4 35.8 52.2 24.4 37.8 3
*Rates are for population 6 years and older.
Sources: 1 Sharma, 1989; 2 Central Bureau of Statistics, 1993, Vol. 1, Parts 1 and 10 and Vol. 2; 3 Central Bureau of Statistics, Dec. 1996, NLSS, 1996, Vol. 1.
1.5. Economic indicators
Gross domestic product
Planned economic development started in Nepal in 1956 with the first five-year plan of 1956–61.
The current five-year plan is the tenth, covering 2002–07. The first plan was formulated by the democratically elected government but before the plan ended, the government was dissolved, in December 1960. The subsequent six plans were formulated and implemented under the
panchayat
1system of government. The eighth plan (1992–97) was the first plan after the restoration of democracy in 1990. Table 1.6 shows performance in different plan periods. The gross domestic product (GDP) average annual growth rate between 1964–65 and 1974–75 was 10.2%. The growth rate at the end of the panchayat period was about 11%. During the interim period the growth rate shot up to 20%. During the eighth plan period the growth rate was slightly over 10% while in recent years it has slid below 10% (Table 1.6). The GDP growth rates in real terms are much lower: in 1989–90 the real growth rate was 4.57% and since then it has gone up and down: in 1998–99 it came down to 3.45%. The rates of growth of population in those years have remained at over 2%.
1 In the panchayat system of government the king of Nepal was the absolute leader.
Table 1.6. GDP and population growth rates, Nepal, 1964–65 to 1998–99 Years Nominal GDP
(million Rs)
Real GDP (1984–85 million Rs)
Real GDP 1984–85 million US$ )
Real GDP average annual growth
Rate (%)
Population average annual growth
rate (%) 1964/65 6 272
1974/75 16 571
1984/85 46 587 46 587 2823
1989/90 103 416 58 243 2110 4.57 2.05
1991/92 149 485 64 496 1503 5.23 2.28
1992/93 171 386 66 979 1565 3.85 2.57
1996/97 280 513 82 980 1461 5.50 2.42
1998/99 342 036 89 255 1313 3.71 2.27
1999/00 379 521 95 016 1377 3.18 2.27
2000/01* 410 194 2001/02** 428 033
* 2000/01 is a revised estimate.
**2001/02 is a preliminary estimate.
Source: National Planning Commission, Eighth Plan, July 1992; MOF, Economic Surveys, 1993, 2000 and 2002.
Foreign exchange rate from Nepal Rastra Bank, Quarterly economic bulletin, 1999, 34(1):68.
Consumer price index
Price changes are influenced by both internal and external factors. Internal factors include conditions of domestic production, the supply situation and the effects of macroeconomic policy.
Prices of imported goods, price fluctuations in India and elsewhere, and rates of inflation in other countries are external factors influencing price trends in Nepal.
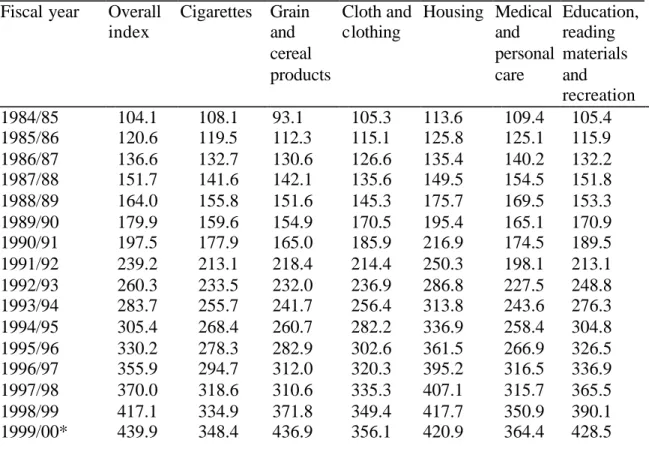
Taking 1983/84 as the base year, Nepal’s overall urban consumer price index increased to 439.9
by the first quarter of the fiscal year 1999/2000 (Table 1.7). The highest price increase (643.9) is
seen for restaurant meals (not shown here; see National Rastra Bank, 1999), vegetables and fruits
(528.4), spices (522.6), pulses (518.5), housing rent (513.1), grains and cereal products (436.9),
followed by education, reading materials and recreation (428.5). For cigarettes the price increase
is relatively moderate, it is about 350 times (Table 1.7). Thus cigarette prices have not kept pace
with overall inflation.
Table 1.7. National urban consumer price index. Base year 1983–84 = 100 Fiscal year Overall
index
Cigarettes Grain and cereal products
Cloth and clothing
Housing Medical and personal care
Education, reading materials and recreation 1984/85 104.1 108.1 93.1 105.3 113.6 109.4 105.4 1985/86 120.6 119.5 112.3 115.1 125.8 125.1 115.9 1986/87 136.6 132.7 130.6 126.6 135.4 140.2 132.2 1987/88 151.7 141.6 142.1 135.6 149.5 154.5 151.8 1988/89 164.0 155.8 151.6 145.3 175.7 169.5 153.3 1989/90 179.9 159.6 154.9 170.5 195.4 165.1 170.9 1990/91 197.5 177.9 165.0 185.9 216.9 174.5 189.5 1991/92 239.2 213.1 218.4 214.4 250.3 198.1 213.1 1992/93 260.3 233.5 232.0 236.9 286.8 227.5 248.8 1993/94 283.7 255.7 241.7 256.4 313.8 243.6 276.3 1994/95 305.4 268.4 260.7 282.2 336.9 258.4 304.8 1995/96 330.2 278.3 282.9 302.6 361.5 266.9 326.5 1996/97 355.9 294.7 312.0 320.3 395.2 316.5 336.9 1997/98 370.0 318.6 310.6 335.3 407.1 315.7 365.5 1998/99 417.1 334.9 371.8 349.4 417.7 350.9 390.1 1999/00* 439.9 348.4 436.9 356.1 420.9 364.4 428.5
* 1st quarter.
Source: Nepal Rastra Bank, Quarterly economic bulletin, 1999, 34(1):44–45.
Employment in different econo mic sectors
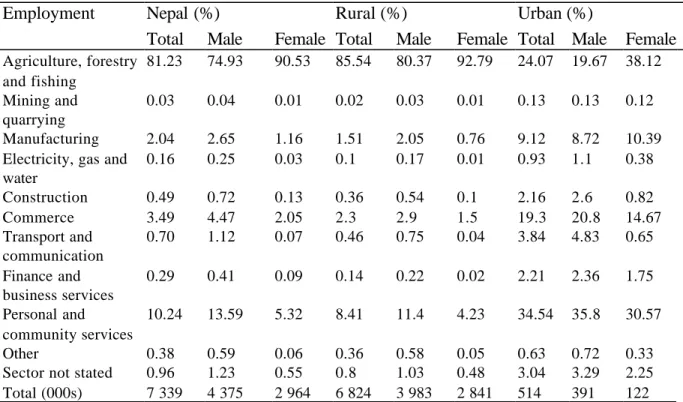
Nepal is predominantly an agrarian economy. According to the 1991 census the proportion of economically active population 10 years of age
1and over engaged in the primary sector,
including agriculture, forestry, hunting and fishing, was 81.2% for both sexes (Table 1.8). More females (90.5%) were engaged in the primary sector than males (74.9%). By residence more rural population are engaged in the primary sector than in other sectors; nearly 86% of the rural
population is engaged in the primary sector while in the urban areas it is only 24%.
Table 1.9 shows the employed population (aged 10+) by major employment sector and sex from 1971 to 1991. The proportion of the population engaged in the primary sector has slowly fallen and the proportion in the tertiary sector has increased. This is true of both males and females.
Even so, the proportion of females engaged in the primary sector is still above 90%.
1 In Nepal there is no system of compulsory education.
Table 1.8. Percentage distribution of the employed population (aged 10+) by major employment sector for rural and urban areas, Nepal, 1991
Employment sector
Nepal (%) Rural (%) Urban (%)
Total Male Female Total Male Female Total Male Female
Agriculture, forestry and fishing
81.23 74.93 90.53 85.54 80.37 92.79 24.07 19.67 38.12 Mining and
quarrying
0.03 0.04 0.01 0.02 0.03 0.01 0.13 0.13 0.12 Manufacturing 2.04 2.65 1.16 1.51 2.05 0.76 9.12 8.72 10.39 Electricity, gas and
water
0.16 0.25 0.03 0.1 0.17 0.01 0.93 1.1 0.38 Construction 0.49 0.72 0.13 0.36 0.54 0.1 2.16 2.6 0.82
Commerce 3.49 4.47 2.05 2.3 2.9 1.5 19.3 20.8 14.67
Transport and communication
0.70 1.12 0.07 0.46 0.75 0.04 3.84 4.83 0.65 Finance and
business services
0.29 0.41 0.09 0.14 0.22 0.02 2.21 2.36 1.75 Personal and
community services
10.24 13.59 5.32 8.41 11.4 4.23 34.54 35.8 30.57
Other 0.38 0.59 0.06 0.36 0.58 0.05 0.63 0.72 0.33
Sector not stated 0.96 1.23 0.55 0.8 1.03 0.48 3.04 3.29 2.25 Total (000s) 7 339 4 375 2 964 6 824 3 983 2 841 514 391 122 Source: Shrestha P, Panta P, 1995. Economically active population. In Population monograph of Nepal. Central Bureau of Statistics, National Planning Commission, Kathmandu. Based on 1991 census data.
Table 1.9. Percentage distribution of the employed population (aged 10+) by major employment sector and sex, Nepal, 1971–91
Major sector 1971 1981 1991
Total Male Female Total Male Female Total Male Female Primary
194.37 92.81 98.17 91.15 88.71 95.75 81.23 74.93 90.53 Secondary
21.17 1.46 0.46 0.53 0.68 0.22 2.56 3.41 1.31 Tertiary
34.45 5.73 1.60 6.47 8.48 2.68 14.87 19.83 7.55 Not stated 1.87 2.13 1.35 0.96 1.23 0.55
Others 0.38 0.60 0.06
1 Primary sector includesagriculture, forestry, hunting and fishing.
2 Secondary sector includes mining, quarrying, manufacturing and construction.
3 Tertiary sector includes electricity, gas, water transport, communications and other services.
Source: Shrestha P, Panta P, 1995. Economically active population. In Population monograph of Nepal. Central Bureau of Statistics, National Planning Commission, Kathmandu. Based on 1991 census data.
In 1998/99 a labour force survey was carried out by the government of Nepal which found that
the primary sector employed 54% of the total labour force, followed by the service sector and
lastly the industrial sector (Table 1.10). The information from this survey is for the economically
active population 15 years of age and over. Some of the difference from the previous table could
be due to the higher age cut off point. Nevertheless it is clear that Nepal remains primarily an
agrarian country.
Table 1.10. Labour force by sector, Nepal, 1998/99 Sector Male Female Total percentage distribution
(000s) (000s) (000s) Male Female Total Agriculture 3166 4074 7 240 54.13 80.15 66.23 Industry 1118 356 1 474 19.11 7.00 13.48 Services 1565 653 2 218 26.76 12.85 20.29
Total 5849 5083 10 932
Source: Government of Nepal. Report on the Nepal labour force survey, 1998–99:118–9, Tables E 6.5 and E 6.6.
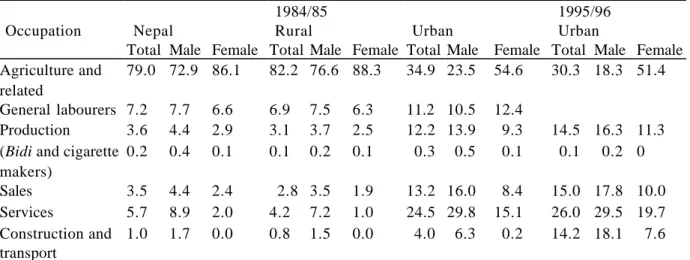
A 1984/85 household budget survey collected more detailed information on occupation than is usual in household surveys. It collected information on the economically active population 10 years of age and over engaged in bidi and cigarette processing by residence, and found that in Nepal only 0.2% were reported engaged in this occupation; more males (0.4%) worked at this trade than females (0.1%; Table 1.11). Also, there was more tobacco production activity in urban areas (0.3%) than rural (0.1%). During the 1980s there were about 6.9 million people 10 years of age and over economically active, so the total number of people engaged in tobacco processing was about 13,800.
The 1995/96 urban household budget survey also contained detailed information on occupation groups. It found that only 0.1% of the economically active population 10 years of age and over was engaged in tobacco processing activity in urban areas (Table 1.11). This means in absolute terms, using the figures in Tables 1.8 and 1.10, that the total number of individuals is somewhere between 7,000 and 11,000. As the 1995/96 survey has no information on rural areas and since historically there have been fewer tobacco workers in rural areas it is quite likely that in the recent past the number of people engaged in tobacco processing has also declined in rural areas.
Table 1.11. Occupational classification of the economically active population 10 years and over, Nepal, 1984/85 and 1995/96
1984/85 1995/96
Occupation Nepal Rural Urban Urban
Total Male Female Total Male Female Total Male Female Total Male Female Agriculture and
related
79.0 72.9 86.1 82.2 76.6 88.3 34.9 23.5 54.6 30.3 18.3 51.4 General labourers 7.2 7.7 6.6 6.9 7.5 6.3 11.2 10.5 12.4
Production 3.6 4.4 2.9 3.1 3.7 2.5 12.2 13.9 9.3 14.5 16.3 11.3 (Bidi and cigarette
makers)
0.2 0.4 0.1 0.1 0.2 0.1 0.3 0.5 0.1 0.1 0.2 0 Sales 3.5 4.4 2.4 2.8 3.5 1.9 13.2 16.0 8.4 15.0 17.8 10.0 Services 5.7 8.9 2.0 4.2 7.2 1.0 24.5 29.8 15.1 26.0 29.5 19.7 Construction and
transport
1.0 1.7 0.0 0.8 1.5 0.0 4.0 6.3 0.2 14.2 18.1 7.6 Source: multipurpose household budget survey, 1988:60–61; and household budget survey, 1999.
2. THE TOBACCO INDUSTRY IN NEPAL 2.1. Tobacco industry statistics
Number of establishments, employment, output and wages
A small semi- mechanized factory was established in 1948 at Birganj, a town near the Indian border due south of Kathmandu, with a limited capacity of 300 million sticks per year. It had a precarious existence because of the competition it faced from across the border, and met only a small part of Nepal’s demand. With the signing of a protocol in April 1959 between the
government of the Soviet Union and the government of Nepal, a modern factory was established in Janakpur, south-east of Kathmandu in the plains area of Nepal. It was formally inaugurated by the then king of Nepal in January 1965. The factory’s total capacity was to be 2,000 million sticks a year (Devkota, 1968). At that time the total annual import requirement of cigarettes was
estimated at 2,000 million sticks, but customs statistics recorded imports of only 1,038 million sticks in 1960/61. It was supposed that a sizeable part of imports went unrecorded, crossing the 600 mile border with India illegally.
By 1996/97 there were 38 establishments (Table 2.1) producing tobacco products—cigarettes and bidi. Most of these production units are very small and they are often poorly organized. Only the five cigarette-producing factories are well organized. The only one in the public sector is the Janakpur Cigarette Factory. The four private sector companies are Surya Tobacco Company Pvt.
Ltd., Perfect Blended Pvt. Ltd., Nepal Tobacco Pvt. Ltd. and Seti Cigarette Factory. The last one is registered as a factory but functions as a dealer for foreign cigarettes; it does not produce cigarettes locally. All the private factories were founded after 1980.
Table 2.1. Industrial (manufacturing) establishments in Nepal, 1996/97 Industry Number
of establish ments
Number of persons engaged
Number of employees
Wages and salaries (Rs 000s)
Percentage of
workforce
Average wages and salaries (Rs)
Average wages and salaries (Rs/month) Tobacco mfg 38 3,213 3,142 101,939 1.68 32,444 2,704 Other 3,519 193,495 184,174 3,956,130 98.32 21,480 1,790 Total 3,557 196,708 187,316 4,058,069 100.00 21,664 1,805
Source: Central Bureau of Statistics, Statistical year book of Nepal 1999. Government of Nepal, National Planning Commission Secretariat, Kathmandu, Nepal. 1999, Table 13.
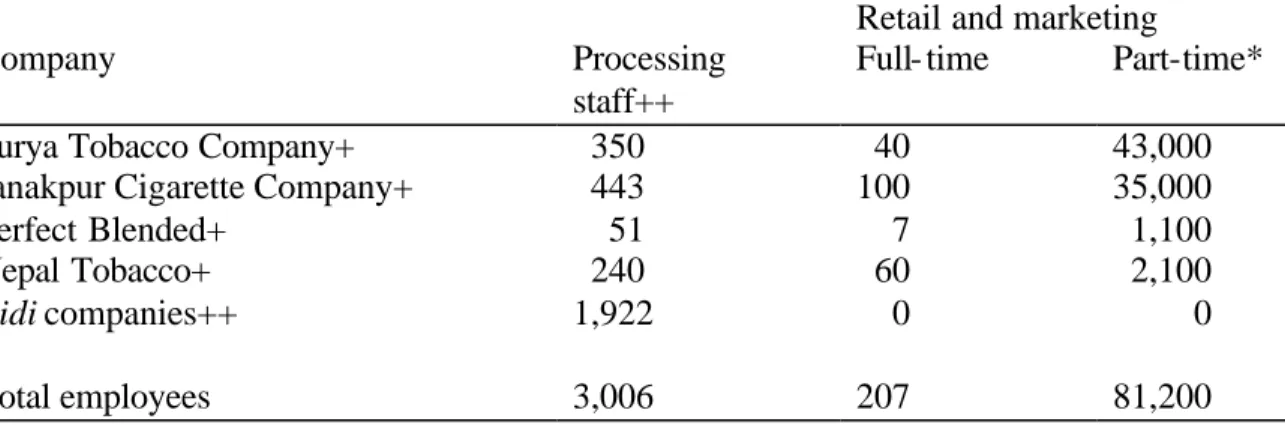
The statistics show a little over 3,200 persons employed full time in tobacco-related industries (Table 2.1). There are also 81,200 retailers who sell cigarettes as well as many other goods, who might therefore be counted as working part-time (Table 2.2).
The average wage of those working in tobacco product manufacturing establishments is about 1.5
times higher than in other manufacturing establishments (Table 2.1). In addition, since all bidi
workers are classified as unskilled (Table 2.3), the average wage in the cigarette- manufacturing industries will be much higher than the average shown in Table 2.1.
Table 2.2. Employment in the tobacco-producing and retail sector, 2000, Nepal Retail and marketing
Company Processing
staff++
Full- time Part-time*
Surya Tobacco Company+ 350 40 43,000
Janakpur Cigarette Company+ 443 100 35,000
Perfect Blended+ 51 7 1,100
Nepal Tobacco+ 240 60 2,100
Bidi companies++ 1,922 0 0
Total employees 3,006 207 81,200
*Retailers.
Source: +personal communication with Company Registration Department, Ministry of Industry, Commerce and Supplies; ++personal communication with respective industries.
Among the current total employees in tobacco companies, only about 28% are reported to be skilled (Table 2.3). In cigarette factories, however, most employees are skilled. In the bidi factories no workers are classified as skilled.
Table 2.3. Tobacco employees by skill category
Company Total
employees
Skilled* Unskilled
Surya Tobacco Company+ 390 302 88
Janakpur Cigarette Factory+ 543 303 240
Perfect Blended+ 58 46 12
Nepal Tobacco+ 300 240 60
Bidi companies** 1,922 0 1,922
Total 3,213 891 2,322
*includes 70% semi skilled; **seasonal workers.
+Personal communication with each company.
Source: Central Bureau of Statistics, Census of manufacturing establishments, 1996–1997, national level:1.