Report No. 41
South Asia Human Development Sector
Demographic Transition and the Labor Market in Sri Lanka
October 2012
Discussion Paper Series
Public Disclosure AuthorizedPublic Disclosure AuthorizedPublic Disclosure AuthorizedPublic Disclosure Authorized
74171
Report No. 41
South Asia: Human Development Unit
Demographic Transition and the Labor Market in Sri Lanka
October 2012
Discussion Paper Series
Discussion Papers are published to communicate the results of the World Bank’s work to the development community with the least possible delay. The typescript manuscript of this paper therefore has not been prepared in accordance with the procedures appropriate to the formally edited texts. Some sources cited in the paper may be informal documents that are not readily available.
The findings, interpretations, and conclusions expressed herein do not necessarily reflect the views of the International Bank for Reconstruction and Development / The World Bank and its affiliated organizations, or those of the Executive Directors of the World Bank or the government they represent.
The World Bank does not guarantee the accuracy of the data included in this work. The boundaries, colors, denominations, and other information shown on any map in this work do not imply any judgment on the part of the World Bank concerning the legal status of any territory or the endorsement or acceptance of such boundaries.
Table of Contents
Acknowledgements ... i
Introduction ... 1
A Large, Educated Supply of Workers ... 3
Growing Demand for Workers ... 8
Labor Market Outcomes: Combining Supply and Demand ... 11
Analyzing Labor Market outcomes: Labor Force Participation and Unemployment ... 13
Empirical Patterns ... 13
What are the determinants of labor force participation and probability of being unemployed? ... 16
Analyzing Labor Market Outcomes: Job Status ... 20
Empirical Patterns ... 20
What are the characteristics of those who work in informal and formal jobs? ... 26
Analyzing Labor Market Outcomes: Earnings ... 28
Empirical Patterns ... 28
What are the returns to schooling and experience, and how large is the public sector wage premium? 29 Way Forward: Policy implications ... 30
References ... 33
Annex1: Classification of Countries by Demographic Setting ... 36
Annex 2: Empirical Models and Regression Results ... 38
List of Table Table 1: Share of working age and youth in the population, 1992-2009 ... 3
Table 2: Growth rate and size of working age population 1992-2009 ... 3
Table 3: Projected Trends in Working Age Population and Labor Force Participants ... 6
Table 4: Percentage of working age people in the labor force and their age ... 7
Table 5: Patterns in Comparator Countries, 2007 ... 8
Table 6a: Sectoral Share of Employment, 1992-2009 ... 9
Table 6b: Composition of Service Sector Employment, 2009 10
Table 7: Labor Force Participation and Unemployment rates by age and sex, 1992-2009 ... 14
Table 8: Transition from school to unemployment ... 15
Table 9: District level labor force participation, unemployment, and employment... 16
Table 10: Type of employment and job quality ... 21
Table 11: Share of employment by occupations within Industry, 2009 ... 22
Table 12: Real Mean Monthly Earnings, Formal and Informal Sector Workers, 2009 ... 26
Table 13: Percent of Formal and Informal Workers Across Industry Groups, 2009 ... 27
Table 14: Trends in Real Mean Monthly Earnings, 2006-2009 ... 29
List of Figures Figure 1: Distribution of Working Age Population by Completed Years of Schooling, 2009 ... 4
Figure 2: Age Profile of Labor Force Participants ... 7
Figure 3: Distribution of Non-Agriculture Private Sector Employment by Firm Size (total number of regular employees), 2009... 11
Figure 4: Shifts in Supply of Workers Induced by Demographic Changes: ... 12
Figure 5: Labor Force Participation Rates by Age... 14
Figure 6: Gender composition of Employment by Industry and Occupations: Share of Men in total
Employment... 24 Figure 7: Distribution of the Employed in Formal and Informal Jobs, 2009 ... 25
i
Author
Nistha Sinha Senior Economist
World Bank
ii
Acknowledgements
The author acknowledges the comments and suggestions by Cem Mete (Lead Economist, World Bank) and Stefania Rodica Cnobloch (Consultant, World Bank).
1
Introduction
Sri Lanka’s demographic transition has significantly shaped the age distribution of the labor force and created a large working age population (World Bank 2008). Changing cohort sizes of young and old workers not only affect their own labor market outcomes (job quality, earnings), but also potentially affect growth prospects in the economy (Bloom, Canning and Sevilla 2003).
Recovering from a 30-year conflict in the North and the East, Sri Lanka aims to accelerate growth in the medium term by substantially increasing investments. What will be the role of the labor market in delivering this growth? The service sector is expanding and accounts for nearly 60 percent of the GDP and almost 40 percent of employment. However, only 56 percent of the working age population is employed – a result of low participation and high unemployment rates among women and youth. Any growth strategy will have to bring in more working age people, particularly women, into economic activity.1
The paper analyzes the labor market during 1992-2009, the wartime years, and uses the findings to help understand implications for the labor market as the economy grows and recovers from the conflict. The analysis is primarily based on annual Labor Force Survey (LFS) data collected by the Department of Census and Statistics (DCS) between 1992 and 2009.2 The paper excludes the North and East from the analysis because the labor market in these provinces was functioning in atypical times, and was affected severely by the security situation. The 2006 Moving out of Poverty study conducted in conflict areas noted large outmigration of the better off households and the reliance on those left behind on remittances (Center for Poverty Analysis 2006). The study also found that private sector investment had largely dwindled in these provinces, and the main source of jobs was public employment.
On the supply side, demographic projections suggest that if the current demographic trends continue, the labor force will start to shrink after 2026. On the demand side, regulations such as Termination of Employment of Workman Act (TEWA) and wage setting institutions protect jobs and also shape firms’ ability to create jobs. Key empirical patterns in labor market outcomes between 1992 and 2009 are as follows.
Between 1992 and 2009, labor force participation rates among those aged 35 and older increased, and this trend is most notable for women. In 2009, nearly 50 percent of women aged 20 to 50-54 participated in the labor market; there is a slight dip in female labor force participation rates during peak years of childbearing (25 to 34). An overall unemployment rate of 9 percent in 2009 is notably lower than the 15 percent unemployment rate in 1992, but high unemployment persists among women and youth.
National averages mask considerable district level variation in labor market outcomes.
1 The analysis is based on Labor Force Survey data (LFS) that does not cover migrants who have left to work abroad. By all accounts, a large percentage of these overseas migrants are young women. Leaving them out therefore underestimates the labor force participation by women. See (De Silva forthcoming).
2 It is important to note that the LFS does not cover migrants who have left to work abroad. By all accounts, a large percentage of these overseas migrants are young women. Leaving them out underestimates the labor force participation by women.
2
In 2009, while more than half the workers were engaged in paid work, most of this work was temporary or casual. Most workers are employed in informal jobs; in 2009, 63 percent of women and 70 percent of men were employed in informal jobs.
There is notable occupational segregation by gender within industry and occupations.
Between 1992 and 2009, most female entrants to the labor market found employment in education/health/social work and manufacturing, community and social work, hotels and restaurants, wholesale and retail trade, financial intermediation, and agriculture/fishing/mining in occupations as clerks, professionals, technical and associate professionals, skilled agriculture and fisheries and crafts workers. While women made some inroads into occupations such as managers/senior officials/legislators, they remained a very small share of employment in these jobs.
For all paid workers, real monthly earnings declined by about 5 percent between 2006 and 2009.
Men earn between 30 to 36 percent more than women in the private sector and semi- government organizations; there is gender parity in earnings in the public sector.
Earnings are higher for the public sector and semi-government sector than in the private sector. Public sector earnings are higher than semi-government earnings.
Looking ahead, over the next 15 years, demand for workers in industry is likely to increase as rebuilding and recovery in the North and East proceeds. In addition, demand for highly skilled workers to meet the needs of the expanding services sector, particularly higher-end services, will also increase. Analyzing the empirical trends using the LFS, it is clear that increasing female labor force participation, addressing high youth unemployment and its causes, and addressing the negative aspects of certain labor market regulations will be key to meeting the needs of a growing economy.
The paper is organized as follows. The two sections that follow present an overview of the supply and demand side of the labor market. The next section discusses the ways in which the demographic transition could shape the labor market, particularly in terms of unemployment and earnings. This discussion is followed by three sections examining labor force participation and unemployment, job type, and earnings respectively. The last section concludes with some policy recommendations.
3
A Large, Educated Supply of Workers
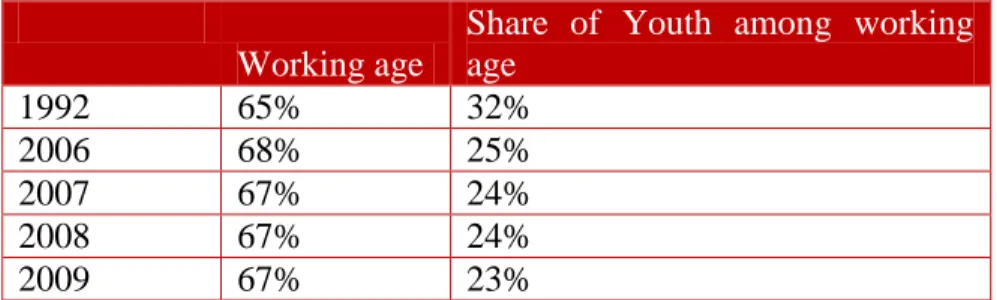
The majority of Sri Lankans are in the working age group between the ages of 15 and 64, but the share of youth (15-24) has declined over the last two decades. The share of working age (15-64) population is 67 percent, the highest in the South Asia region, and this share has largely remained unchanged over the last two decades (Table 1). The large share of working age people in the population is the potential source of the much talked about “demographic dividend” of greater economic growth and savings that the country could enjoy. The share of youth (15-24) among the working age group has dropped noticeably over the period, from 32 percent in 1992 to 23 percent in 2009, reflecting declining fertility rates and a consequent ageing of the population.
Table 1: Share of working age and youth in the population, 1992-2009
Working age
Share of Youth among working age
1992 65% 32%
2006 68% 25%
2007 67% 24%
2008 67% 24%
2009 67% 23%
Source: Staff calculations using LFS data for various years.
Note: Excluding North and East.
Between 1992 and 2009, population growth added nearly 3 million people to the working age group, and of these, about 2 million joined the labor force (working or looking for jobs); the employment increase over the period was sufficient to absorb these additions to the labor force.
The number of people in the working age group grew by 31 percent between 1992 and 2009, while the size of the youth population fell by 5 percent (Table 2). As the working age population grew, so did the size of the population participating in the labor force (working or looking for work), which grew by 35 percent between 1992 and 2009. The number of jobs (employed) grew by 45 percent, exceeding the growth in the size of the economically active population (labor force participants), suggesting that the economy was able to absorb the entrants to the labor market. Among the economically active population, the number of unemployed declined by 18 percent.
Table 2: Growth rate and size of working age population 1992-2009
1992 2009 Growth rate
1992-2009
Youth (15-24) 3,006,139 2,868,183 -5%
Working age (15-64) 9,420,106 12,300,000 31%
Labor force participants
(15-64) 5,549,098 7,504,575 35%
Employed (15-64) 4,723,494 6,828,103 45%
Source: Staff calculations using LFS data for various years.
Note: Excluding North and East.
4
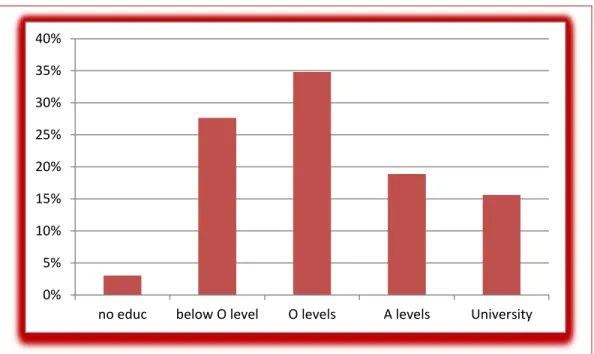
Schooling levels among the working age population is high; in 2009, more than 30 percent of the working age population completed Grade 10 or O-levels. About 20 percent completed collegiate or A-levels, while 15 percent have a university degree (Figure 1). Madrigal and Paci (2010) report that among the younger cohorts of the working age group, the average years of schooling in Sri Lanka is the highest in South Asia.
Figure 1: Distribution of Working Age Population by Completed Years of Schooling, 2009
Source: LFS data for 15-64 year old (working age). Staff calculations.
Note: Excluding North and the East.
However, there is a growing recognition that more investment is needed in higher education because of the country’s growing technology industry. The Investment Climate Assessment (Asian Development Bank and World Bank 2004) noted that Sri Lanka faces a shortage of highly skilled workers because of outmigration of scientists and engineers (“brain drain”).
Another reason for the shortage of highly skilled workers is the inadequate quality of higher education institutions, which do not adequately prepare graduates for the changing labor market (World Bank (2009)).
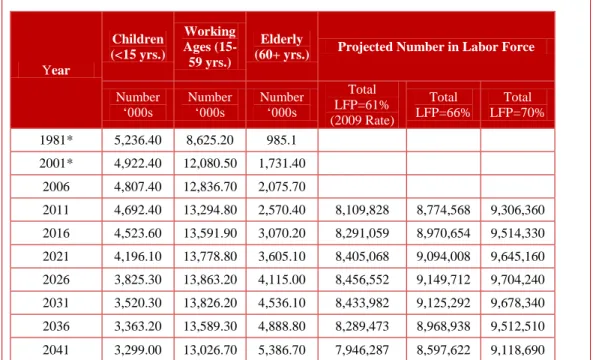
The growth in the working age population will soon start to slow down. Over the next 15 years, between 2011 and 2026, projected population growth is expected to add 568,400 individuals to the age group of 15-59. If current patterns of labor force participation continue, then the size of the labor force will start to decline after 2026 (Table 3 and Vodopivec & Arunatilake (2008)).
Assuming no further behavioral adjustments by families to the changing demographic patterns and the end of conflict in the North and East, Table 3 shows that one way of increasing the number of labor force participants in the economy would be to increase women’s labor force participation. For example, increasing the women’s labor force participation rate by about 15 percentage points over the 2009 levels will raise the overall labor force participation rate
0%
5%
10%
15%
20%
25%
30%
35%
40%
no educ below O level O levels A levels University
5
increases from 61 percent to 70 percent and add more than a million workers to the labor market each year.
6
Table 3: Projected Trends in Working Age Population and Labor Force Participants
Year
Children (<15 yrs.)
Working Ages (15- 59 yrs.)
Elderly
(60+ yrs.) Projected Number in Labor Force
Number
‘000s Number
‘000s Number
‘000s
Total LFP=61%
(2009 Rate)
Total LFP=66%
Total LFP=70%
1981* 5,236.40 8,625.20 985.1 2001* 4,922.40 12,080.50 1,731.40
2006 4,807.40 12,836.70 2,075.70
2011 4,692.40 13,294.80 2,570.40 8,109,828 8,774,568 9,306,360 2016 4,523.60 13,591.90 3,070.20 8,291,059 8,970,654 9,514,330 2021 4,196.10 13,778.80 3,605.10 8,405,068 9,094,008 9,645,160 2026 3,825.30 13,863.20 4,115.00 8,456,552 9,149,712 9,704,240 2031 3,520.30 13,826.20 4,536.10 8,433,982 9,125,292 9,678,340 2036 3,363.20 13,589.30 4,888.80 8,289,473 8,968,938 9,512,510 2041 3,299.00 13,026.70 5,386.70 7,946,287 8,597,622 9,118,690 Source: Based on (De Silva forthcoming)).
Note: These projections are based on population censuses and do not exclude the North and the East. Also note that the age groups are different from those used in the rest of the report.
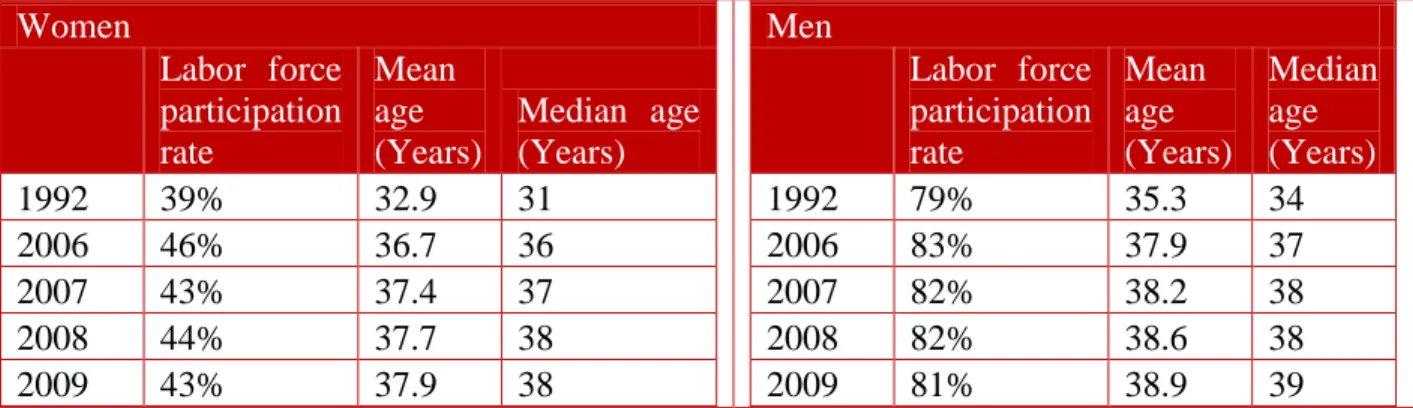
The labor force is ageing. Over the last two decades, the percentage of working age population working or looking for work - the labor force participation rate - has remained more or less unchanged; about 80 percent of working age men and 40 percent of working age women participate in the labor force. However, the mean and median age of these labor force participants has noticeably increased for both women and men (Table 4). The average female labor force participant was almost 33 years old in 1992 and almost 38 years old in 2009.
Similarly, the average male labor force participant was about 35 years old in 1992 and about 39 years old in 2009. The median age of labor force participants shows an even greater increase over time, 7 years for women and 5 years for men. The increasing mean and median age suggest a shift and change in the age profile of labor force participants (Figure 2). In 1992, the bulk of those working or looking for work were under 25 years of age. Over time this age profile of labor force participants has shifted and the share of those 40 or older has increased (Figure 2).
7
Table 4: Percentage of working age people in the labor force and their age
Women
Labor force participation rate
Mean age (Years)
Median age (Years)
1992 39% 32.9 31
2006 46% 36.7 36
2007 43% 37.4 37
2008 44% 37.7 38
2009 43% 37.9 38
Men
Labor force participation rate
Mean age (Years)
Median age (Years)
1992 79% 35.3 34
2006 83% 37.9 37
2007 82% 38.2 38
2008 82% 38.6 38
2009 81% 38.9 39
Source: LFS data for 15-64 year old (working age), various years. Staff calculations.
Note: Excluding North and the East.
Figure 2: Age Profile of Labor Force Participants
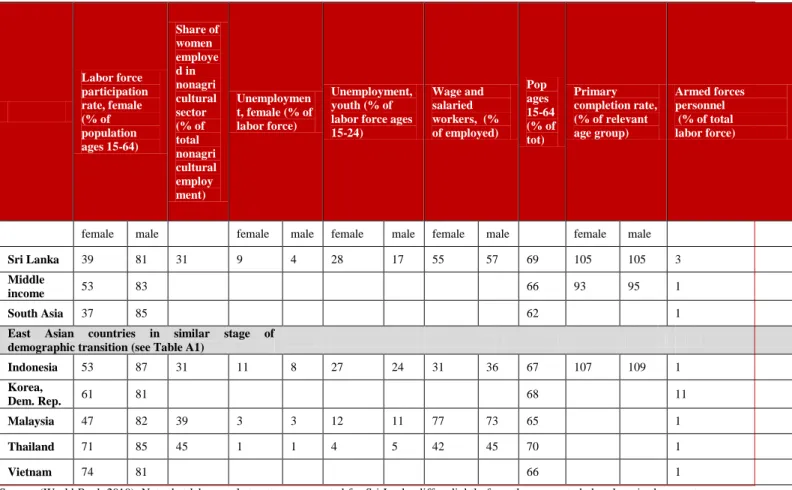
Labor market outcomes in Sri Lanka are similar to countries in the same stage of demographic transition and are more favorable than its regional neighbors. The only exception to this comparison is female labor force participation rate, which is similar to regional neighbors (Table 5). Table A1 (Annex 1) shows comparator countries that are in the same demographic phase as Sri Lanka. These countries include a number of countries in East Asia and Latin America. Table 5 also compares labor market outcome with the group of middle-income countries. Sri Lanka’s female labor force participation rate of 39 percent is below that of middle- income countries and East Asia countries also experiencing demographic transition. Youth unemployment rates are also higher in Sri Lanka than to comparator countries for which data is available.
8
Table 5: Patterns in Comparator Countries, 2007
Labor force participation rate, female (% of population ages 15-64)
Share of women employe d in nonagri cultural sector (% of total nonagri cultural employ ment)
Unemploymen t, female (% of labor force)
Unemployment, youth (% of labor force ages 15-24)
Wage and salaried workers, (%
of employed) Pop ages 15-64 (% of tot)
Primary completion rate, (% of relevant age group)
Armed forces personnel (% of total labor force)
female male female male female male female male female male
Sri Lanka 39 81 31 9 4 28 17 55 57 69 105 105 3
Middle
income 53 83 66 93 95 1
South Asia 37 85 62 1
East Asian countries in similar stage of
demographic transition (see Table A1)
Indonesia 53 87 31 11 8 27 24 31 36 67 107 109 1
Korea,
Dem. Rep. 61 81 68 11
Malaysia 47 82 39 3 3 12 11 77 73 65 1
Thailand 71 85 45 1 1 4 5 42 45 70 1
Vietnam 74 81 66 1
Source: (World Bank 2010). Note that labor market outcomes reported for Sri Lanka differ slightly from those reported elsewhere in the report.
This discrepancy arises from difference in data sources.
Growing Demand for Workers
The service sector is the dominant source of demand for labor. To examine the demand for workers, it is informative to look at the structure of production. In 2009, the service sector made up nearly 60 percent of GDP, followed by industry (about 28 percent of GDP) and agriculture (about 12 percent of GDP)3 The service sector has been expanding in terms of its share of GDP.
For example, hotels and restaurants, telecoms, and government services had among the highest sectoral rate of GDP growth in the last quarter of 2009 (World Bank 2010).
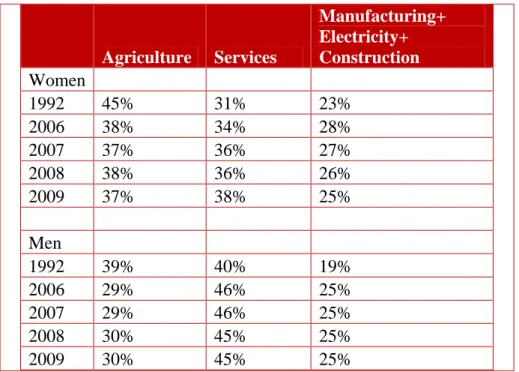
As the service sector expands, demand for workers in this sector is also expected to grow. The service sector expansion relies relatively more on employment growth than does expansion in industry or agriculture sectors. Table 6a shows that in terms of employment share, the service sector share has expanded. Among men, employment in the service sector has grown since 1992 to become the dominant employment sector with 45 percent of all employed men. Agriculture and industry still account for roughly 25 to 30 percent of male employment. Among women,
3 http://www.statistics.gov.lk/national_accounts/Annual2009/quick.pdf
9
agriculture used to be the dominant sector of employment in 1992, but by 2009, employment share of services has grown to nearly 40 percent. In 2009, agriculture also employed close to 40 percent of women.
Table 6a: Sectoral Share of Employment, 1992-2009
Agriculture Services
Manufacturing+
Electricity+
Construction Women
1992 45% 31% 23%
2006 38% 34% 28%
2007 37% 36% 27%
2008 38% 36% 26%
2009 37% 38% 25%
Men
1992 39% 40% 19%
2006 29% 46% 25%
2007 29% 46% 25%
2008 30% 45% 25%
2009 30% 45% 25%
Source: LFS data for 15-64 year old (working age), various years. Staff calculations.
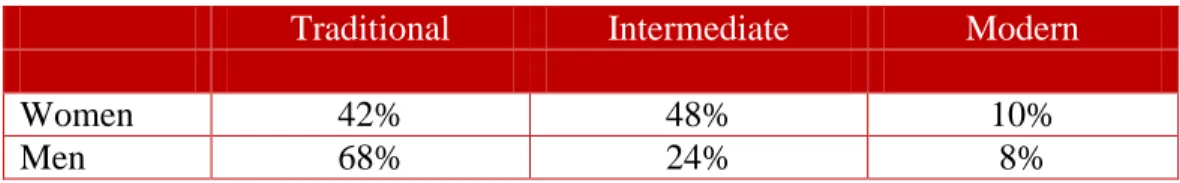
Within the services sector, women are employed mainly in education and health services, whereas men are mainly employed in the traditional, non-tradable sectors of wholesale and retail trade, public administration and defense, and transport (Table 6b). Following Eichengreen and Gupta (2011), we can further break down service sector employment into traditional services (wholesale and retail trade, transport, storage and posts, public administration and defense), intermediate services (education, health and social work, hotels and restaurants, and other community, social and personal services), and modern services (financial intermediation, computer services, business services, communications etc.). Men in service sector jobs are employed mostly in traditional services; whereas service sector women are mostly employed in intermediate services (mainly education, health and social work). Greater defense expenditures and increased hiring of armed forces during the war could be responsible for the greater share of men’s employment in traditional service sectors. For men and women, employment in modern services accounts for about 10 percent of service sector employment. This modern group of the service sector is potentially an important source of growth for the economy.
10
Table 6b: Composition of Service Sector Employment, 2009
Traditional Intermediate Modern
Women 42% 48% 10%
Men 68% 24% 8%
Source: LFS data for 15-64 year old (working age), various years. Staff calculations.
The public sector is an important player in the labor market. As Table 10 shows, the share of public sector employment, especially among women and youth, has increased between 2006 and 2009. This partly has been due to the conflict due to the government’s increase in defense expenditures and expansion of the armed forces. As analysis in later sections shows, all else being equal, workers in public sector employment earn much more than their private sector counterparts do.
Labor regulations shape the demand side of the market. The World Bank (2006) examines three employment protection institutions in Sri Lanka – the Termination of Employment of Workman Act (TEWA), wage setting in certain sectors, and civil service hiring practices – and finds that each of these affects the demand for labor. The 2004 Investment Climate Assessment identified costly labor regulations as being an important component of easing labor market conditions and for improving Sri Lanka’s international competitiveness (Asian Development Bank and World Bank 2004). Under TEWA, in firms with 15 or more workers, employees who have worked for more than 6 months become permanent staff. The firm must obtain government authorization to lay off these workers, and obtaining such authorization is seldom an easy process.
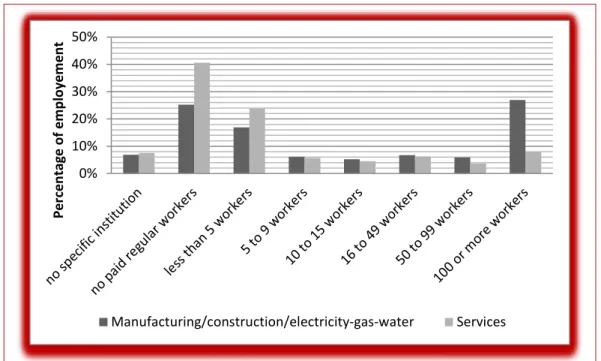
Labor regulations are considered to be a reason for firms’ reliance on temporary workers, keeping the number of full-time employees below the TEWA threshold of 15 employees (Investment Climate Assessment, 2004; World Bank 2006). A tabulation of firm size reported in the 2009 Labor Force Survey shows that the bulk of the workers in both agriculture and non- agriculture sectors are employed in organizations with no regular employees. Figure 3 shows the distribution of employment by firm size for those employed in non-agriculture private sector.
Most workers in the non-agriculture sector are employed in organizations with no paid regular workers, and the remaining workers are employed either in very small firms (less than 5 workers) or in large firms in the case of manufacturing/construction/electricity-gas-water supply.
The “missing middle”– very few workers employed in firms with 5 to 99 workers–could be an outcome of labor regulations (World Bank 2006b).
11
Figure 3: Distribution of Non-Agriculture Private Sector Employment by Firm Size (total number of regular employees), 2009
Source: Staff calculations using LFS data for 2009.
Several institutions are involved in setting wages in the formal sector, and these include the pay commissions for public sector jobs (semi-government is excluded), tripartite Wages Boards and collective bargaining institutions for formal private sector jobs. Wages Boards determine minimum wages for formal private jobs (World Bank 2006). Public sector pay commissions have had a positive effect on the gender gap in earnings (see section on earnings). However, these wage-setting practices are also considered to have raised labor costs, which in turn encourage unemployment and informal work.
Improving labor market flexibility through reform of labor regulations is one of the recommendations of the 2004 Investment Climate Assessment. Other recommendations to improve the conditions under which the private sector operates in Sri Lanka include improving access to energy and transport, reducing the access to and cost of finance, connecting rural firms to major markets, and promoting macroeconomic stability.
Labor Market Outcomes: Combining Supply and Demand
Labor market outcomes are a result of supply- and demand-side characteristics of the market.
Fertility and mortality trends affect the size of the working age population (aged 15-64);
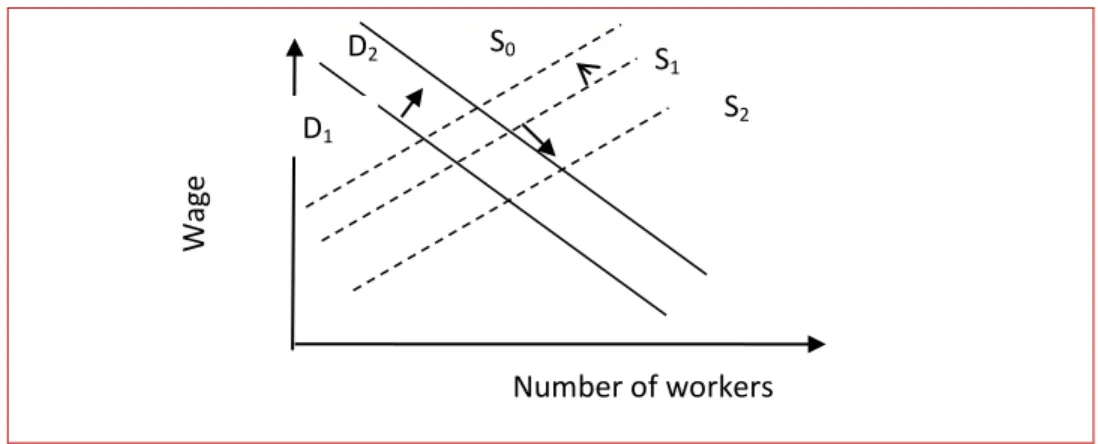
declining fertility and mortality trends in Sri Lanka have added large numbers of young workers to the labor market. In a simple conceptual framework of demand for and supply of workers, an increase in the number of working age people will shift the supply of workers (from S1 to S2 in Figure 4) (Ehrenberg and Smith 1987). The conceptual framework would predict a fall in equilibrium (real) wages as the market adjusts to employ more workers. A decline in number of workers would shift the supply of workers from S1 to S0 and create an upward pressure on
0%
10%
20%
30%
40%
50%
Percentage of employement
Manufacturing/construction/electricity-gas-water Services
12
wages. This demographically induced change in wages, however, could be offset by any changes on the labor demand side, such as increasing demand for workers due to greater aggregate demand in the economy. For example, a shift in labor demand from D1 to D2 would offset any changes in equilibrium wages and employment brought about by a shift in the supply of workers (Figure 4).
This demand-supply framework has been used extensively to study the U.S. labor market, which has not only witnessed demographically induced changes on the supply side (large influx of young workers in the 1970s, the so-called baby boomers), but also changes on the demand side (see for example, (Welch 1979), (Katz and Murphy 1992)). In general, the U.S. analysis suggests that large number of entrants to the labor force (large cohort sizes) adversely affect earnings for that group of workers. There is evidence, however, that the demand side matters too in mitigating or magnifying the effect of supply of workers. Korenmark and Neumark (1997) analyzed data from 15 OECD countries between 1970 and 1994 to assess whether large youth cohorts adversely affected labor market outcomes for youth and found that cohort size did matter; they also found evidence that demand side conditions were important in shaping how well or badly the youth fared.
Figure 4: Shifts in Supply of Workers Induced by Demographic Changes:
A Conceptual Framework
Sri Lanka did not experience a “baby boom” or a bust; fertility has declined steadily over time (De Silva forthcoming). This was reflected in the steady increase in the share of the working age population, and in particular, the share of youth entering the working age group. Consistent with this pattern, between 1992 and 2006, real earnings grew by only 4 percent (see below). By the late 1990s, the persistent fertility decline resulted in a decline in youth population shares (see Table 1). This reduction in youth population shares should improve youth labor market outcomes such as unemployment rates. Although unemployment rates for youth have dropped between 1992 and 2009, they remain high at about 27 percent (Table 7)). This suggests that factors other than demographically induced changes in the size of the work force are at play, such as the demand for labor and labor market regulations.
The next 3 sections analyze three labor market outcomes arising out of the interaction between supply and demand factors: labor force participation and unemployment, job type, and earnings.
D2 S0 S1
S2
Number of workers
Wage
D1
13
These sections present empirical patterns for these outcomes between 1992 and 2009 and investigate their determinants.
Analyzing Labor Market outcomes: Labor Force Participation and Unemployment
Empirical Patterns
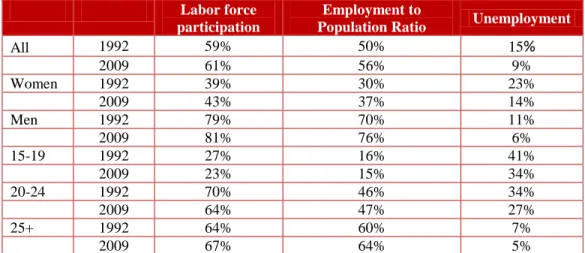
Sri Lanka employs just over half of its working age population (15-64); low labor force participation by women and high unemployment among youth are sources of this low overall employment to population ratio. In 2009, 56 percent of the working age population was employed, while 9 percent of economically active workers were unemployed (Table 7). These statistics mask notable variation by sex and age. Among women, the employment to population ratio is 37 percent as compared to 81 percent for men. Among youth aged 20-24, the employment to population ratio is 47 percent as compared to 64 percent among those aged 25 and older. Young people’s participation in the labor market has also gone down in the recent years; among 20-24 year olds, the labor force participation rate has declined from 70 percent in 1992 to 64 percent in 2009.4
Over time, labor force participation rates among those aged 35 and older has increased, and this trend is most notable for women. Reflecting demographic trends, not only has the number of working age adults (those older than 25) increased, the share of these adults 40 and older who participate in the labor force has also increased (Figure 5). The increase in labor force participation rates among adults is greater for women than men. For women, the largest increase in labor force participation rates occurs among those aged 45-54, for whom participation rates increased by 10 percentage points or more between 1992 and 2009.
In 2009, nearly 50 percent of women aged 20 to 50-54 participated in the labor market; there is a slight dip in female labor force participation rates during peak years of childbearing (25 to 34). This high labor force participation rate of 20-54 year olds is close to the average for middle- income countries and countries in comparable stage of demographic transition such as Indonesia (see Table 5).
4Low labor force participation rates among 15-19 year olds is consistent with high secondary and tertiary level school enrollment.
14
Figure 5: Labor Force Participation Rates by Age
Source: Staff calculations using LFS data for each year.
An overall unemployment rate of 9 percent in 2009 is notably lower than the 15 percent unemployment rate in 1992, but high unemployment persists among women and youth (Table 7).
In 2009, the unemployment rate was 14 percent for women and 27 percent for 20-24 year olds.
Among men and older adults, the unemployment rate was about 5 percent. Sri Lanka’s youth unemployment rate is among the highest in the world. In addition to demographic pressures, and constraints on the supply side (households) and demand side (employers), a persistently high unemployment rate can discourage workers from staying in the labor market searching for jobs.
Unemployment duration data collected in the 2009 round of the Labor Force Survey shows that 48 percent of unemployed women had been unemployed for 1 year or more, while 44 percent of men had been unemployed for less than 6 months.
Table 7: Labor Force Participation and Unemployment rates by age and sex, 1992-2009
Labor force participation
Employment to
Population Ratio Unemployment
All 1992 59% 50% 15%
2009 61% 56% 9%
Women 1992 39% 30% 23%
2009 43% 37% 14%
Men 1992 79% 70% 11%
2009 81% 76% 6%
15-19 1992 27% 16% 41%
2009 23% 15% 34%
20-24 1992 70% 46% 34%
2009 64% 47% 27%
25+ 1992 64% 60% 7%
2009 67% 64% 5%
Source: Staff calculations using LFS data. Weighted. Working age population refers to those aged 15-64.
0%
10%
20%
30%
40%
50%
60%
70%
80%
90%
100%
15-19 20-24 25-29 30-34 35-39 40-44 45-49 50-54 55-59 60-64 female 1992 female 2009 male 1992 male 2009
15
Unemployment rate is calculated only for those in the labor force.
A detailed island-wide survey of school-to-work transition among 15-25 year olds, who had completed schooling between 1999 and 2006 (World Bank, 2007) showed that unemployment spells were common for new entrants into the labor market (Table 8). Nearly 55 percent of youth who had completed schooling reported ever being unemployed. Among these youth who had ever experienced unemployment between 1999 and 2006, most experienced their first unemployment spell in the year they completed schooling and entered the labor market. For example, 66 percent of those who had completed schooling in 2000 were also unemployed in that year; only 2 percent began their first unemployment spell 2 years after completing school.
Table 8: Transition from school to unemployment
Year school completed or stopped
Year first unemployment spell started
1999 2000 2001 2002 2003 2004 2005 2006 Total
1999 50% 35% 15% 100%
2000 66% 20% 2% 2% 4% 5% 1% 100%
2001 73% 16% 4% 2% 4% 1% 100%
2002 61% 28% 8% 2% 1% 100%
2003 73% 19% 5% 3% 100%
2004 74% 24% 2% 100%
2005 86% 14% 100%
2006 100% 100%
Source: Staff calculations using School to Work Transition data collected in 2007. Retrospective data collected from 1,026 youth (15-25 years) who had completed schooling in the 5 years preceding the survey. Above tabulations are based on 570 respondents who reported ever being unemployed. Sample weights applied.
National averages mask considerable district level variation in labor market outcomes; female labor force participation rates are high in districts with employment opportunities for women (such as estates). Since the LFS is representative at the district level, Table 9 below reports key labor market outcomes for 17 districts (excluding North and East provinces). For women, labor force participation rates and employment to population ratios are the highest in Nuwara Eliya and Badulla districts, which have plantation estates. These are also the districts with the lowest unemployment rates for women; Kandy, Galle and Hambantota have the highest rates of female unemployment with close to 1 in 5 working woman unemployed. Among men, there is less of a regional variation; Kandy, Galle, Matara and, Kegalle have among the lowest male employment to population ratios at about 70 percent. Kandy and Matara also have the highest male unemployment rates of close to 10 percent.
16
Table 9: District level labor force participation, unemployment, and employment to population ratio, 2009
Women Men
District
Labor force
participation Unemployed
Employment to population ratio
Labor force
participation Unemployed
Employmen t to population ratio
Western – Colombo 37% 8% 34% 80% 6% 75%
Western – Gampaha 35% 11% 31% 80% 6% 75%
Western – Kalutara 37% 10% 34% 77% 4% 74%
Central-Kandy 38% 23% 30% 77% 10% 69%
Central-Matale 47% 17% 39% 86% 5% 82%
Central-Nuwara Eliya 55% 4% 53% 80% 2% 78%
Southern – Galle 44% 22% 34% 78% 7% 72%
Southern – Matara 44% 18% 36% 83% 12% 73%
Southern - Hambantota 47% 23% 36% 86% 9% 79%
N.W. – Kurunegala 45% 15% 38% 83% 6% 78%
N. W. – Puttalam 39% 19% 31% 83% 4% 80%
North Central-Anuradhapura 56% 12% 50% 85% 4% 81%
North Central- Polonnaruwa 44% 18% 36% 85% 7% 80%
Uva – Badulla 57% 8% 52% 84% 5% 80%
Uva – Moneragala 54% 17% 45% 86% 3% 84%
Sab. – Ratnapura 51% 13% 44% 84% 7% 79%
Sab. – Kegalle 42% 10% 38% 79% 7% 73%
Source: Staff calculations using LFS data. Weighted. Working age population refers to those aged 15-64. Unemployment rate is calculated only for those in the labor force.
What are the determinants of labor force participation and probability of being unemployed?
The empirical patterns present two puzzles. First, low female labor force participation rates persist in Sri Lanka despite low fertility rates and high female schooling. Second, the unemployment rate remains high for women and youth. Both these puzzles are analyzed below using regression estimates reported in Table A2.1 (see Annex 2 for a discussion of the empirical models).
For the first puzzle, with more education and fewer children, economic theory predicts that women will allocate more of their time to the labor market than to home activities. The reduced time needed for childrearing and having more education increases the opportunity cost of not working. However, empirical analysis from a number of studies suggests that this relationship between education, fertility and female labor force participation is complex. In fact, married women’s labor force participation tends to follow a U-shape with respect to economic development. The U-shape is probably driven by the changing nature of work opportunities for women and men that come with economic development. In poor countries, female labor force
17
participation is high and women work mainly in farm or non-farm family enterprises. With development, and a rise in men’s market opportunities, women move out of the labor force, but as development progresses and women’s education levels increase, they move back into the labor force employed mainly in white collar jobs (Goldin (1994); Mamen and Paxson (2000)).
Women’s labor force participation appears to be responsive to education only beyond certain levels of education. Mammen and Paxson’s (2000) analysis of household survey data from India and Thailand shows that female labor force participation is not very responsive to female education; the largest impact on female labor force participation arises at post-secondary levels of education. Similarly, Lam and Duryea (1999) show that in Brazil during the 1970s and 1980s, while female schooling significantly reduced fertility, female schooling was not strongly associated with female labor force participation rates. Showing that female schooling significantly improved child survival, Lam and Duryea (1999) conclude that in Brazil during this period better educated mothers allocated time to looking after children rather than labor market work.
Empirically, it is difficult to distinguish women who stay out of the labor force involuntarily because of child care responsibilities from those who choose not to work because they prefer to allocate their time to home work. This choice driven selection by married women into (or out of) work makes it difficult to identify the causal impact of fertility on women’s labor force participation. Cross country correlations show a negative correlation between female labor force participation and fertility rates. However, a number of studies have also found that the correlation between female labor force participation and fertility across OECD countries became positive in the 1980s, suggesting that low fertility coexists with low female labor force participation because of reasons such as availability of child care (Engelhardt and Prskawetz 2002). Using various econometric techniques to estimate the causal impact of fertility on female labor force participation, studies have found both the expected negative impact (for example, (Angrist and Evans 1998), (Rosenzweig and Wolpin 1980), (Chun and Oh 2002)), and no impact (for example, (Agüero and Marks 2008)).
Another factor discouraging women’s participation in the labor force is wage gaps and discrimination in labor market which could persuade some women to stay at home. Several studies of the Sri Lankan labor market find that even after adjusting for differences in characteristics such as schooling and experience, gender wage gaps remain significant. The portion of the wage gap that is unexplained by observable characteristics of workers can be interpreted as an indicator of labor market discrimination against women. A study of data from 1999-2000 found that more than 95 percent of the gender wage gap could not be explained by characteristics of the workers.5 Sections to follow discuss gender wage differential in more detail.
5Ajwad and Kurukulasuriya (2002) cited in (World Bank 2006b).
18
Table A2.1 reports determinants of labor force participation using LFS data from 2006-2009.
Controlling for relevant individual and household characteristics, the results show that men are 47 percent more likely than women to participate in the labor force (column 1). Female labor force participation has a U-shape with respect to education – completing O levels and A levels (secondary) significantly reduces the probability of participation while university education increases probability of participation by 20 percent (column 2). This U-shape is similar to the one usually found in cross-country comparisons and suggests that women with low education (less than O levels) and tertiary education (university) are engaged in different types of jobs. For men, however, labor force participation steadily increases with education (column 3).
Household responsibilities appear to play an important role in reducing female labor force participation but not male labor force participation. Marriage is associated with 16 percent reduction in the probability of female labor force participation. More interestingly, presence of children is associated with significant reduction in female labor force participation, but has no impact on male labor force participation. An increase in the share of young children (under age 5) in the household reduces the probability of female labor force participation by 36 percent. The share of elderly household members (aged 65+) in the household is associated with a small reduction in labor force participation for both women and men but the estimate is statistically significant only for men. Overall, the regression results show that childrearing responsibilities are associated with significantly reduced female labor force participation; this negative association is large enough to swamp (or reinforce) the (negative) impact of education on women’s market work. This suggests that any policy measure aimed at increasing female labor force participation would have to address women’s family care responsibilities.
The second empirical puzzle of a persistently high unemployment rate in Sri Lanka has received a lot of research attention.6 During the 1980s and 1990s, large youth cohorts were seen as a reason for the high unemployment rates, so the government introduced a number of policies and programs to address this issue. However, as previous sections have shown, the share of youth in the working age population has declined over time, and this should have reduced unemployment rates. In fact, high unemployment among women and youth is common across developing countries ( (ILO 2010), also see discussion in (World Bank 2006a)). Analyzing household survey data from 60 developing countries, Fares, Montenegro and Orazem (2006) find that it takes school leavers 1.4 years on average to find stable and permanent employment; the intervening months are spent in temporary work and unemployment.
Rama (2003) analyzes three commonly proposed reasons for this high unemployment in Sri Lanka – unrealistic expectations or mismatch between jobs available what workers are qualified to do, preference for public sector jobs (queuing), and labor market regulations (mainly TEWA) that create a wedge between “good” and “bad” private sector jobs. Rama’s analysis of expected earnings reported by the unemployed in the 1995 LFS finds no support for the unrealistic expectations explanation – schooling is not strongly correlated with expected earnings. He analyzes the impact of segregation of jobs into “good jobs – bad jobs” by estimating wage premiums associated with public sector employment and TEWA protected private sector jobs (proxied by reported length of worker’s tenure). Results show a large premium associated with
6See for example, Arunatilake and Jayawardena (2010a).
19
public sector employment but not with employment in TEWA regulated jobs.7 Arunatilake and Jayawardena (2010a) examine data from Jobsnet, set up under the National Employment Policy of Sri Lanka with the aim of matching job vacancies with registered job seekers. Among those who register with Jobsnet, Arunatilake and Jayawardena (2010a) find evidence of a skills mismatch; most of the registered job seekers were educated and searching for white-collar jobs, while most of the available job openings were for elementary occupations.
Table A2.1 (columns 4, 5 and 6) reports determinants of probability of being unemployed using LFS data from 2006-2009. Controlling for individual and household characteristics, men are significantly less likely than women to be unemployed and probability of unemployment also decreases significantly with age. Notably, the probability of being unemployed increases steadily with education, and these effects are large for women with university degrees, who are associated with an 11 percent increase in the probability of being unemployed. A university degree raises men’s probability of being unemployed by only 3 percent. Family support also increases the probability of being unemployed, since children of household heads are significantly more likely to be unemployed.
Another striking result is the impact of the presence of young children in the household. The share of young children significantly increases the probability of female unemployment, but reduces the probability of male unemployment. For women, the result is consistent with queuing for public sector jobs or formal sector jobs because of non-wage benefits such as family benefits – the larger the share of young children in the household the more attractive such “good” jobs would be to women. This finding is also consistent with the deterrent impact of share of young children on female labor force participation. For men, in contrast, the presence of young children could have the opposite impact, increasing the pressure to get a job to support the family.
Like previous studies, evidence from 2006-2009 also suggests queuing for public sector jobs as a likely reason for persistently high unemployment rates. Earnings regression reported in Table A2.4 show that men and women in the public sector enjoy a large wage premium. For women, the premium is close to 52 percent; while for men, the premium is about 32 percent (section on earnings analyzes this wage premium in more detail). Consistent with these large premiums, when LFS 2009 asked the unemployed their expectations for a job, 41 percent of women and only 24 percent of men reported that they expected to get a job in the public sector. The remaining 50 percent of unemployed men and 44 percent of unemployed women reported expecting a job in any sector (public, semi-government or private).
Analysis of expected earnings reported by the unemployed support the public sector queuing and the associated higher earnings explanation for high unemployment. An analysis of the expected earnings reported by the unemployed is shown in Table A2.6. The regression results show that expected earnings increases significantly with education levels, particularly for women. An extra year of education is associated with an 8 percent increase in expected earnings for women and about a 5 percent increase for men.
7 Rama (2003) uses length of tenure as proxy for TEWA jobs so any conclusions regarding wage premiums associated with TEWA jobs should be made with caution because the effect of this proxy could simply reflect returns to tenure.