IHS Economics Series Working Paper 167
February 2005
Crime and Prices
Konstantin Gluschenko
Impressum Author(s):
Konstantin Gluschenko Title:
Crime and Prices ISSN: Unspecified
2005 Institut für Höhere Studien - Institute for Advanced Studies (IHS) Josefstädter Straße 39, A-1080 Wien
E-Mail: o ce@ihs.ac.atffi Web: ww w .ihs.ac. a t
All IHS Working Papers are available online: http://irihs. ihs. ac.at/view/ihs_series/
This paper is available for download without charge at:
https://irihs.ihs.ac.at/id/eprint/1614/
167 Reihe Ökonomie Economics Series
Crime and Prices
Konstantin Gluschenko
167 Reihe Ökonomie Economics Series
Crime and Prices
Konstantin Gluschenko February 2005
Institut für Höhere Studien (IHS), Wien
Institute for Advanced Studies, Vienna
Contact:
Konstantin Gluschenko
Institute of Economics and Industrial Engineering Siberian Branch of the Russian Academy of Sciences pr. Laventieva 17
630090 Novosibirsk, RUSSIA : +7(3832)302548 fax: +7(3832)302580 email: glu@nsu.ru
Founded in 1963 by two prominent Austrians living in exile – the sociologist Paul F. Lazarsfeld and the economist Oskar Morgenstern – with the financial support from the Ford Foundation, the Austrian Federal Ministry of Education and the City of Vienna, the Institute for Advanced Studies (IHS) is the first institution for postgraduate education and research in economics and the social sciences in Austria.
The Economics Series presents research done at the Department of Economics and Finance and aims to share “work in progress” in a timely way before formal publication. As usual, authors bear full responsibility for the content of their contributions.
Das Institut für Höhere Studien (IHS) wurde im Jahr 1963 von zwei prominenten Exilösterreichern – dem Soziologen Paul F. Lazarsfeld und dem Ökonomen Oskar Morgenstern – mit Hilfe der Ford- Stiftung, des Österreichischen Bundesministeriums für Unterricht und der Stadt Wien gegründet und ist somit die erste nachuniversitäre Lehr- und Forschungsstätte für die Sozial- und Wirtschafts- wissenschaften in Österreich. Die Reihe Ökonomie bietet Einblick in die Forschungsarbeit der Abteilung für Ökonomie und Finanzwirtschaft und verfolgt das Ziel, abteilungsinterne Diskussionsbeiträge einer breiteren fachinternen Öffentlichkeit zugänglich zu machen. Die inhaltliche Verantwortung für die veröffentlichten Beiträge liegt bei den Autoren und Autorinnen.
Abstract
The impact of organized crime on inter-regional price disparities in Russia is estimated for each year from 1992 to 2000, and over the panel of 1993-2000, using a sample of 70 Russian regions, and that of 50 regions from the European part of the country. The relationship between prices and crime is, for the most part, statistically significant and positive. Organized crime considerably contributes to the average cross-region price dispersion. However, the effect of organized crime has been diminishing over time.
Keywords
Organized crime, price dispersion, market integration, Russia, Russian regions
JEL Classification
K49, P22, P37, R19
Comments
This work was supported by the Economic Education and Research Consortium (EERC), grant No. 99–313. The author is grateful to Eric Berglöf, Daniel Berkowitz, John Earle, and Mark Schaffer for helpful discussions and comments. Thanks also to David Brown for generously providing some data.
Contents
1. Introduction 1
2. Methodology of the Analysis 2 3. The Impact of Organized Crime on Prices: Underlying
Mechanism 5
4. Data 8
5. Empirical Results 10
6. Conclusions 16
References 17
1. INTRODUCTION
The extensiveness of organized crime in Russia gave rise to a wave of studies dealing with the economic facet of this phenomenon. Suffice it to say that even specialized abstracting journal The Economic Theory of Crimes and Punishments is published in the country.
However, papers quantitatively estimating impact of organized crime on specific aspects of the economic reality are very few in number. Such a problem is just the subject of this paper.
Basing on empirical information (drawn from both the official statistics and different sources), it statistically estimates the importance of organized criminal activity in dispersion of prices for consumer goods across Russian regions.
A cross-sectional relationship between price dispersion and demand dispersion (transformed to per capita income dispersion) across regions of the country, which measures the degree of goods market segmentation, is used for the analysis. Augmenting it for additional variables representing various market frictions, organized crime among them, roles played by these frictions can be assessed. Two variables proxy organized crime: the crime rate and the economic power of crime. Regressions are run for each year from 1992 through 2000 and over the whole panel of 1993-2000; the spatial sample covers 70 (of all the 89) regions of Russia.
Organized crime is found to be an important market friction, substantially contributing to cross-region price dispersion. Taking the period of 1993-2000 as a whole, it is responsible for about 10% of the total price dispersion, and for roughly 30% of that excluding the geographically determined part of the dispersion. In the European part of Russia, the impact of organized crime is less pronounced as compared to Russia as a whole. Across years, the effect of organized crime becomes stronger during the early years of the transition, peaking in 1994-1995, and then it is weakening.
As mentioned above, the literature on economic aspects of organized crime in Russia is voluminous. To name a few, Volkov (1999) considers organized violence as a kind of business, calling it the “force business;” Kiva (1999) qualitatively assesses the extent of organized criminal activity, aiming to answer the question as to whether the “criminal revolution” in Russia is myth or reality; and Radayev (1998) documents some data on costs related to organized crime, basing on sociological surveys. Leitzel (2002) discusses Russian organized crime, along with corruption, in terms of costs and benefits; Lotspeich (1997)
1
performs an analysis of extortion in Russia, finding that a large proportion of new private enterprises pay extortion fees; and Brown and Earle (2000) econometrically analyze a relationship between firm performance and, among other variables, organized crime. (The findings in the latter paper are discussed in Section 5.) This paper contributes to the above literature, giving – in quantitative terms – an idea of the role played by organized crime in Russia’s market segmentation.
The rest of the paper is organized as follows. The next section presents a theoretical and econometrical framework for the analysis. In Section 3, ways in which organized crime affects consumer prices are discussed, providing a conceptual framework for interpretation of statistical results. Section 4 describes the data used. Empirical results are presented in Section 5, and Section 6 contains brief conclusions.
2. METHODOLOGY OF THE ANALYSIS
The statistical analysis in this paper is based on the following theoretical considerations.
1A national market for consumer goods is regarded as a set of regional markets (for simplicity sake, the regions can be represented by their capital cities).
Integration, or connectedness, of such a geographically dispersed market is determined by freedom of the goods movement between regions.
One extreme case is perfectly integrated market, in which absolutely free inter-regional movement of goods inheres. In other words, a bargain of purchase and sale of a given good between market agents from the same region or from two different regions needs equal costs.
Then the spatial dispersion of the market loses its importance; the market operates like a single whole, being in essence a complete analog of the “point” perfectly competitive market.
With this, the equal price of the good is fixed throughout the market, depending on overall demand in the national market, while demand in any individual region does not affect the local price.
A mechanism maintaining spatial equilibrium is inter-regional goods arbitrage, that is, simultaneously buying a good in regions where it is cheaper while selling in those with higher prices. (Since the static case is considered, arbitrage is assumed immediate.) Assume that incomes in some region have increased, so causing an increase in demand for the good and, in
1
See Gluschenko (2003, 2004) for more detailed discussion and substantiations of the approach applied.
2
turn, a rise in its price. The opportunity to gain a profit from the difference in prices begets arbitrage transactions. The inflow of the good to the region from other regions, which is caused by these transactions, increases supply, thus reducing the price here, while the outflow of the good from those regions raises the price there. As the results of this process, the price of the good equalizes again across regions. (This simple reasoning just substantiates the law of one price.) Moreover, if the change in the quantity demanded in the region is negligibly small compared with the national total quantity (which does usually happen in practice), the price equalization occurs without a change in the overall price level. To put it differently, in the perfectly integrated market, the supply curve as seen by an individual region is perfectly elastic; whence the lack of dependence of the regional price on local demand becomes obvious.
It is reasonable to define arbitrage transaction costs as the difference between costs needed for a bargain between market agents from two different regions and these costs when the agents are from the same region. Under such a definition, arbitrage transaction costs are absent in the perfectly integrated market.
Another extreme case is perfectly non-integrated market, entirely lacking possibilities for inter-regional trade. It is simply a collection of isolated, autarchic regional markets. The price for the good in each region is entirely determined by a balance of local supply and local demand. In terms of arbitrage transaction costs, this implies that, for each region pair, they exceed any possible difference in prices for the good in the regions from the pair. (Formally, arbitrage costs are infinite in such a market, in contrast to zero costs in the case of perfect integration.)
In actuality an intermediate case takes place, which is a limited, to one degree or another, freedom of inter-regional trade. The spatial dispersion itself of the market is an impediment to absolute freedom of the goods movement, generating a need for long-distance transportation of goods. In that case arbitrage transaction costs are finite; their value depends on what specific regions are involved in arbitrage, i.e., each region pair has this costs of its own. Arbitrage is not able to fully equalize the price for the good in such a market; it can reduce inter-regional differences in the price only to arbitrage costs. Hence it follows that although the price for the good is not entirely determined by local demand, it can depend to some extent on the local demand. The magnitude of this dependence can be used as a measure of the degree of market integration: the weaker the dependence, the stronger the integration.
3
However, the trouble is that sufficiently representative data on quantities demanded are lacking. Therefore a more available indicator is needed for empirical analysis. Let P
rbe the price of some good in region r, and I
rbe the per capita personal income in this region. The market equilibrium condition
D(P
r, I
r) – S(P
r) = 0, (1)
where D(⋅) is the demand function, and S(⋅) is the supply function, makes possible to express the price as a function of the per capita income, getting rid of the quantity demanded. Let the difference in prices between regions r and s be measured by logarithm of the ratio of retail prices for the good in these regions, P
rs= ln(P
r/P
s), and the difference in demand be measured by I
rs= ln(I
r/I
s). Then, under some additional assumptions, the above dependence can be represented as the following econometric model (for convenience, the region indexes are assumed to be arranged such that all P
rsare non-negative):
P
rs= βI
rs+ ε
rs. (2)
Here, β is the coefficient to be estimated, which is the elasticity of inter-regional price dispersion vis-à-vis income dispersion, and ε
rsis the regression residual. The magnitude of β just characterizes the degree of market integration, measuring a deviation from the state of perfect integration, in which β = 0.
On the other hand, price difference P
rsis equal to arbitrage transaction costs or more specifically, to C
rs= ln(1 + c
rs), where c
rsis arbitrage transaction costs – per unit of the good – expressed as a percentage of its price. Lacking knowledge of them, we just observe a dependence of price dispersion on income dispersion. But provided that some components of arbitrage costs are quantifiable, augmenting the right-hand side of (2) for them would reduce this dependence; and if it were possible to cover all the components, it would vanish at all.
Thus, an augmented version of model (2) is arrived at, which enables the contribution of various market frictions to inter-regional price dispersion to be estimated:
P
rs= β
*I
rs+ ∑ δ
k
k
X
krs+ ε
rs, (3)
where k indexes market frictions (supposedly) affecting price dispersion, X
krsis a variable that quantitatively describes k-th friction for region pair (r, s), and δ
kare coefficients to be estimated that reflect the degrees of the friction impacts on price dispersion.
The value of β
*measures the integral impact of unidentified market frictions. It is obvious that β
*< β; however, it is unlikely that with β > 0 we will get β
*= 0, since, in
4
practice, the set of variables X
krscertainly could not cover all impediments to inter-regional trade (e.g., despite a great deal of effort, I failed in collecting more or less complete information on administrative barriers aiming to restrict exportation of some goods from a region or importation them to it, that took place from time to time in various regions of Russia).
Dealing with ready cash, trade in consumer goods is a very attractive field for criminal groups. Therefore one might expect their activity in this field to markedly affect final, retail prices. In such an event, the difference in prices between regions will depend on the difference in scope of this activity in the given regions. Inserting relevant indicators into the set of variables X
krs, the question as to how strong the effect of organized crime is (and whether it occurs at all) can be answered. To obtain a conceptual framework for interpreting the empirical results, let us discuss in outline in what way organized crime can affect goods prices in regions.
3. THE IMPACT OF ORGANIZED CRIME ON PRICES: UNDERLYING MECHANISM
Publications in the Russian press during the years of transition provide countless examples of criminal activity affecting the realm of retail and wholesale trade. Generalizing, a number of lines of such an activity may be recognized that eventually impact sales prices.
Classified by their economic consequences, these are pooled to the following clusters (for brevity, only a sketchy description is presented).
The first one includes racketeering retail and wholesale traders, or, as Berkowitz et al.
(1998) elegantly write, collecting “extortion rent.” Highway robberies as well as “tribute” for transporting goods along some section of a highway or/and for entry to a city also fall into this cluster.
2The economic consequence is an increase in the costs of inter- and intramarket trade (which is shifted to final prices). According to Radayev (1998), payoff to a criminal group for “protection” against other groups and individual racketeers – for so called krysha (“roof”) – can total 10-15% of a businessman’s income, but this may be more expensive, up to 1/3. On the other hand, prevention of racketeering raises costs as well because of expenditures for protection and securing one’s business.
2
However, such a “tribute” may be sometimes extorted, vice versa, by (corrupted) police; see Kakturskaya and Krashkov (2002).
5
Aiming to maintain their “extortion rent”, criminal groups block commodity inflows from locations with lower prices. For example, the fact is well-known that Moscow “mafia”
did not let trucks with vegetables and fruits from southern regions in the city; see, e.g., Effron (1994). This cluster also involves forcing those traders who have brought goods to the city to sell these goods to criminal group (or to its “under-wardships”) at knock-down price; the goods are then sold in local markets at much higher prices. The economic consequence is restriction of arbitrage.
To maintain “extortion rent”, criminal groups also force traders not to lower prices below a “prescribed” floor. In some cases, traders themselves order such actions, thus preventing their competitors from undercutting their prices. The economic consequence is the restriction of intra-market price competition.
The fourth cluster relates to goods which come in very large lots. There is information that wholesale trade in gasoline (and, maybe, in sugar) is controlled by organized crime in some cities. “Shadow” monopoly (if virtual control belongs to one criminal group) or cartel collusion (if there are a few groups) enables prices for a good in a city to be synchronously raised, at the same time blocking the supply of this good through other channels. One more realm of machinations here is food purchases by local (regional) administrations at overstated prices. Such actions are carried out by corrupted officials in “co-operation” with criminal groups (most often, this concerns grain, large lots of which promise huge profits; clearly this results in high prices for the final goods produced of it, e.g., bread). The economic significance of this cluster is withdrawal – usually, with surplus – of the intermarket price difference; the consequence is a rise in local prices (which is not eliminated by arbitrage).
Hence organized crime objectively counteracts the integration of the Russian consumer market by both creating direct barriers to arbitrage and increasing arbitrage transaction costs, thus hindering the convergence of prices across regions. Therefore it should be expected that the higher the organized crime rate is in a region, the higher are prices there.
It needs to be noted, however, that there is one more cluster of criminal activity, the potential economic consequence of which has the opposite effect, that is, it facilitates competition and reduces prices. The case in hand is the illegal production of (surrogate) vodka and contraband import. To what extent might this change the above conclusion?
6
When fake vodka is produced on a large scale, it is delivered through legal channels.
3Once entering into the trade network, this vodka is then distributed as any ordinary (legal) good, including to other regions as well (e.g., it is known that “Absolut” vodka was not exported to Russia during a few years, nevertheless, it – clearly, fake – was sold all over the country).
4In former times, illegal vodka was sold in retail trade at noticeably lower prices than the legal one. However, in the recent years, after control over the circulation of alcoholic products has been toughened, licensing for trade in alcohol has been introduced, and selling of vodka in kiosks has been prohibited, fake vodka is sold at the same prices as genuine vodka (in order not to attract the attention of law-enforcement and controlling bodies), and price competition with legal producers occurs almost only on the wholesale level. In the case that illegal vodka is supplied by a producer (or by his middleman) directly to shops, the producer is interested not in increasing the quantity of sales in each shop due to lower retail prices but in entering additional retail enterprises since this provides a much higher rise in revenue.
Nor do such shops have the stimuli for price competition as gains from an increase in sales is incomparably (by orders of value) less than the profit itself from substituting genuine vodka for fake vodka. It is not inconceivable that one criminal group supplies illegal vodka to a shop, while the “roof” is provided by another group. However, even though such shops have some “privileges” from organized crime, other shops selling genuine vodka (or even fake vodka, but delivered through legal channels so that a shop might be in ignorance of its origin) can experience the above-described criminal pressure. Hence the impact of organized crime on prices may be oppositely directed. Albeit the eventual “resultant” cannot be a priory determined, it is felt that, most probably, the increase in prices is more than considerable.
5Contraband import should reduce prices. But it is hardly probable that this effect could be localized on the level of a single region. For example, favorable substances of contraband in Russia are cigarettes (until 1999), alcoholic beverages, and consumer electronics. However, these goods are imported illegally in giant lots, and so, the goods are distributed throughout
3
Underground trade in surrogate vodka (at very low prices) belongs predominantly to the realm of “gray economy” rather than to that of organized crime. Usually this takes place in the situation in which elementary small-scale production is organized by individuals or small groups of “underground businessmen.”
4
Because of this, the repeat certification of alcoholic beverages, which is established in some regions, not only has protectionist aims but also seeks to keep fake vodka (both imported from other regions and domestically produced) from entering the market.
5
It should be mentioned that the “positive” role of organized crime may escape the official statistics. For the statistical observation of the prices for vodka, 6 representatives are used: home vodka of ordinary quality (such as “Russkaya” and “Moskovskaya”), that of higher quality (such as “Posol’skaya” and “Pshenichnaya”), and imported vodka (such as “Finlandia” and “Absolut”). If fake vodka bears a different brand, a price registration misses it (not to mention underground sales).
7
the country. Even if the lots are relatively small, their size, nevertheless, is usually too large for a single city (region), and the contraband goods are distributed throughout a number of neighboring regions. For example, contraband of mass consumption goods from China is monopolized in Novosibirsk by a criminal group. But Novosibirsk merely serves as a large terminal station for these goods which are then delivered to other Siberian regions (Tomilina, 2000). Most likely, contraband facilitates the reduction of prices on the level of the whole country rather than on that of single regions.
Thus, the sign of coefficient δ
kon variables representing organized crime should be expected to be positive.
4. DATA
Since complete data needed for the analysis are not available for all the 89 regions of Russia, the analysis covers 70 regions. The omitted regions are as follows: all the 10 autonomous okrugs, the republics of Adygeya, Dagestan, Ingushetia, and the Chechen Republic, the Volgograd and Murmansk oblasts, and the Jewish Autonomous Oblast, as well as the Moscow and Leningrad oblasts (while the cities of Moscow and Saint Petersburg are presented in the sample). Besides estimations over this sample (hereafter referred to as
“Russia as a whole”) yielding 2,415 region pairs, they are run also over the European part of Russia. The latter sample covers 50 regions which yield 1,225 pairwise observations. The period under consideration spans 1992 through 2000.
In this paper, the cost of the basket of 25 basic food goods is used as a price representative.
6The monthly data on the cost of the basket from February 1992 through December 2000 in capital cities of the regions were obtained directly from the Russian statistical agency, Goskomstat. (The costs for 1992-1996 were computed retrospectively by it;
although a new basket was defined for statistical publications since June 2000, the cost of the previous one was still computed till the end of 2000.) The relative costs of the 25-item basket, P
r/P
s, were computed for each region pair from the raw data; then their geometric means were computed over each year (for 1992, over its 11 months). As the ratios of prices are averaged, and not their absolute values, this averaging is reasonable even for years with high inflation.
Variable I
rsis computed in the same manner with the use of monthly incomes per capita
6
Goskomstat (1996) reports the composition of the basket.
8
drawn from monthly statistical bulletins “Socio-Economic Situation of Russia”. It is known that the official statistics data on absolute values of the population incomes are not reliable enough. Nonetheless, as found in the course of this study, the inter-regional ratios of incomes are rather close to truth. This follows from comparisons of these with inter-regional ratios of a number of other indexes which are concerned – to some or other degree – with money incomes (population’s expenditures, paid-up wages, volumes of retail sales, etc.). Probably, the percentage errors of the statistical measurement of incomes do not differ too much across regions.
The following additional variables characterizing various forces that influence goods market integration are used: distances between capital cities of regions (as a proxy of transportation costs), difficult access to a region (a dummy equaling 1 for the Magadan, Kamchatka, and Sakhalin oblasts and the Republic of Yakutia, and 0 for other regions), distribution costs in retail trade, quality of regional transport infrastructure, index of regional freight tariff, price regulations in regions, and subsidizing local producers. For more detailed description of these variables with references to the data sources, see Gluschenko (2004).
To quantify the extent of the organized crime activity, two indirect proxies are used.
The first is the total crime rate, i.e., the number of registered crimes per 100,000 of the population in a given year according to the official data from Goskomstat (2001, vol. 2, p.
270-271). The value of the variable for a region pair is computed as the logarithm of the ratio of indicators for the regions belonging to the pair.
The second proxy characterizes the economic power of organized crime, measuring it as the proportion of the regional economy controlled by criminal groups in 1995/1996. This indicator was evaluated by analysts of Arguments and Facts weekly (Kakotkin, 1996) on the basis of data obtained from a scientific conference on the shadow economy, the Free Economic Society, and the Russian Ministry of Internal Affairs. Since the values of this indicator are available only for one point in time, they are assumed equal throughout the period under consideration. Such an assumption, probably, is close to truth in the neighborhood of 1995/1996, the years for which the values are estimated. But clearly, far from these years, this extrapolation might turn out to be rather crude. Following Brown and Earle (2000), the value of the economic power of crime is taken to equal 1 (very high) if criminal groups control more than 50% of the economy, 0.75 (high) if they control 35%
to 50%, 0.5 (medium) if they control 20% to 35%, and 0.25 (low) if they control less than
9
20%. The value of the variable for a region pair is computed as the difference of these values for the regions belonging to the pair.
Correlation between the two measures of organized crime is weak. The correlation coefficients by year are reported in Table 1.
Table 1. Correlation between the crime rate and the economic power of crime
Year Russia as a whole European part of Russia
1992 0.114 0.061
1993 0.136 0.053
1994 0.168 0.025
1995 0.116 -0.069
1996 0.190 0.148
1997 0.097 -0.037
1998 0.090 -0.070
1999 0.077 -0.047
2000 0.034 -0.088
The correlation has signs varying across years; it peaks in 1996, the year for which the economic power of crime has been evaluated. Table 1 suggests that theses two proxies of organized crime are far from being similar versions of each other. Supposedly, they reflect two different dimensions of organized crime (but both being merely a rough approximation).
The activity of criminal groups in legal business qualitatively differs from that of ordinary gangs; when occurring here, crimes as such are much more latent since they are mainly of economic nature. And so, it does not seem that more economic power of crime in a region would necessarily increase the total number of crimes. Based upon this, both variables are contemporaneously included into regression (3).
5. EMPIRICAL RESULTS
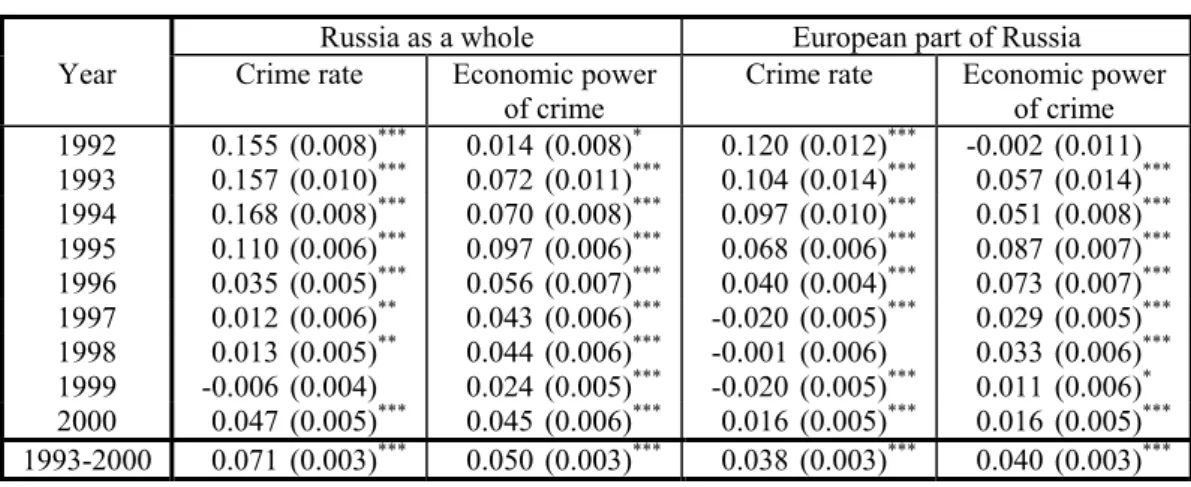
The results of estimating regression (3) by year and for the whole panel of 1993-2000 are presented in Table 2.
7As the complete set of estimates is rather cumbersome, only estimates of coefficients δ
kon the organized crime variables are reported. In the table, the White heteroscedasticity-consistent standard errors are in parentheses; ***, ** and * denote statistical significance of an estimate at the 1%, 5% and 10% levels correspondingly (the absence of the asterisks implying insignificance). Lacking some data on distribution costs for
7
The OLS model with panel corrected standard errors (PCSE) is used for the panel estimation.
10
1992, this year is excluded from the panel. The yearly estimates for 1992 are obtained without account of distribution costs, so being somehow distorted (however, experimenting with regressions for other years evidences that inclusion/exclusion of this variable has a minor effect on the estimates of the coefficients on the organized crime variables).
Table 2. Estimates of impact of organized crime on price dispersion
Russia as a whole European part of Russia Year Crime rate Economic power
of crime Crime rate Economic power of crime 1992 0.155 (0.008)
***0.014 (0.008)
*0.120 (0.012)
***-0.002 (0.011) 1993 0.157 (0.010)
***0.072 (0.011)
***0.104 (0.014)
***0.057 (0.014)
***1994 0.168 (0.008)
***0.070 (0.008)
***0.097 (0.010)
***0.051 (0.008)
***1995 0.110 (0.006)
***0.097 (0.006)
***0.068 (0.006)
***0.087 (0.007)
***1996 0.035 (0.005)
***0.056 (0.007)
***0.040 (0.004)
***0.073 (0.007)
***1997 0.012 (0.006)
**0.043 (0.006)
***-0.020 (0.005)
***0.029 (0.005)
***1998 0.013 (0.005)
**0.044 (0.006)
***-0.001 (0.006) 0.033 (0.006)
***1999 -0.006 (0.004) 0.024 (0.005)
***-0.020 (0.005)
***0.011 (0.006)
*2000 0.047 (0.005)
***0.045 (0.006)
***0.016 (0.005)
***0.016 (0.005)
***1993-2000 0.071 (0.003)
***0.050 (0.003)
***0.038 (0.003)
***0.040 (0.003)
***But for two cases, significant estimates have expected positive sign, so suggesting that the activity of organized crime does cause inter-regional price dispersion to increase. Only three estimates turn out insignificant, of which two for the crime rate, and one for the economic power of crime. As a rule, both organized crime variables are significant concurrently, and there is no one case when both variables are insignificant. This supports the above stated assumption that these proxies describe two different dimensions of organized crime.
The coefficient on the crime rate variable is the elasticity of price vis-à-vis crime rate.
Thus, over 1993-2000 as a whole, the rise in the crime rate by 10% resulted in the rise in prices in a region by circa 0.7% over Russia as a whole. The maximum is in 1994, equaling about 1.7%. Over the European part of Russia, this value is equal to 0.4%, peaking at 1.2% in 1992. All this is valid for region pairs as well, but concerning the rise in the price difference between two regions with the increase in the difference in the crime rate.
In general, the coefficient on the variable of the economic power of organized crime is elasticity as well. But the variable itself takes on discrete values, so leading us to the following interpretation: an increase in the economic power of crime by one level (e.g., from low to medium) caused a rise in prices by circa 1.3% for the country as a whole, and by 1%
11
for the European part of Russia, taking the entire period of 1993-2000. By year (but for 1992), this value varies from 0.6% to 2.5% in the first sample, and from 0.3% to 2.2% in the second one. In both samples, the peaks occurred in 1995. The interpretation for region pairs is similar to that in the above paragraph.
Thus, the estimates obtained suggest that the impact of organized crime on the increase in inter-regional price dispersion is somehow weaker in the European part of Russia than in the country as a whole.
Regarding dynamics, Table 1 evidences that there is certain regularity. Namely, the impact of organized crime on inter-regional price dispersion becomes stronger during the early years of market transformations, peaking in 1994-1995, and then it is weakening. To estimate the general direction and speed of these changes, the coefficients on variables describing organized crime were represented in a dynamic form as δ
k= δ
k0+ δ
k1t (where t is a year relatively 1993) and estimated over the panel of 1993-2000. Table 3 summarizes the results (standard errors are reported in parentheses below the estimates); all estimates are significant at the 1% level.
Table 3. Trends of the impact of organized crime on price dispersion
Variable Russia as a whole European part of Russia Crime rate 0.193 – 0.036t
(0.004) (0.001) 0.149 – 0.030t (0.005) (0.001) Economic power of
crime 0.116 – 0.018t
(0.004) (0.001) 0.077 – 0.012t (0.005) (0.001)
In all instances, the trend factor is negative, so suggesting that the prevailing trend in the period in question is weakening of the organized crime effect. The speed of this process is rather high: the starting values of δ
kdiminish roughly by 20% a year, the speed for Russia as a whole and for the European part being practically the same in percentage terms.
Prima facie, such a finding seems rather surprising: the reality does not provide evidence in favor of a reduction of organized crime activity in Russia. But it does not actually claim this; it merely suggests a decrease in economic impact of organized crime on the consumer market (in particular, narrowing the scope of gaining “extortion rent”). Indeed, there are a number of corroborations of such a feature in the evolution of crime in Russia. For example, analyzing data of sociological surveys, Radayev (1998) finds a similar trend,
12
namely, narrowing the “realm of organized violence” in the Russian business (including, of course, that concerned with trade in consumer goods). He suggests the following reasons for this: the ending of the era of “fast money”, the division of spheres of influence, strengthening care (of crime and business which uses its “services”) for own security, the shift of crime to
“white” and “gray” market segments.
8This does not mean that organized crime steps back; it just transforms itself, that is, the opposition of crime and business is changing to the interosculation.
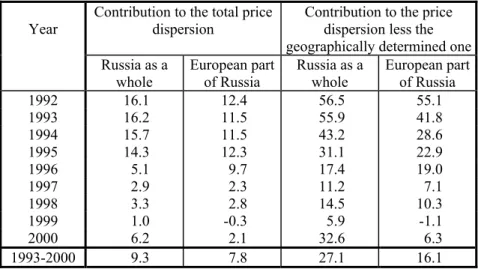
The estimates from Table 2 suggest that sensitivity of prices to changes in rate and economic power of crime is rather small. Therefore these estimates by themselves give no idea of how large is a role played by organized crime in the origination of inter-regional price differences. Following Engel and Rogers (1996), the economic significance of an explanatory variable can be characterized by the contribution of its average to the average of the explained variable. Since it follows from (3) that = β + ∑ δ
k k
X
kI
P ˆ
*ˆ , P being price dispersion averaged across all region pairs (r, s), the joint contribution of both variables describing organized crime to the average price dispersion is calculated as ( δ ˆ
CRX
CR+ δ ˆ
EPX
EP) / P , where index CR stands for crime rate, and index EP stands for economic power of crime. On the other hand, a portion that is due to natural, irremovable market frictions can be separated out the total (average) price dispersion. Such frictions are distances separating regions and difficult access to a number of regions. Transportation costs cause a considerable portion of price dispersion, for different years, from 54% to 83% in Russia as a whole, and from 46% to 77% in the European part of the country (for the entire period of 1993-2000, 66% and 51%, respectively). That is why the contribution of organized crime to price dispersion less its
“natural” part is also computed (i.e., with average price dispersion reduced by its part which is due to the relevant variables, distance and difficult access: P − ( δ ˆ
LX
L+ δ ˆ
DAX
DA) , index L standing for physical distance, and index DA standing for difficult access). Table 4 reports the results.
8
“The time when risky money, big and fast, was made is over. Nowadays this is a routine, a complex and hard job; no superprofit is here, and where it lacks, extortioners do not intrude there”, — cites Radayev (1998, p. 60) his respondent.
13
Table 4. Contribution of organized crime to the average price dispersion (in percentage terms)
Year Contribution to the total price dispersion
Contribution to the price dispersion less the geographically determined one Russia as a
whole European part
of Russia Russia as a
whole European part of Russia
1992 16.1 12.4 56.5 55.1 1993 16.2 11.5 55.9 41.8 1994 15.7 11.5 43.2 28.6 1995 14.3 12.3 31.1 22.9 1996 5.1 9.7 17.4 19.0 1997 2.9 2.3 11.2 7.1 1998 3.3 2.8 14.5 10.3 1999 1.0 -0.3 5.9 -1.1 2000 6.2 2.1 32.6 6.3
1993-2000 9.3 7.8 27.1 16.1
Table 4 suggests that organized crime contributes sufficiently to the origination of inter- regional price differences. Taking the entire period of 1993-2000, it is responsible for almost a tenth of the total price dispersion in the country as a whole. In the price dispersion above that caused by geographical reasons, more than a quarter for Russia as a whole and almost a sixth for the European part is due to organized crime. The impact of organized crime on consumer prices particularly reveals itself in the early years of the transition. It is worth noting that, in almost all years, of all identified market frictions excluding geographical ones, the most contribution to price dispersion is that of organized crime. However, in support of the above findings it decreases over time, although with some deviations from this trend.
Most probably they are due to the 1998 crisis and its consequences. After a period of almost steady decrease, the contribution of crime to price dispersion increased again in 1998, falling dramatically in the next year (vanished at all in the European part of Russia). However, it increased anew in 2000, the difference between Russia as a whole and the European part becoming very sizeable. However, we are forced to refrain from an explanation of reasons of such a dynamics, since as we move farther and farther away from 1995-1996, the proxy of the economic power of crime becomes progressively less reliable. It is not inconceivable that its cross-region distribution differed distinctly by 2000 (and maybe, even earlier) from that used for the estimations. In turn, the reliability of the estimates decreases as well.
The empirical results presented (as well as the preceding intuitive considerations) suggest that organized crime is a sufficient impediment to integration of the Russian market.
14
But there is another finding that seemingly conflicts with these results. Brown and Earle (2000) analyze the effect of competition on performance of Russian firms. Using the economic power of crime as one of variables, they find a rather surprising phenomenon:
organized crime proves to increase the positive effect of competition, including inter-regional one. One could conclude herefrom that organized crime, quite the contrary, facilitates integration of the Russian market. Is this really the case? Is Brown-Earle’s finding in conflict with that of this paper, or can these be reconciled?
In their paper, Brown and Earle use the enterprise output as a dependent variable, measuring the extent of competition (“competitive pressure”) by the deconcentration degree of both inter- and intra-regional product markets. A positive relationship found between these two variables implies that the less concentrated the market is, the more productive (in terms of output) are enterprises working in it. When the combined impact of competition and organized crime (being represented by the product of these variables) is taken into account, the relationship becomes considerably stronger.
This paper deals with consumer goods (although it presents a portion of the results, namely, covering only basic food goods, they do not qualitatively differ from those obtained for other goods). Till the crisis of 1998, the production of most of these goods brought low profit, if any. Therefore criminal groups did not show interest in the usurpation of control over the production of such goods, preferring to parasitize on the trade in them. Competitive, successfully working enterprises, control over which might provide high gains, were attractive for criminal groups. Such (again, till the 1998 crisis) were mostly enterprises that worked – directly or indirectly – for export. It was such enterprises that were above all the subjects of organized crime intrusion
9(if the results of Brown and Earle were presented by sector, they could shed more light upon the issue of the direction of this intrusion; unfortunately, their paper reports only data aggregated over the entire industry).
Thus, even if organized crime actually facilitates competition, there are no grounds to expect its positive impact on the integration of the consumer market, which is just supported by the use of Brown-Earle’s measure for organized crime within the framework of this study.
What is more, one hardly might expect that the effect found by them relates to the increase of price competition in the domestic market in general. Then what does their finding imply?
Brown and Earle explain the phenomenon found by competition of criminal groups against
9
Probably, the situation changed after 1998. However, no information which could give an idea of evolution of
“sectoral interests” of organized crime in recent years has been found.
15
one another, and by the fact that they facilitate the delivery of goods, both by cutting through the bureaucratic red tape and by protecting the goods from robbers. Possibly, this does occur, but the essentials seem to be different.
First, the causality may be reverse, that is, it is not organized crime that facilitates the productivity of enterprise, but vice versa, the more successfully an enterprise works, the more attractive it is for criminal groups, and so, the more chances it has to fall under criminal control. Second, a criminal group, indeed, may facilitate the productivity of enterprise with its specific means: contraband export of production, escaping taxes, getting various preferences and/or overpriced purchase orders from corrupted officials, etc. Third, organized crime can increase the competition measure itself, in particular, by forming a great number of intermediary (though registered as manufacturing) firms “around” a controlled enterprise, these firms aiming to hide an enterprise’s profit from taxation, to launder capitals (portions of which can be used for legal investments), to perform unlawful foreign-trade operations, etc.
It follows from the aforesaid that counteraction to market integration and (seeming or real) strengthening of the positive effect of competition that are caused by the activity of organized crime that is found by Brown and Earle (2000) do not contend against one another, but peacefully coexist, occurring in different “niches.” Thus, the results obtained in this paper and Brown-Earle’s finding are not in conflict; they rather complement each other.
6. CONCLUSIONS
So, using even very crude indicators characterizing the extent of organized crime in Russian regions, a significant dependence of consumer price dispersion on activity of criminal groups is revealed. The contribution of crime to spatial price disparities is rather considerable;
it exceeds the contribution of different impediments to inter-regional trade except those determined by geographical location of regions. The positive relationship between organized crime and consumer prices implies that there is an inverse negative relationship between standard of living in a region and the extent of organized crime. Hence, organized crime eventually causes a decline in living standards in the country.
16
17 REFERENCES
Berkowitz, D., D. N. DeJong and S. Husted (1998). Quantifying Russia’s Price Liberalization.
Journal of Comparative Economics, 26, 735-760.
Brown, D. and J. Earle (2000). Competition, geography, and firm performance: lessons from Russia. Paper presented at the CEPR/WDI Annual International Conference on Transition Economics, Moscow, 2-5 July.
Effron, S. (1994). Russia’s Breadbasket Hit by Mafia. Moscow Times, 23 June.
Engel, C. and J.H. Rogers (1996). How Wide Is the Border? American Economic Review, 86 (5), 1112-1125.
Gluschenko, K. (2003). Market Integration in Russia During the Transformation Years.
Economics of Transition, 11 (3), 411-434. (See also the working paper version in the IAS Economics Series, No. 116.)
Gluschenko, K. (2004). Analyzing Changes in Market Integration through a Cross-Sectional Test for the Law of One Price. International Journal of Finance and Economics, 9 (2), 135-149.
Goskomstat of Russia (1996). Methodological Regulations on Statistics, Issue 1. Moscow [in Russian].
Goskomstat of Russia (2001). Regions of Russia. Moscow [in Russian].
Kakotkin, A. (1996). The Triumph of Crime. Arguments and Facts, No. 30 [in Russian].
Kakturskaya, M., and A. Krashkov (2002). Why Watermelons Are Expensive, or “Business in the Russian Manner.” Arguments and Facts, No. 36 [in Russian].
Kiva, A. (1999). Criminal Revolution: A Figment or Reality? Social Sciences and the Present, No. 3, 25-37 [in Russian].
Leitzel, J. (2002). Corruption and Organized Crime in the Russian Transition. In: Cuddy, M.
and R. Gekker, eds., Institutional Change in Transition Economies. Ashgate, Aldershot, England; Burlington, VT; 35-54.
Lotspeich, R. (1997). An Economic Analysis of Extortion in Russia. MOCT-MOST, No. 4, 21-53.
Radayev, V. (1998). On the Role of Violence in Russian Business Relationships. Problems of Economics, No. 10, 81-100 [in Russian].
Tomilina, I. (2000). Chinese Brook Flows into Custom’s Pocket. Arguments and Facts of Siberia (regional attachment to newspaper Arguments and Facts), No. 37 [in Russian].
Volkov, V. (1999). The Force Business in Contemporary Russia. Sociological Studies, No. 1,
56-65 [in Russian].
Author: Konstantin Gluschenko Title: Crime and Prices
Reihe Ökonomie / Economics Series 167
Editor: Robert M. Kunst (Econometrics)
Associate Editors: Walter Fisher (Macroeconomics), Klaus Ritzberger (Microeconomics)
ISSN: 1605-7996
© 2005 by the Department of Economics and Finance, Institute for Advanced Studies (IHS),
Stumpergasse 56, A-1060 Vienna • +43 1 59991-0 • Fax +43 1 59991-555 • http://www.ihs.ac.at
ISSN: 1605-7996