Investigations of effective connectivity in small and large scale neural
networks
Inaugural-Dissertation zur
Erlangung des Doktorgrades
der Mathematisch-Naturwissenschaftlichen Fakultät der Universität zu Köln
vorgelegt von
Nils Rosjat
aus Solingen
Köln 2016
Prof. Dr. Ansgar Büschges Prof. Dr. Martin Nawrot
Tag der mündlichen Prüfung: 20.01.2016
Table of Contents
Zusammenfassung iii
Abstract v
Nomenclature vii
1 Introduction 1
2 Published Studies 8
2.1 A mathematical model of dysfunction of the thalamo-cortical loop in schizophrenia . . . . 8 2.2 Investigating inter-segmental connections between thoracic ganglia in
the stick insect by means of experimental and simulated phase response curves . . . . 30 2.3 Phase-locking in the delta-theta frequency band is an EEG marker of
movement execution . . . . 45
3 Unpublished Studies 86
3.1 Phase-locking analysis of EEG-data in movement related tasks reveals common underlying network of synchronous activity . . . . 86 3.2 Intersegmental coupling between fictive motor rhythms of pattern gene-
rating networks in the stick insect . . . 103
4 Discussion 123
5 Conclusion 132
Bibliography 134
Acknowledgements 148
Teilpublikationen 150
1 List of Publications . . . 150 2 Short Communications . . . 150
Erklärung 152
Zusammenfassung
Zur korrekten Verarbeitung von neuronalen Signalen müssen verschiedene neuronale Gruppen untereinander koordiniert werden. Um dies zu erreichen, muss zwischen den Neuronen eine Verbindung bestehen. Diese Verbindungen und insbesondere ihre Stärke sind a priori nicht bekannt und können nur in den seltensten Fällen direkt gemessen werden.
In dieser Arbeit werden drei Publikationen (Rosjat et al., 2014; Tóth et al., 2015;
Popovych et al., under review) und die Ergebnisse zweier weiterer Arbeiten vorgestellt, die sich mit der Analyse von Kopplungen in experimentell gemessenen neuronalen Ak- tivitäten befassen. Die Arbeiten unterteilen sich in die Untersuchung von intrinsischen sowie extrinsischen intra- und intersegmentalen Verbindungen in der Stabheuschrecke Carausius morosus und in die Analyse und Modellierung von Kopplungen anhand von EEG-Messungen des menschlichen Gehirns bei der Ausführung von unterschiedlichen Aufgaben. In beiden Bereichen wurden unter anderem mathematische Modelle verwen- det, um Hypothesen über bislang unbekannte Kopplungsmechanismen aufzustellen.
Die erste Studie befasst sich mit den durch Schizophrenie ausgelösten Veränderungen von Kopplungen im thalamo-kortikalen Kreislauf (Rosjat et al., 2014). Hierfür wurden bereits vorherig publizierte EEG-Daten aus einem Doppelklick-Paradigma verwendet, um ein mathematisches Modell, bestehend aus einer thalamischen und einer kortikalen neuronalen Population, zu erstellen. Die einzelnen Populationen bestanden aus einer Vielzahl von Phasenoszillatoren mit kontinuierlich verteilten Eigenfrequenzen. Unter Verwendung der Reduktionsmethoden von Pikovsky und Rosenblum, Ott und Anton- sen sowie Watanabe und Strogatz wurden die Einflüsse der bidirektionalen Verbindun- gen zwischen den beiden Hirnarealen auf die Synchronisation innerhalb dieser Bereiche untersucht. Das Modell war in der Lage, die experimentellen Daten zufriedenstellend zu reproduzieren. Wir konnten beobachten, dass die Kopplungsstärke von der thalami- schen zur kortikalen Region hauptsächlich die Dauer der Synchronisation beeinflusst, wohingegen die Rückkopplung zur thalamischen Region einen stärkeren Effekt auf die Synchronisationsstärke ausübt. Dies führte zu der Hypothese, dass die Rückkopplung zur thalamischen Region bei an Schizophrenie erkrankten Testpersonen vermindert sei.
In der zweiten Studie werden intersegmentale Kopplungen im Protraktor-Retraktor-
mit Hilfe von an experimentelle Daten angepassten mathematischen Modellen unter- sucht (Tóth et al., 2015). Wir haben dafür einerseits experimentell ermittelte und ande- rerseits von mathematischen Modellen simulierte Phasen-Antwort-Kurven verwendet, um die Art und Stärke der Verbindungen zu untersuchen. Wir konnten zeigen, dass Verbindungen von beiden Seiten des prothorakalen zum mesothorakalen Netzwerk nö- tig waren, um eine gute Übereinstimmung der Phasen-Antwort-Kurven zu erzielen.
Außerdem zeigte sich, dass die Stärke von exzitatorischen Verbindungen maßgeblich zu den Phasen-Antwort-Kurven beigetragen hat, wohingegen die Stärke der inhibitori- schen Verbindungen keinen großen Einfluss zu haben scheint.
Die dritte Studie beschäftigt sich mit der Identifizierung eines neuronalen Markers
der Bewegungsausführung (Popovych et al., under review). In dieser Arbeit haben wir
die Auswirkung von intern sowie extern evozierten Bewegungen auf die Phasensyn-
chronisation untersucht. Dafür haben wir die Signale, die von über dem motorischen
Cortex platzierten Elektroden aufgezeichnet wurden, auf dem Phasenniveau der Haupt-
frequenzbereiche (δ-, θ-, α-, β- und dem niedrigen γ-Bereich) hinsichtlich ihrer Phasen-
synchronität zwischen einzelnen Wiederholungen analysiert. Es hat sich gezeigt, dass
unabhängig von der Hand, welche die Bewegung ausführt, und unabhängig von der Art,
wie diese Bewegung ausgelöst wurde, eine stark lateralisierte Phasensynchronisation in
den niedrigen Frequenzbereichen (δ und θ) in Elektroden über dem kontralateralen
primären Motorcortex stattfindet. Diese Ergebnisse legen nahe, dass sich die Phasen-
synchronisation in motorischen Bereichen zusätzlich zu den etablierten Markern der
ereignisbezogenen Desynchronisation und der ereignisbezogenen Synchronisation, wel-
che sich auf Änderungen der Amplitude im α- und β-Frequenzbereich beziehen, als
neuronaler Marker der Bewegungsausführung eignet.
Abstract
The correct signal processing of neuronal signals requires coordination of different groups of neurons. To achieve this there has to be a connection between those neurons.
This connection and especially the strength of the connection is not known a priori and can only be measured directly in rare cases.
In this thesis I present three publications (Rosjat et al., 2014; Tóth et al., 2015; Po- povych et al., under review) and the results from two additional studies focussing on the analysis of couplings in experimental measured neuronal activities. The publica- tions can be divided into investigations of intrinsic, as well as extrinsic intra- and intersegmental connections in the stick insect Carausius morosus and into analysis and mathematical modeling of couplings from EEG-measurements of the human brain whi- le subjects were performing different tasks. In both parts I made use of mathematical models to build hypotheses about so far unknown coupling mechanisms.
The first study deals with connectivity changes in the thalamo-cortical loop caused by schizophrenia (Rosjat et al., 2014). To build a mathematical model consisting of neural populations representing the thalamus and the auditory cortex we made use of published EEG-data, which were collected while subjects performed a double-click pa- radigm. The individual populations comprised a large number of phase oscillators with continuously distributed natural frequencies. Applying reduction methods by Pikovsky and Rosenblum, Ott and Antonsen together with the reduction method by Watanabe and Strogatz we investigated the influences of the bidirectional connections between the brain areas on the synchronization of the neuronal populations. The model was able to replicate the experimental data adequately. We observed that the coupling strength from the thalamic region to the cortical region mainly affected the duration of syn- chrony while the feedback to the thalamic region had a bigger effect on the strength of synchrony. This led to the hypothesis that the back coupling to the thalamic region might be reduced in schizophrenia patients.
The second study will show an analysis of intersegmental couplings in the protractor- retractor system of the pro- and mesothoracic ganglion of the stick insect Carausius morosus using mathematical models based on experimental data (Tóth et al., 2015).
We made use of phase-response curves that were calculated experimentally on the one
and the strength of their connection. We showed that connections on both sides from the prothoracic to the mesothoracic network were necessary to achieve a good agree- ment with the experimental phase-response curves. Additionally, it was found that the strength of the excitatory connection played a key role, while the strength of the inhi- bitory connection did not have a big influence on the shape of the phase-response curves.
The third study deals with the identification of a neuronal marker of movement exe-
cution (Popovych et al., under review). In this work we investigated the influence of
internally and externally triggered movement on the phase synchronization in the mo-
tor system. We tested the signals, that were recorded from electrodes lying above the
motor cortex, in the phase space including the major frequency bands (δ-, θ-, α-, β −
and low γ-frequencies) for inter-trial phase synchrony. The study revealed a strong la-
teralized phase synchronization in the lower frequency bands (δ and θ) in the electrodes
above the contralateral primary motor cortex independent of the hand performing and
the cue triggering the movement. The results suggest that this phase synchronization
could serve as an electrophysiological marker of movement execution additionally to
the well established event-related desynchronization and event-related synchronization
that are based on the amplitude changes in α- and β frequency bands.
Nomenclature
CPG . . . Central Pattern Generator CS . . . Campaniform Sensilla CTr . . . Coxa-trochanter joint DCM . . . Dynamic Causal Modeling EEG . . . Electroencephalography EF . . . Extensor-Flexor
fCO . . . Femoral Chordotonal Organ FeTi . . . Femur-tibia joint
FFT . . . Fast Fourier Transform FLB . . . Fold Limit Cycle Bifurcation
fMRI . . . functional magnetic resonance imaging HB. . . Hopf Bifurcation
LD . . . Levator-Depressor
lM1 . . . left Primary Motor Cortex lPM . . . left Premotor Cortex MN . . . Motoneurone
OA . . . Ott-Antonsen
ODE . . . Ordinary Differential Equation PLI . . . Phase-locking Index
PR . . . Protractor-Retractor PRC . . . Phase Response Curve rM1 . . . right Primary Motor Cortex rPLV. . . rescaled phase-locking value rPM . . . right Premotor Cortex SLI . . . Stimulus-locking Index SMA . . . Supplementary Motor Area
sPLV. . . single-frequency phase-locking value ThC . . . Thorax-coxa joint
WS . . . Watanabe-Strogatz
1 Introduction
All sorts of behaviour, be it coordinated movements, processing of external inputs or planning of motions, need interactions of activities of the nervous system.
“To move things is all that mankind can do, and for this task the sole exe- cutant is a muscle, whether it be whispering a syllable or felling a forest.”
(Sherrington, 1941)
The loss of such basic behavioural abilities represents a major limitation in normal day-to-day life of patients suffering from mental illnesses, such as Parkinson’s disease, schizophrenia or stroke. It is the aim of this thesis to investigate the neural mechanisms underlying these basic abilities. Those fundamental actions of living organisms could either be observed on the behavioural level or recorded and analyzed on an electro- physiological level. Electrophysiology deals with electrical properties from microscopic (e.g. single-cell recordings) to a macroscopic view (e.g. whole brain recordings like electroencephalography). In this work I will approach neural activities from both the microscopic side, in extracellular nerve recordings of the stick insect using so-called hook electrodes (Schmitz et al., 1988), and the macroscopic side, in EEG recordings of the human brain.
Stick insects are often used as a model organism for neuronal studies, since their ner-
vous system is easy to access and their walking behaviour is directly observable. Its
legs consist of three leg joints that produce coordinated movements during walking and
climbing. The thorax-coxa (ThC) joint is responsible for forward and backward move-
ments, the coxa-trochanter (CTr) joint is able to move the femur of the stick insect in
upward and downward direction and finally the femur-tibia (FTi) joint that is responsi-
ble for outward and inward movements of the leg. Each of the leg joints is controlled by
antagonistic muscle pairs, namely the protractor-retractor (ThC), the levator-depressor
(CTr) and the flexor-extensor (FTi) muscle pair (Graham and Epstein, 1985). In stick
insects (Büschges, 2005) as well as in other insect species (cockroach: (Fuchs et al.,
2010), cricket: (Grillner, 2003)) each muscle pair of each of the six legs is controlled by
central pattern generators (CPGs). In the stick insect, these CPGs are located in the
locomotor behaviour. The main sensory organs involved in locomotion are the femoral chordotonal organ, that provides information of the movement and angular velocity of the leg (Bässler, 1967), the femoral and trochanteral campaniform sensilla, that are responsible for force and load signals (Bässler, 1977a; Akay et al., 2001, 2004), and hair plates as well as hair rows which provide information on the position of the leg relative to the body of the stick insect (Bässler, 1977a).
Previous experimental studies have shown that a single stepping front leg is able to induce rhythmic protractor-retractor motoneuron activity in the adjacent thoracic seg- ment (Borgmann et al., 2009), whereas the last thoracic segment showed only a tonic increase in protractor-retractor motoneuron activity (Borgmann et al., 2007). In a semi- intact preparation, where all legs except for an ipsilateral pair, consisting of a front and a middle leg, were removed, a general increase in tonic motoneuron activity in the me- tathoracic ganglion was observed during stepping of the middle leg. However, stepping of both legs induced alternating activity in the protractor and retractor motoneurons of the metathoracic ganglion that was in phase with front leg steps (Borgmann et al., 2009). A single stepping hind leg on the other side caused a tonic increase of protractor- retractor motoneuron activity in two thirds of the experiments and rhythmic activity in the remaining third of the experiments in the mesothoracic ganglion (Borgmann et al., 2009). Additionally, it could be shown that stepping of a single hind leg also entrains a pilocarpine induced rhythm in the protractor and retractor motoneurons of the prothoracic ganglion (Grabowska, 2014).
Even though many studies focussed on the inter-segmental effects of sensory feedback, the exact contribution of those effects on the inter-leg coordination remains unclear.
Mathematical models are a good tool to build hypotheses about the underlying coup-
ling structures leading to the observed inter-segmental influences. Depending on the
research question, these models could be simplified by a reduction to the phase plane
as in the biomechanical cockroach model (Holmes et al., 2006; Proctor et al., 2010)
or they could be based on more complex systems of Hodgkin-Huxley type neurons
(Hodgkin and Huxley, 1952) that are able to describe the interactions in more detail
(Daun et al., 2009; Daun-Gruhn et al., 2011; Daun-Gruhn and Tóth, 2011). The study
of the precise inter-segmental influences of sensory information on motoneuron pools
that control a concrete pair of muscles, thus, requests the use of the latter modeling
approach. This model is not only able to reproduce different walking patterns observed
in stick insects, but it also enables us to simulate various experimental paradigms by
decoupling and deactivating certain leg joints from the rest of the network. Thereby
an artificial deafferentation of the desired legs as used in previous experimental studies
(Borgmann et al., 2009) can be produced. This model can then be used to investigate
excitation and coupling strengths, that are needed to achieve similar behaviour as ob- served in experiments.
However, the presence of the strong sensory inputs during leg movements makes it difficult to investigate the intrinsic intra- and inter-segmental interaction between the different CPG networks. In order to understand the role of this intrinsic coupling it is necessary to remove all sensory influences on the system. For this purpose a large number of studies dealt with deafferented isolated nerve cords in the state of fictive locomotion induced by the muscarinic receptor agonist pilocarpine (c.f. Büschges et al., 1995). This kind of preparation allows us to analyze the interactions of the CPG networks in the different thoracic segments.
In contrast to the stick insects nervous system, the human brain cannot be accessed ea- sily for direct recordings of neuronal activities. Therefore, non-invasive technologies are needed to measure the brain activity. The techniques mostly used in the last decades are functional magnetic resonance imaging (fMRI), magnetoencephalography (MEG) and electroencephalography (EEG).
The human brain is an extremely complex structure that contains up to 10 12 neu- rons and about 10 13 to 5 · 10 13 glial cells, that do not take part directly in the synaptic interactions and electrical signaling. Every neuron can have up to 10 4 post-synaptic connections which leads to a very high complexity in the networks formed by connected neurons. To be able to capture networks in this dimension, the neurons are grouped in families, the so called brain areas. These areas are specialized on different tasks and can be distinguished by their cytoarchitecture, histological structure and organization of cells (Brodmann, 1909). The cortex can be subdivided into six cortical layers (Shipp, 2007). The cortical layers contain cells of different neuronal size, shapes and density and can be divided into three parts. The supragranular layers consist of the layers I to III. They are the main origin of corticocortical connections and consist of small pyramidal cells (layer III), small stellate cells (layer II) and nerve fibers (layer I). The second part is the internal granular layer IV that receives thalamocortical connections through stellate cells. The last part, the infragranular layers V to VI, primarily connects the cerebral cortex to subcortical layers and consists mainly of large pyramidal cells (Schusdziarra et al., 1977; Shipp, 2007; Greig et al., 2013). The composition of the six layers is different in certain cortical areas, while the motor cortex has a prominent layer V and only a small layer IV. Other cortical areas such as the primary sensory cortices, show a more pronounced granular layer (Shipp, 2007).
The various non-invasive techniques record different quantities of the brain activities
signal in response to neural activity are detected. The idea behind this technique is that active brain areas consume more oxygen and thus the blood flow in these are- as increases (Heeger and Ress, 2002). The advantage of this method is its excellent spatial resolution, while it has deficits in the determination of neural events at fast time-scales. MEG and EEG on the other hand measure magnetical and electrical si- gnals. EEG measures potential differences on the scalp produced by volume currents, while MEG measures magnetic fields induced mainly by tangential primary currents based on excitatory activity (Okada et al., 1997). The simultaneous activity of about 50.000 pyramidal cells gives rise to measurable EEG and MEG signals (Murakami and Okada, 2006). Although EEG and MEG have the advantage of high temporal resoluti- on, volume conductance leads to a poor spatial resolution. Thus, we have no detailed information on single neurons or small brain areas. This makes it necessary to use pre- processing steps like source reconstruction or spatial filtering via Laplacian references to improve the localization of the recorded signals (e.g. Van Veen et al., 1997; Dale et al., 2000; McFarland et al., 1997).
As mentioned above, the loss of basic cognitive functions is a substantial impairment to day-to-day life of patients suffering from mental diseases. Thus it is of paramount importance to understand the interplay of brain regions while performing basic cogni- tive tasks, such as sensory processing, movement preparation and execution, in order to increase the understanding of possible dysfunctions in the involved networks and possible improvements of their rehabilitation.
Previous studies have shown bio-markers for movement preparation and movement execution. These are, amongst others, the Bereitschaftspotential preceding self-initiated movements (Shibasaki and Hallett, 2006) and the event-related desynchronization (ERD) and event-related synchronization (ERS) in movement related tasks (Neuper et al., 2006; Pfurtscheller and da Silva, 1999). These bio-markers are based on changes of amplitudes only and do not take phase-synchronization effects into account. As seen in (Brockhaus-Dumke et al., 2008), the lack of phase-synchronization plays a key-role in auditory evoked responses in schizophrenia. Up to now it remains unclear whether similar phase-locking effects can be found in the human motor system and whether its nature is changed due to different cognitive diseases.
These phase-locking effects could be used to build mathematical models and there-
by could lead to hypotheses about the modulation of the interaction between different
brain areas. Based on the work by Hodgkin and Huxley (1952) many mathematical
models were derived (c.f. Carlsson, 2006; an der Heiden, 2006). Most of those models
only describe the coupling of a small number of neurons. Since we want to study a
brain during execution of certain tasks, we need to find a simplified way to model the
neuronal dynamics. A commonly used way to investigate the coupling structure of EEG
data is dynamic causal modelling (DCM). DCM simulates the activity of infragranular,
supragranular and granular layers via neural mass models using the Jansen and Rit
model and estimates the coupling between the different sources of activity (Jansen and
Rit, 1995; Kiebel et al., 2008). Another approach for neuronal networks of this size are
ensembles of coupled phase-oscillators that can be further reduced to the mean field
activity of each ensemble (Pikovsky and Rosenblum, 2011). These models can serve
as an abstract phenomenological representation of the observed activities that can be
adjusted to different brain regions easily. With the help of these models, insights in the
general coupling structure of the investigated neural networks can be obtained.
tion phenomena in neuronal networks on the micro- and macroscopic scale tackled by direct analysis of experimental data and by investigations of mathematical models.
The first publication (Rosjat et al., 2014) shows possible differences in the thalamo- cortical loop in patients suffering from schizophrenia. For this work, mathematical models based on large ensembles of phase oscillators were fitted to experimentally obtained synchronization effects in EEG data. The model was reduced to lower di- mensions via the Pikovsky-Rosenblum ansatz (Pikovsky and Rosenblum, 2011). The model is - despite its abstract nature - in good agreement with the recorded EEG data.
This justifies our chosen degree of approximation. The results suggest that the decrease in phase-synchronization, that is present in schizophrenia patients, is due to reduced connectivity from the auditory cortex to thalamic regions.
The second study (Tóth et al., 2015) shows an analysis of inter-segmental coupling in the protractor-retractor system of the pro- and mesothoracic ganglion of the stick insect. The mathematical model was adjusted to match the experimental condition, i.e.
all legs except for a single front leg were removed. Theoretical phase-response curves (PRCs) were then fitted to the ones obtained by experiments to determine the nature and the strength of the connection between the pro- and mesothoracic segment. We showed that connections on both sides from the prothoracic to the mesothoracic net- work were necessary to achieve a good agreement with the experimental phase-response curves. Additionally it was found that the strength of the excitatory connection played a key role, while the strength of the inhibitory connection did not have a big influence on the shape of the phase-response curves.
The third work (Popovych et al., under review) describes synchronization phenomena on the phase and amplitude level in movement related tasks. Therefore, EEG data of young healthy participants were recorded during externally and internally trigge- red finger tapping movements, as well as a vision only control condition. The analysis showed low frequency intra-regional phase-synchronization in electrodes located above the pre-motor cortex, the primary motor cortex and supplementary motor areas ad- ditionally to the well-known ERD and ERS effects during movement preparation and movement execution. In contrast to phase-synchronization found in auditory double- click paradigms, there were no synchronization effects present in frequencies higher than approximately 10 Hz. The observed effect was strongest in the electrodes lying above the primary motor cortex contralateral to the moving hand.
The last part of the thesis describes the results from two additional unpublished stu-
dies. The first subsection deals with inter-regional phase-synchronization effects during
to analyze the inter-regional synchronization picked up by electrodes lying above motor related areas. The analysis showed a significant increase in phase locking that was stron- gest between motor regions contralateral to the moving hand and the supplementary motor area during movement preparation and execution in δ − θ frequencies (2-7 Hz).
An increase in β-phase synchronization (13-30 Hz) was observed between contralateral motor areas and the supplementary motor area, after the movement had finished.
The second subsection deals with the analysis of intrinsic connectivities in the deafferen- ted thoracic nerve cord of the stick insect. The recorded depressor motoneuron activity was analyzed via two approaches, a first descriptive approach using phase-difference analysis and a second more sophisticated approach using dynamic causal modelling.
Both approaches showed a strong agreement on the level of coupling strengths. The
results suggest the existence of intra- and ipsilateral inter-segmental couplings between
the segments of the pro-, meso- and metathoracic ganglia in the levator-depressor sys-
tem. The study showed that the intra-segmental coupling strength in the mesothoracic
ganglion is the strongest, while intra-segmental connections between meso- and meta-
thoracic ganglia are the weakest over all experimental conditions. The connectivity in
the prothoracic ganglion, that controls the behaviour of the front legs, shows a high
variability between and within the different approaches. This result might reflect the
independent movements from the other legs during searching movements, as well as
the coupled movements during walking behaviour.
2 Published Studies
2.1 A mathematical model of dysfunction of the thalamo-cortical loop in schizophrenia
Nils Rosjat, Svitlana Popovych and Silvia Daun-Gruhn
Published in Theoretical Biology and Medical Modelling (11:45,2014)
Author Contributions
Conceived the research Nils Rosjat, Svitlana Popovych
Silvia Daun-Gruhn
Performed the simulations Nils Rosjat
Analyzed the data
Nils Rosjat, Svitlana Popovych Silvia Daun-Gruhn
Figure Preparation Nils Rosjat
First version of manuscript Nils Rosjat
Wrote the paper
Nils Rosjat, Svitlana Popovych
Silvia Daun-Gruhn
http://www.tbiomed.com/content/11/1/45
R E S E A R C H Open Access
A mathematical model of dysfunction of the thalamo-cortical loop in schizophrenia
Nils Rosjat * , Svitlana Popovych and Silvia Daun-Gruhn
*Correspondence:
rosjatn@uni-koeln.de Heisenberg Research Group of Computational Biology, Department of Animal Physiology, Institute of Zoology, University of Cologne, Zülpicher Str. 47b, 50674 Cologne, Germany
Abstract
Background: Recent experimental results suggest that impairment of auditory information processing in the thalamo-cortical loop is crucially related to
schizophrenia. Large differences between schizophrenia patients and healthy controls were found in the cortical EEG signals.
Methods: We derive a phenomenological mathematical model, based on coupled phase oscillators with continuously distributed frequencies to describe the neural activity of the thalamo-cortical loop. We examine the influence of the bidirectional coupling strengths between the thalamic and the cortical area with regard to the phase-locking effects observed in the experiments. We extend this approach to a model consisting of a thalamic area coupled to two cortical areas, each comprising a set of nonidentical phase oscillators. In the investigations of our model, we applied the Ott-Antonsen theory and the Pikovsky-Rosenblum reduction methods to the original system.
Results: The results derived from our mathematical model satisfactorily reproduce the experimental data obtained by EEG measurements. Furthermore, they show that modifying the coupling strength from the thalamic region to a cortical region affects the duration of phase synchronization, while a change in the feedback to the thalamus affects the strength of synchronization in the cortex. In addition, our model provides an explanation in terms of nonlinear dynamics as to why brain waves desynchronize after a given phase reset.
Conclusion: Our model can explain functional differences seen between EEG records of healthy subjects and schizophrenia patients on a system theoretic basis. Because of this and its predictive character, the model may be considered to pave the way towards an early and reliable clinical detection of schizophrenia that is dependent on the interconnections between the thalamic and cortical regions. In particular, the model parameter that describes the strength of this connection can be used for a diagnostic classification of schizophrenia patients.
Keywords: Mathematical modeling, Phase oscillators, EEG, Synchronization
Introduction
Schizophrenia is a severe and complex mental illness causing disability [1-3]. It has been conceptualized as a disconnectivity syndrome concerning the interplay of the brain areas involved. As information on the activity of some of the deeply localized involved brain areas, such as the thalamus is not accessible to noninvasive electroencephalography (EEG) measurement, alternative methods, like mathematical models, need to be developed in order to deepen our understanding of the fundamental neural processes underlying
© 2014 Rosjat et al.; licensee BioMed Central Ltd. This is an Open Access article distributed under the terms of the Creative Commons Attribution License (http://creativecommons.org/licenses/by/4.0), which permits unrestricted use, distribution, and
http://www.tbiomed.com/content/11/1/45
schizophrenia, and to detect dysfunctions in the interactions between the participating brain areas. Such methods aim at deriving reliable criteria that indicate the progress of the disease at an early stage. The early recognition is considered to be of special importance in schizophrenia.
As schizophrenia has a very high degree of complexity, due to the large number of neuronal processes involved, there is no model that treats all aspects of the disease con- currently. The model in [4], for instance, focuses on the empirical dopamine hypothesis of schizophrenia and postulates that an imbalance between glutamate and dopamine activity plays a key role in schizophrenia disorder. In particular, the authors could show that both hypoglutamatergia and hyperdopaminergia result in reduced activation of the striatal complex and thus leads to schizophrenia [4].
Heiden et al. [5] on the other hand modeled the basic neural circuit underlying schizophrenia as a dynamical system on a microstructural level of pyramidal cells (see also Mackey et al. [6]). In their model, periodic firing patterns were associated with healthy behavior, whereas aperiodic/chaotic firing patterns were associated with schizophrenic states and the switch from periodic to aperiodic firing took place due to an increase in dopamine level. In [7], the same model was analyzed in a hypo-glutamatergic setting, and it also exhibited aperiodic firing.
A top-down approach in modeling the symptoms of schizophrenia is proposed in [8,9].
These authors relate cognitive, negative and positive symptoms of schizophrenia to a reduced depth of attractor basins of the model regarded as a dynamical system. The model consisting of pools of leaky integrate-and-fire neurons for the involved pyramidal cells and inhibitory interneurons and AMPA, NMDA and GABA
Asynapses either developed spon- taneous firing or was attracted to a high-firing state. The decrease in NMDA-receptor conductance led to a decrease in attractor stability and therefore a decrease in mem- ory and an increase in distractability [8,9]. An additional decrease in the conductance of GABA-synapses led to jumping from spontaneous activity to attractors which could be identified with the increase of positive symptoms [8].
In [10], fMRI data of healthy and schizophrenic test persons obtained in a memory-task experiment were used to assess the connectivity between the visual, parietal and pre- frontal regions using DCM as proposed by [11]. Each of these regions has a self-coupling and bidirectional all-to-all coupling. Moreover, the working memory modulates the cou- pling from visual to prefrontal and from prefrontal to parietal regions. The schizophrenic patients and the healthy subjects differed significantly in the self-coupling strengths, in the coupling between parietal and prefrontal regions in both directions and in the coupling from visual to prefrontral regions [10].
In contrast to the modeling studies described above, we focused our attention on the
phenomena observed on the large-scale level of dysfunction of the thalamo-cortical loop
in schizophrenia. We did therefore not include any explicit biophysical properties into our
model. We constructed a mathematical model based on a study by [12]. In this study, the
difference between healthy subjects and schizophrenia patients was investigated, using
individual EEG recordings with respect to phase locking (PL) in the four frequency bands
(θ , α, β and γ ). The two groups of test persons showed significant difference in the
strength of PL in the θ - and α-frequency band, while no significant difference in PL was
observed in the other two frequency bands. The duration of PL, i.e. the time until the
system desynchronize again, differed for each frequency band. However it did not differ
http://www.tbiomed.com/content/11/1/45
significantly between healthy subjects and schizophrenia patients in each of the four frequency bands.
In our earlier model [13], we described each component of the thalamo-cortical loop as a single phase oscillator, where each of them operated at its natural frequency. We used phase oscillators for the description of the dynamics in each brain area, since previous studies suggested that the timing of the brain rhythms, i.e. the phases, were more impor- tant than their amplitudes [12]. The coupling between these oscillators was expressed in form of weighted phase differences with suitable coefficients, which were determined from the natural frequencies of the oscillators. Using this model, we were able to explain the difference in phase locking in the respective frequency bands of the two groups of test persons depending on the feedback from the cortex to the thalamus. In this model, how- ever, the synchronization effect observed directly after the given auditory stimulus did not abate and vanish after a given period of time, contrary to what was seen in the exper- iments [12]. We had therefore to change our mathematical model in order to be able to account for the desynchronization effects, too.
In the present study we extended this mathematical model such that now each area of the thalamo-cortical loop is represented by a large population of phase oscillators. The coupling between populations is driven by a complex meanfield (definition see below).
To reduce this high-dimensional model to a low dimensional system which still reflects the behavior observed in the EEG data and to allow its analysis, we use the reduction methods of Watanabe- Strogatz [14], Ott-Antonsen [15] and Pikovsky-Rosenblum [16].
The mathematical analysis of the model offers a conducive explanation for the under- lying mechanisms leading to the differences observed between healthy subjects and schizophrenia patients, as seen in the experiments by [12]. Our results suggest that the differences are due to a decrease in strength of the coupling from the auditory cortex to the thalamus in schizophrenia patients. Even so, our model is a rather abstract descrip- tion of the neural dynamics that take place in the thalamo-cortical loop. A decrease in coupling strength can occur due to changes in the dopamine, glutamate or serotonin con- centrations. This means in any case a reduction in signal transduction from the auditory cortex to the thalamus. Furthermore, our analysis of the reduced system reveals that the mechanism underlying the abolition of synchrony observed in all four brain wave bands is based on a fold limit cycle bifurcation that takes place when the coupling between the auditory cortex and the thalamus is changed (in either direction). Our model addition- ally predicts that a change in coupling strength from the thalamus to the auditory cortex, however, affects the duration of phase synchrony.
The paper is organized as follows. In section “The experimental setup and results”, we review the experimental setup and the results of the study by [12]. In section
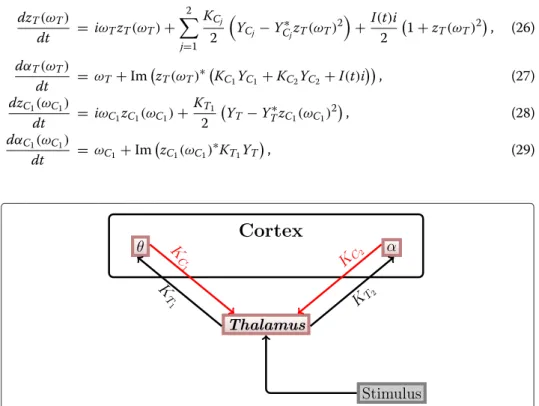
“Mathematical model”, we present the general structure of the thalamo-cortical loop and set up a mathematical model which we use to analyze first the behavior of two coupled brain regions, the thalamus and one cortical region, and then that of three coupled ones, the thalamus and two cortical regions.
The experimental setup and results
The mathematical model presented below is based on experimental results (for details of
the experiment and methods used see [12]). In the following, we outline the experiment
performed in [12]. Two groups of participants were investigated during the experiment:
http://www.tbiomed.com/content/11/1/45
the first group consisted of 32 schizophrenia patients and the second of 32 healthy subjects. The experiment was based on the well-established paired click paradigm [17]. It consisted of 96 paired clicks (S
1and S
2). Each click had a duration of 1 ms. The interstim- ulus interval between the two clicks within a pair lasted 500 ms, and the inter-trial interval between pairs of clicks 10 s. The EEG was continuously recorded using 32 electrodes dur- ing the whole experiment. Data from the vertex electrode Cz were taken for the analysis, because the cortex around the location of this electrode performs sensory and motor functions, see [18]. The recorded data have been divided into epochs of 1500 ms (500 ms prior to S
1and 500 ms following stimulus S
2). The occurence of stimulus S
1in each seg- ment was set to t = 0, hence the stimulus of each segment appeared at t = 0. To obtain detailed information on the temporal and spectral properties of the EEG, a single-trial analysis was applied to the epochs. Thus a complex Morlet wavelet transformation in the frequency range from 3 Hz to 60 Hz in 1 Hz steps was performed to compute the phases of the single-trial data. A typical result is displayed in Figure 1 (adapted from [13]) where the cosine of the single trial phase after the wavelet transformation for a fixed frequency 54 Hz is shown. It includes 82 superimposed segments. Uniform distribution of the phases prior stimulus onset, i.e. for t ∈ [ − 50, 0] is clearly visible, while the so called phase lock- ing effect after the stimulus, i.e. for t ∈ [0, 75], and the effect of desynchronisation after t = 75 ms can also be clearly discerned.
The stimulus locking index SLI ( t ) =
1 n
n k=1e
2πiφk(t)(1)
defined in [19], can be used to measure the degree of phase locking for a certain fre- quency at time t. We denote the number of repetitions of the auditory double clicks by n and the phase of the k-th oscillation at time t by φ
k( t ) . Values near 0 indicate a uni- form distribution of phases and values near 1 nearly synchronized phases. It was found that schizophrenia patients produced significantly less phase locking in lower frequency bands after the first stimulus than healthy subjects [12].
Table 1 shows the SLI and the duration of synchronization for the two groups of subjects for the θ - and α -frequency band for which significant differences were found in the SLI (see [12]). Based on these experimental results, we constructed a mathematical model
Figure 1 Experimental data. The cosine of the phases, derived from EEG data of a single participant,
expressing a frequency of 54 Hz is shown (from [13]).
http://www.tbiomed.com/content/11/1/45
Table 1 Example behavior of cortical regions
Max. SLI Duration
Patients Control [ms]
θ
.30 .37 400
α
.19 .26 250
Columns 1-2: Maximum SLI values (from [12]); Column 3: Approximate duration of stimulus responses ([12], Figure two).
of the thalamo-cortical loop and used it to explain the observed differences between the neural activities of schizophrenia patients and healthy subjects.
Mathematical model
Our model of the thalamo-cortical loop is based on the results of [4,12,13,20]. Accord- ing to the experimental findings in these sources, we assume that essentially three main brain areas are actively involved in auditory signal processing, i.e. the thalamic auditory relay nucleus (here for the sake of simplicity, they are referred to as thalamus), the tha- lamic reticular nucleus (here named TRN) and areas of the auditory cortex. An auditory input signal reaches the thalamus and then propagates to the auditory cortex. From the auditory cortex, the signal propagates to higher cerebral regions such as the prefrontal cortex and back to the TRN, which inhibits the thalamus. Furthermore, backpropagation from higher regions such as the prefrontal cortex modulates the activity of the thalamus.
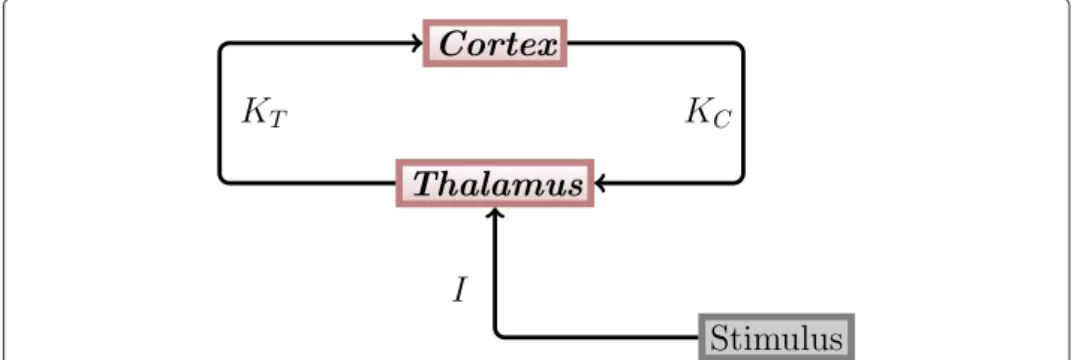
These inhibitory and modulating influences lead to a reduced response of the thalamus to the second of the two clicks [21-23]. Since we are only interested in the dynamics after the first and before the second stimulus, we neglected the impact of the TRN. This means that only the thalamus and different regions of the auditory cortex are present in our model. It can be assumed that the different cortical regions act in different oscillatory frequency ranges, which correspond to the θ , α, β and γ ranges. The structure of the thalamo-cortical loop used in our model is shown in Figure 2.
In our earlier work [13], we described each part of the thalamo-cortical loop by a single phase oscillator. Each oscillator had a natural frequency, which was chosen according to biological/experimental observations. We assumed, that coupling between all phases is a form of weighted phase difference with suitable coefficients to be determined from the natural frequencies. With this model, it was possible to reproduce the effects that correspond to phase locking as observed in the EEG data of the two groups of subjects.
However, in contrast to what the data showed (see Figure 1, t > 75 ms), the oscillators
Figure 2 Thalamo-cortical loop. The general structure of the thalamo-cortical loop used in our modeling
study.
KTand
KCdenote coupling strengths between the thalamus and the auditory cortex. Both the thalamus
and the cortex are represented by one population of oscillators each. I denotes the stimulation strength.
http://www.tbiomed.com/content/11/1/45
remained in the synchronized state perpetually, and their phases did not desynchronize again. To overcome this major drawback of our old model, we now describe each element of the thalamo-cortical loop as a large ensemble of nonidentical phase oscillators. Each oscillator in the population has a natural frequency ω, which is chosen from a Lorentz distribution n(x). The coupling between populations is driven by a complex meanfield. In the experiments, repeated stimulations were used in order to obtain stimulation moments at different phases. In our mathematical model we use 1000 oscillators with distributed phases in each population and stimulate each oscillator at t = 0. Since we choose the initial conditions for each oscillator to be different, the results obtained by stimulating them at only one point in time are comparable to the experimental conditions.
First, we will consider a minimal mathematical model, which consists of only two populations of oscillators, one for the thalamus and one for the θ -frequency band of the auditory cortex. We will use this simplified model to understand the mechanism behind the transition from the synchronized to the desynchronized state after stimulation (as seen in Figure 1).
Minimal mathematical model (two populations)
In the minimal model, two populations of oscillators are coupled via their complex mean fields as shown in Figure 3. One of them describes brain wave activity in the thalamus and the other one in the cortex, in this case in the θ -band. In the course of this work, we will refer to these populations as thalamus population and cortex population, respectively.
The system describing the neural activities of the two populations reads as follows d φ
T(ω
T)
dt = ω
T+ K
CR
Csin (θ
C− φ
T(ω
T)) + I ( t ) cos (φ
T(ω
T)) , (2) d φ
C(ω
C)
dt = ω
C+ K
TR
Tsin (θ
T− φ
C(ω
C)) , (3) where ω
Tand ω
Care continuous parameters distributed in each ensemble of oscillators as
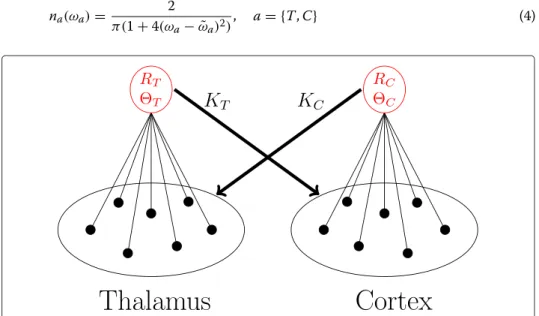
n
a(ω
a) = 2
π(1 + 4(ω
a− ˜ ω
a)
2) , a = {T , C} (4)
Figure 3 Mean field coupling. Visualization of the complex mean field coupling between the thalamic
region (T) and a single cortical region (C). Black represents the individual oscillators and red their complex
mean fields. The oscillators of one population are coupled through the mean phases and the degree of
synchronization
Rof the oscillators in the other population. See text for details.
http://www.tbiomed.com/content/11/1/45
and represent the natural frequencies of the oscillators. φ
Tand φ
Cdenote the phases of the oscillators of the thalamus and cortex populations, respectively. The state of each population can be described by the distribution density W (x, φ, t) = n(x)w(x, φ, t), with the conditional distribution density of oscillators denoted by w(x, φ, t) [16].
Each oscillator in the cortical population is coupled to the complex mean field
Y
T= R
Te
iθT=
n ( x )
π−π
e
iφTw ( x, φ
T, t ) d φ dx (5)
of the thalamic population and each oscillator in the thalamic population is coupled to the complex mean field
Y
C= R
Ce
iθC= n(x)
π−π
e
iφCw(x, φ
C, t)dφdx (6)
of the cortical populations (see Figure 3). Coupling strengths are denoted by K
Tand K
C, respectively.
The thalamus population is stimulated by an external stimulus that acts directly on it (see Figure 2). This stimulus is represented by the term I(t) cos(φ
T) where
I ( t ) =
⎧ ⎨
⎩
I during stimulus,
0 otherwise. (7)
A complete analysis of the model can be performed by means of the Watanabe- Strogatz (WS) theory [14]. With this theory an N-dimensional system of identical oscillators can be reduced to a three-dimensional system with the global variables ρ , φ and ψ . Here ρ is the global amplitute, φ and ψ are global phases. The origi- nal phase variables can be reconstructed from the obtained WS variables by means of the time-dependent transformation. The theory is described in more detail in the Appendix.
Following [14-16,24], we transform system (2)-(3) using Equation 36 (see Appendix) and obtain a reduced system of WS equations with the new variable ρ
T, φ
T, ψ
Tand ρ
C, φ
C, ψ
C. By additionally introducing z
a(ω
a) = ρ
ae
iφaand the phase shift α
a(ω
a) = φ
a− ψ
a, (a = T , C), we obtain
dz
T(ω
T)
dt = i ω
Tz
T(ω
T) + K
C2
Y
C− Y
C∗z
T(ω
T)
2+ I ( t ) i 2
1 + z
T(ω
T)
2, (8)
d α
T(ω
T)
dt = ω
T+ Im
z
T(ω
T)
∗(K
CY
C+ I(t)i) , (9) dz
C(ω
C)
dt = i ω
Cz
C(ω
C) + K
T2
Y
T− Y
T∗z
C(ω
C)
2, (10)
d α
C(ω
C)
dt = ω
C+ Im
z
C(ω
C)
∗K
TY
T. (11)
Here, i = √
− 1 and A
∗denotes the conjugate complex of A.
http://www.tbiomed.com/content/11/1/45
Now we consider this reduced set of equations with respect to the Ott-Antonsen manifold [25]. In this case, z(ω) no longer depends on α(ω), and the mean fields Y
Cand Y
Tcan therefore be written as
Y
a= R
ae
iθa=
n
a( x ) z
a( x ) dx, ( a = T , C ) . (12)
Following the work by Ott and Antonsen for a similar distribution [25], the integrals in Equation (12) can be calculated by applying the residue theorem, under an additional assumption that z
a(ω) (a = T, C) is analytic in the upper half-plane. This calculation yields
Y
T= z
T( ω ˜
T+ i / 2 ) , (13)
Y
C= z
C( ω ˜
C+ i / 2 ) . (14)
Thus Equation (8) for ω
T= ˜ ω
T+ i/2 and Equation (10) for ω
C= ˜ ω
C+ i/2 provide a 2-dimensional system of complex ODEs that describe the behavior of the order parameter of the thalamic and the cortex population, respectively:
dY
Tdt =
˜ ω
Ti − 1
2
Y
T+ 1 2
K
CY
C+ I ( t ) i − Y
T2K
CY
C∗− I ( t ) i
(15) dY
Cdt =
˜ ω
Ci − 1
2
Y
C+ K
T2
Y
T− Y
C2Y
T∗(16)
In the following, we will investigate this system of two complex differential equations, i.e. its dynamics during the post-stimulus interval.
Analysis of the model behavior in the post-stimulation interval
For the analysis of eqs. (15)-(16) in the post-stimulus interval, i.e. when I(t) = 0, we trans- form them to a 4-dimensional system of real ODEs via Y
T= x
T+ iy
Tand Y
C= x
C+ iy
C. This leads to
dx
Tdt = − x
T2 − ω
Ty
T+ K
C2
x
C−
x
2T− y
2Tx
C− 2x
Ty
Ty
C(17) dy
Tdt = ω
Tx
T− 1 2 y
T+ 1
2 K
Cy
C− 2x
Ty
Tx
C+
x
2T− y
2Ty
C(18) dx
Cdt = − 1
2 x
C− ω
Cy
C+ 1 2 K
Tx
T−
x
2C− y
2Cx
T− 2x
Cy
Cy
T(19) dy
Cdt = ω
Cx
C− 1 2 y
C+ 1
2 K
Ty
T− 2x
Cy
Cx
T+
x
2C− y
2Cy
T. (20)
In a next step, we linearize this new system about its fixed point x
F= ( 0, 0, 0, 0 ) and
investigate the stability of this fixed point with the coupling strengths K
Cand K
Tas
parameters. The linearized system reads:
http://www.tbiomed.com/content/11/1/45
⎛
⎜ ⎜
⎜ ⎝
dxT
dydtT
dxdtC
dydtC
dt
⎞
⎟ ⎟
⎟ ⎠ = A
⎛
⎜ ⎜
⎜ ⎝ x
Ty
Tx
Cy
C⎞
⎟ ⎟
⎟ ⎠ with (21)
A =
⎛
⎜ ⎜
⎜ ⎝
−
12−ω
T KC2
0
ω
T−
120
K2CKT
2
0 −
12−ω
C0
K2Tω
C−
12⎞
⎟ ⎟
⎟ ⎠ . (22)
A one-dimensional bifurcation diagram is displayed in Figure 4. For the calculation of this diagram, we fix one of the coupling parameters, K
C= 1.2, and show the dependence of one of the system variables (x
C) on the second coupling parameter K
T. The system has a fixed point x
F= (0, 0, 0, 0), which is stable for K
T< K
THB. At K
T=K
THB=
(ωT−ωKCC)2+1a Hopf bifurcation (HB) occurs in the system, i.e. a complex conjugate pair of eigenvalues of A passes through the imaginary axis (see Figure 4). At this point, the branch of stable fixed points (x
F, red line in Figure 4) loses its stability because it collapses into a branch of unstable periodic orbits (x
PU, blue circles). Additionally, the system exibits a fold limit cycle bifurcation (FLB) at K
TFLB< K
THB. At this bifurcation point, two periodic orbits, a stable (x
PS, green discs) and an unstable one (blue circles) are born. The bifurcation dia- gram reveals three parameter regions in which the system displays different behavior. In region I
0 < K
T< K
TFLBwe have a stable fixed point x
F= ( 0, 0, 0, 0 ) , which corresponds to the state of full desynchronization in the non-reduced system (2)-(3). In region III K
T> K
THBthe fixed point x
Fhas lost its stability and all trajectories are attracted to the
Figure 4 Bifurcation diagram. Bifurcation diagram in the
(KT−xC)-plane. The coupling strength from thecortex to the thalamus has been set to
KC=1.2 and the coupling strength
KTfrom the thalamus to the cortex is varied;
ω˜C=3 Hz and
ω˜T=7 Hz. Red line: stable fixed points (x
F), black line: unstable fixed points;
green filled circles represent the maximum and minimum of stable periodic orbits (x
PS) while the blue circles
represent the maximum and minimum of unstable periodic orbits (x
PU). Bifurcation points, i.e. the fold limit
cycle bifurcation (FLB) at
KTFLBand the Hopf-bifurcation (HB) at
KTHBare marked with vertical blue lines. The
light blue box represents the parameter region where the initially synchronized system desynchronizes in
finite time (like in Figure 1).
http://www.tbiomed.com/content/11/1/45
stable periodic orbit x
PS(filled green circles in Figure 4). This corresponds to a state near perfect synchronization of the non-reduced system. In region II
K
TFLB< K
T< K
THB, the system is bistable. It can exhibit fixed point solutions as well as periodic ones. Both behav- iors are separated by an unstable periodic orbit x
PU. Depending on the initial conditions of the system, the trajectory will stay in the region of attraction of the fixed point x
For is attracted by the stable periodic orbit x
PS.
Let us now focus on the blue region surrounding the bifurcation points FLB. It is pos- sible to choose a value of the parameter K
Tinside this region such that the trajectory is resetted to a state near the periodic orbit and drops back to the stable fixed point after a certain amount of time.
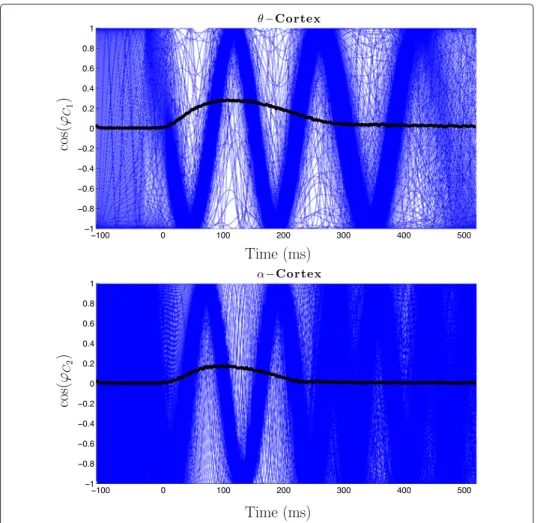
Figure 5 shows the behavior of the reduced system (left) and the corresponding behav- ior of the non-reduced system (right) for the three parameter regions described above.
Red lines in the figures of the left column indicate the maximum amplitude of the solu- tions. Black thick lines in the figures of the right column indicate the SLIs. In region I (see Figure 4), i.e. for low value of K
T, e.g. K
T= 1, the reduced system exhibits a sta- ble fix point solution (Figure 5(a), left), and the corresponding non-reduced system is in the desynchronization regime (Figure 5(a), right), hence SLI = 0. For K
Tin region III (see Figure 4), e.g. K
T= 16, the stable periodic orbit of the reduced system is shown in
Figure 5 Bifurcation behaviors. The real part of the solution of the reduced system (left) and the
corresponding cosine of the solution of the non-reduced system (right) for
(a)KT=1 in region I,
(b)KT=16
in region III and
(c)KT=5.5 in region II of Figure 4 are shown. In (c) the behavior of both systems is shown
during and after stimulation. For the reduced system, red lines indicate the maximum amplitude of the
solutions (panels in the left column). For the non-reduced system, the oscillators’ (only 200 out of
N=1000
displayed) activities are shown as blue curves, and the corresponding max SLI is plotted in black (panels in
the right column).
KC=1.2,
ω˜C=3 Hz,
ω˜T=7 Hz. The stimulus intensity was set to
I=100 and had a
duration of 50 ms for all simuli.
http://www.tbiomed.com/content/11/1/45
Figure 5(b) on the left and the corresponding synchronization regime of the non-reduced system on the right with SLI = 0.6. In Figure 5(c) K
Tis fixed near K
TFLB(K
T= 5.5, left edge of blue region in Figure 4). With this parameter choice, we observe the same dynamics as seen in the experiments: before stimulation we have desynchronization in the non- reduced system and a fix point in the reduced one. After the stimulation interval (marked with vertical dash lines), we see a phase reset, and the phases of the oscillators of the non- reduced system are now synchronized (thin wave). After some time (t > 700 ms) they desynchronize again. The length of the synchronization state can be modulated by chang- ing the distance of K
Tto K
TFLB. The closer K
Tis set to K
TFLBthe longer the trajectory will stay in the state of synchronization before it desynchronizes again.
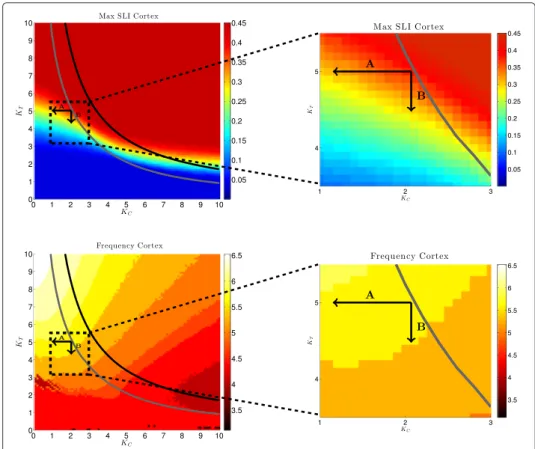
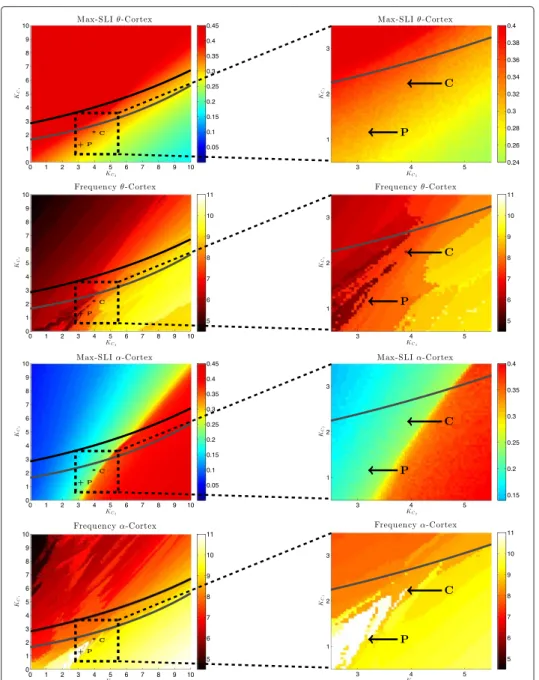
In Figure 6, top left, the maximum SLI of the cortex population for different pairs of coupling strengths ( K
C, K
T) is shown. For this we stimulated the system of two popula- tions (N = 1000 oscillators each) with a stimulation strength of I = 100 for 50 ms and calculated max
t 1 1000
1000
j=1
![Table 1 shows the SLI and the duration of synchronization for the two groups of subjects for the θ - and α -frequency band for which significant differences were found in the SLI (see [12])](https://thumb-eu.123doks.com/thumbv2/1library_info/3633003.1502293/20.892.178.718.864.1082/table-duration-synchronization-groups-subjects-frequency-significant-differences.webp)