Influence of temperature on the complex dynamic behavior of a microbial food web
Inaugural-Dissertation zur
Erlangung des Doktorgrades
der Mathematisch-Naturwissenschaftliche Fakultaet der Universitaet zu Koeln
vorgelegt von
Mar Monsonís Nomdedeu aus València
Koeln 2010
Berichterstatter: Prof. Dr. Hartmut Arndt Prof. Dr. Michael Bonkowski
Tag der Muendliche Pruefung: 28.01.2011
You are not safer in first class. Banksy. Wall and Piece. Ed. Century 2005
Because what happens will never happen, and because what has happened
endlessly happens again, we are as we were, everything has changed in us, if we speak of the world
it is only to leave the world
unsaid. Early winter: the yellow apples still unfallen
in a naked tree, the tracks of invisible deer
in the first snow, and then the snow that does not stop. We repent
of nothing. As if we could stand
in this light. As if we could stand in the silence of this single moment
of light.
Narrative. Paul Auster. Desapariciones Poemas. Ed. Pre-textos poesía.
Ich danke Prof. Hartmut Arndt fuer die Moeglichkeit zur Promotion und das spannende Forschungsthema.
Prof. Bonkowski danke ich fuer die Gutachten meiner Promotion und die Unterstuetzung bei den Statistischen Fragestellungen.
Den Kollegen der AG Arndt danke ich fuer die Unterstuetzung und die gemeinsamen Momente.
A la meua família que desde la distància han seguit el meu devenir.
L’estima i el suport rebut han sigut sempre una inspiració per trobar el meu camí.
A Michi li dedique un agraïment especial. Tu eres la sorpresa al meu somni i fas que siga millor del que m’hauria imaginat mai.
A tots els revolts, girs i nusos de la meua vida. Sense ells tot haguera
sigut més ràpid i senzill però mai tant interessant i meravellós com
ha sigut.
Introduction 1
Chapter I 8
Temperature effects on a microbial food web. Single species temperature response in model analyses of the food web.
Chapter II 26
Extrinsic temperature impact on intrinsic dynamic behaviour of an experimental food web
Chapter III 41
Predator induced colony formation of bacteria. Effects on the dynamics of a three species microbial food web model.
Discussion 57
Supplementary material 63
Abstract 67
Kurzzusammenfassung 69
Introduction
The study of population dynamics began at the early years of the last century (e.g. Volterra (1926)) with mathematical models of predator-prey systems that predicted stable limit cycles. The experimental investigation of the model followed some years later (Gause, 1935). Intrinsic processes in populations derive from density dependent population parameters like growth rate or feeding rate (see Turchin (2003)) and the interactions between the organisms in a food web. Regarding the interactions between species, interspecific competition and predation have been widely studied from the theoretical point of view. Mathematical models have been developed to investigate the relation between interspecific competition and resources availability (e.g. Hairston et al., 1960). Other models demonstrated that predation allowed the coexistence of two competing prey species when the best competitor is the preferred prey of the predator (Takeuchi and Adachi, 1983). Competition and predation are considered driving factors of the population dynamics (Chase et al., 2002).
Extrinsic factors affect organisms and their interactions but are not related either with the organisms or with their interactions. Some of those factors depend on climate parameters and are known to show nonlinear dynamics (Lorenz, 1963). One of those extrinsic factors that most affect organisms is the temperature (Clarke, 2006).
Several population parameters are temperature dependent like growth rate (Savage et al., 2004) or developmental time (Gillooly et al., 2002).
The interaction between species and the temporal dynamics derived of these interactions, can be subjected to direct and indirect temperature effects. Direct effects are constituted by temperature
1
dependent population parameters like growth rate (Savage et al., 2004), feeding rate or other metabolic processes. Such direct effects can be described through the Q
10factor which assumes a linear relation between a determined parameter and temperature, though this linear relation has been criticised (Montagnes et al., 2003).
Indirect effects are food web mediated (see Begon et al.(2006)).
Natural ecosystems are characterised by a complex network of organisms which makes it difficult to assess those indirect temperature effects (Davis et al., 1998), though their effects may be as large as the ones derived directly from temperature (Harmon et al., 2009, Stenseth and Mysterud, 2002).
Ecosystems are set to climatic variations (Stenseth et al., 2002) and the population dynamics are strongly influenced by climate parameters (Post and Forchhammer, 2002) Climate change is already affecting ecosystems (Walther et al., 2002, Root et al., 2003) and their activity (Bond-Lamberty and Thomson, 2010), thus deeper knowledge of the mechanisms driving effects on populations and their interactions is urgently needed (Winder and Schindler, 2004, Jiang and Morin, 2004, Stenseth, 2010). Several catastrophic events have been related to the actual climate change (e.g. increase of malaria risk (Paaijmans et al., 2009), amphibian mass extinction (Pounds et al., 2006)).
The main hypothesis investigated in this work was that extrinsic temperature changes can promote shifts in the dynamic behaviour of the system. Each species in the food web had a specific temperature response and thus the interactions strength should change with the temperature.
In order to assess the effects of extrinsic temperature changes on the intrinsic population dynamics is necessarily to exclude external influences from the experiments. The experiments presented in this
2
work were carried out with chemostats in a temperate bath. Such an experimental setup permitted an accurate control on external conditions, so the dynamic behaviour showed by the food web was considered to be intrinsic. A two-prey-one-predator food web was studied, this simple composition of the food web and the highly controllable experimental conditions allow a better understanding of the relation between the species reaction to temperature and its effects at the food web level.
Investigations presented here, used microbes as model organisms in order to analyze the effects of temperature on the dynamic behaviour of a two-prey-one-predator food web.
Microorganisms are especially appropriate for laboratory experiments thanks to the short generation times and the small sizes (Jessup et al., 2004) as well as to their relevance for aquatic food webs (Caron et al., 1982).
According to the model analysis made by Takeuchi and Adachi (1983), a two-prey-one-predator food web may present several dynamic behaviours including stable equilibrium, stable limit cycles and chaos. The first model predictions of intrinsic chaotic dynamics were done in the 70’s (May, 1974), though experimental demonstrations of the aforementioned dynamics are scarce (in a three species microbial food web (Becks et al., 2005), in a natural planktonic food web (Beninca et al., 2008) and in a flour beetle population (Costantino et al., 1997)).
I investigated the temperature reaction norm for each experimental species in the food web. These results were used to develop a mathematical model with temperature dependent growth rates. Numerical analyses of the model were used to investigate the food web reaction to extrinsic temperature changes, which could not be derived directly from the single species temperature norm.
3
The experimental food web that I used for my investigations was similar to that presented by Becks et al. (2005), and consisted on Tetrahymena pyriformis as predator ciliate, Pedobacter sp., and Acinetobacter johnsonii as bacterial preys. Acinetobacter presented the ability of forming grazing resistant morphologies. This is a common feature in natural systems (Juergens and Matz, 2002), and take several phenotypic expressions like production of toxins or morphological shifts in form of colonies and filaments (reviews by Juergens and Matz, 2002; and by Pernthaler, 2005).
In this study, I developed a mathematical model in cooperation with David Heckmann in order to analyze the effect of grazing resistance on the dynamic behavior of the system. Two modeling approaches were investigated and compared with a model without grazing-resistant prey: (1) a constitutive grazing resistance (the prey population presents grazing-resistant morphologies independently of the presence or absence of the predator) and (2) inducible grazing resistance (triggered by the predator abundance).
4
BECKS, L., HILKER, F. M., MALCHOW, H., JURGENS, K. & ARNDT, H. 2005.
Experimental demonstration of chaos in a microbial food web. Nature, 435, 1226-1229.
BEGON, M., TOWNSEND, C., R., HARPER, J. L. (ed.) 2006. Ecology, Oxford:
Blackwell Publishing Ltd.
BENINCA, E., HUISMAN, J., HEERKLOSS, R., JOHNK, K. D., BRANCO, P., VAN NES, E. H., SCHEFFER, M. & ELLNER, S. P. 2008. Chaos in a long-term experiment with a plankton community. Nature, 451, 822-U7.
BOND-LAMBERTY, B. & THOMSON, A. 2010. Temperature-associated increases in the global soil respiration record. Nature, 464, 579-U132.
CARON, D. A., DAVIS, P. G., MADIN, L. P. & SIEBURTH, J. M. 1982.
Heterotrophic bacteria and bacterivorous protozoa in oceanic macro- aggregates. Science, 218, 795-797.
CHASE, J. M., ABRAMS, P. A., GROVER, J. P., DIEHL, S., CHESSON, P., HOLT, R. D., RICHARDS, S. A., NISBET, R. M. & CASE, T. J. 2002. The interaction between predation and competition: a review and synthesis.
Ecology Letters, 5, 302-315.
CLARKE, A. 2006. Temperature and the metabolic theory of ecology.
Functional Ecology, 20, 405-412.
COSTANTINO, R. F., DESHARNAIS, R. A., CUSHING, J. M. & DENNIS, B.
1997. Chaotic dynamics in an insect population. Science, 275, 389-391.
DAVIS, A. J., JENKINSON, L. S., LAWTON, J. H., SHORROCKS, B. & WOOD, S. 1998. Making mistakes when predicting shifts in species range in response to global warming. Nature, 391, 783-786.
GAUSE, G. F. 1935. Experimental Demonstration of Volterra's Periodic Oscillations in the Numbers of Animals. J Exp Biol, 12, 44-48.
GILLOOLY, J. F., CHARNOV, E. L., WEST, G. B., SAVAGE, V. M. & BROWN, J. H. 2002. Effects of size and temperature on developmental time.
Nature, 417, 70-73.
HAIRSTON, N. G., SMITH, F. E. & SLOBODKIN, L. B. 1960. Community structure, population control, and competition. American Naturalist, 94, 421-425.
5
HARMON, J. P., MORAN, N. A. & IVES, A. R. 2009. Species Response to Environmental Change: Impacts of Food Web Interactions and Evolution.
Science, 323, 1347-1350.
JESSUP, C. M., KASSEN, R., FORDE, S. E., KERR, B., BUCKLING, A., RAINEY, P. B. & BOHANNAN, B. J. M. 2004. Big questions, small worlds: microbial model systems in ecology. Trends in Ecology &
Evolution, 19, 189-197.
JIANG, L. & MORIN, P. J. 2004. Temperature-dependent interactions explain unexpected responses to environmental warming in communities of competitors. Journal of Animal Ecology, 73, 569-576.
JUERGENS, K. & MATZ, C. 2002. Predation as a shaping force for the phenotypic and genotypic composition of planktonic bacteria. Antonie Van Leeuwenhoek International Journal of General and Molecular Microbiology, 81, 413-434.
LORENZ, E. N. 1963. Deterministic nonperiodic flow. Journal of the Atmospheric Sciences, 20, 130-141.
MAY, R. M. 1974. Biological populations with nonoverlaping generations - Stable points, stable cycles, and chaos. Science, 186, 645-647.
MONTAGNES, D. J. S., KIMMANCE, S. A. & ATKINSON, D. 2003. Using Q(10): Can growth rates increase linearly with temperature? Aquatic Microbial Ecology, 32, 307-313.
PAAIJMANS, K. P., READ, A. F. & THOMAS, M. B. 2009. Understanding the link between malaria risk and climate. Proceedings of the National Academy of Sciences of the United States of America, 106, 13844- 13849.
PERNTHALER, J. 2005. Predation on prokaryotes in the water column and its ecological implications (vol 3, pg 537, 2005). Nature Reviews Microbiology, 3.
POST, E. & FORCHHAMMER, M. C. 2002. Synchronization of animal population dynamics by large-scale climate. Nature, 420, 168-171.
POUNDS, J. A., BUSTAMANTE, M. R., COLOMA, L. A., CONSUEGRA, J. A., FOGDEN, M. P. L., FOSTER, P. N., LA MARCA, E., MASTERS, K. L., MERINO-VITERI, A., PUSCHENDORF, R., RON, S. R., SANCHEZ- AZOFEIFA, G. A., STILL, C. J. & YOUNG, B. E. 2006. Widespread amphibian extinctions from epidemic disease driven by global warming.
Nature, 439, 161-167.
6
ROOT, T. L., PRICE, J. T., HALL, K. R., SCHNEIDER, S. H., ROSENZWEIG, C. & POUNDS, J. A. 2003. Fingerprints of global warming on wild animals and plants. Nature, 421, 57-60.
SAVAGE, V. M., GILLOOLY, J. F., BROWN, J. H., WEST, G. B. & CHARNOV, E. L. 2004. Effects of body size and temperature on population growth.
American Naturalist, 163, 429-441.
STENSETH, N. C. 2010. The Biological Consequences of Global Change.
Integrative Zoology, 5, 85-86.
STENSETH, N. C. & MYSTERUD, A. 2002. Climate, changing phenology, and other life history and traits: Nonlinearity and match-mismatch to the environment. Proceedings of the National Academy of Sciences of the United States of America, 99, 13379-13381.
STENSETH, N. C., MYSTERUD, A., OTTERSEN, G., HURRELL, J. W., CHAN, K. S. & LIMA, M. 2002. Ecological effects of climate fluctuations.
Science, 297, 1292-1296.
TAKEUCHI, Y. & ADACHI, N. 1983. Existence and bifurcation of stable equilibrium in 2-prey, one-predator communities. Bulletin of Mathematical Biology, 45, 877-900.
TURCHIN, P. (ed.) 2003. Complex population dynamics: A theoretical/empirical synthesis, Princeton: Princeton university press.
VOLTERRA, V. 1926. fluctuations in the abundances of a species considererd mathematically. Nature, 118, 558-560.
WALTHER, G. R., POST, E., CONVEY, P., MENZEL, A., PARMESAN, C., BEEBEE, T. J. C., FROMENTIN, J. M., HOEGH-GULDBERG, O. &
BAIRLEIN, F. 2002. Ecological responses to recent climate change.
Nature, 416, 389-395.
WINDER, M. & SCHINDLER, D. E. 2004. Climate change uncouples trophic interactions in an aquatic ecosystem. Ecology, 85, 2100-2106.
7
Chapter I
Temperature effects on a microbial food web. Single species
temperature response in model analyses of the food web.
Introduction .
Species interactions and their temporal dynamics can be affected by temperature in two different ways: directly through temperature dependent population parameters like growth rate (Savage et al., 2004), feeding rate or other metabolic processes; and indirectly through food web mediated effects (Davis et al., 1998, Durant et al., 2007). Those indirect mechanisms are not easy to asses in real ecosystems due to the complexity of natural food webs (Winder and Schindler, 2004), though their effects may be as large as the ones derived directly from temperature (Harmon et al., 2009, Stenseth and Mysterud, 2002).
Due to the short generation times and the small sizes, microorganisms are especially appropriate for laboratory experiments (Jessup et al., 2004). Microorganisms are at the basis of aquatic food webs (Caron et al., 1982) and are adapted to the temperature regime of their environment (bacteria (Hahn and Pockl, 2005) and also protozoa (Gaechter and Weisse, 2006)). The experiments presented in this work run under very accurate conditions, and may help to disentangle the interaction between extrinsic and intrinsic processes affecting food webs. This knowledge is of great interest because of the ecological effects of the actual climate change (Walther et al., 2002)
The objective of my investigations was to analyze the effects of temperature on the population dynamics of a three species food web.
This consisted of two prey bacteria: Acinetobacter johnsonii and Pedobacter sp.; and a predator ciliate: Tetrahymena pyriformis. Thus I assessed the effects of temperature on the growth rates of all three species with the objective of developing a model based on experimental data. Numerical analyses of the model were run in order test following hypothesis at a theoretical level: firstly temperature
9
changes can affect the dynamic behaviour of a system; secondly, these changes cannot be extrapolated from the single species temperature response.
Materials and Methods
1. Organisms and axenic cultivation.
Tetrahymena pyriformis CCAP 1630/1W (Ciliophora, Hymenostomatia, average size 41x22 μm; provided by the Culture Collection of Algae and Protists, Windermere, U.K) was cultivated at 10°±1°C without lighting in a proteose pepetone yeast medium (PPY:
20g/l proteose pepetone, 2,5g/l yeast extract). Every 14 days the ciliates were inoculated in fresh medium.
The two bacteria were Pedobacter sp. KB11 (heparinolytic bacteria, Sphingobacteriaceae) and Acinetobacter johnsonii (α- proteobacteria, Caulobacteriaceae). Pedobacter sp. is a rod-shaped bacterium, 2x1 μm in size and was kindly provided by Klaus Juergens (Warnemuende, Germany). Acinetobacter johnsonii measures 2.5x2.5 μm in its single cell form and was kindly provided by Michael Steinert (University Kiel, Germany). Bacterial strains were kept at -80°C and cultured overnight with LB medium (10g trypton, 10g NaCl, 5g yeast extract) for 24 hours at ambient temperature before the experiments began.
2. Batch experiments
Experiments were run in sterile glass vessels filled with 150 ml of PPY100 medium (2g/l proteose peptone, 0,25g/l yeast extract).
Gentle aeration served for homogeneous mixing and sufficient oxygen content. Bacteria were inoculated from an overnight culture with an initial abundance of 1x10
5cells ml
-1and grown for 60 hours. Samples were taken with sterile syringes at 0, 12, 24, 28, 32, 36, 40, 44, 48,
10
52, 56 and 60 hours, and fixed with 2% formol in PBS buffer (8.0 gl
-1NaCl; 0.2 gl
-1KCL, Merck, Darmstadt, Germany; 1.42 gl
-1Na
2HPO
4x H
2O, Merck, Darmstadt, Germany; 0.2 gl
-1KH
2PO
4, Applichem, Darmstadt, Germany; pH 7.4) with SDS. Ciliates were inoculated after 60 hours because prior experiments showed that bacteria had reached the maximal possible abundance at that time. The initial abundance of ciliates was 5x10
3cells ml
-1. Samples were taken every 12 hours during 60 hours. The total last of the experiments was composed of the 60 hours of the bacterial growth and the 60 hours of the ciliate growth (120 hours total duration).
Samples were dyed following the frame spotting method (Maruyama et al., 2004) with Propidium iodide (50 µg ml
-1). Bacteria were enumerated with an epifluorescence microscope (Zeiss Axioskop, HXP 120, filter set 43), and the ciliate under light microscope (Zeiss Axiophot 2).
Temperature was kept constant with a thermostat (Julabo FC 600) for the experiments at 5, 15, 17.5, 25, 30, 35 °C. Experiments at 10 and 20°C were kept at constant room temperature in climate rooms.
Growth rate was calculated for the exponential growth phase.
Natural logarithms of the abundances during this period were calculated and were fitted to a linear model. The slope of this model represented the growth rate.
3. Temperature dependent functions
Several temperature dependent functions were fitted to the data with R version 2.10.1. Besides the fit of the temperature dependent models for the growth rate to the data (given by R
2), the criteria followed to decide which function should be chosen were: the number of parameters should be kept as low as possible and as far as
11
possible, those parameters should measure biological processes; that means, that they should have a biological interpretation. Also the performance of the function at the minimum and maximum temperatures where positive growth was possible was taken in account. Following functions were analyzed:
( )
( )
( )
( )
(
Topt)
opt
T T T x
opt
T e T
T r T
r
−−
⎟ ⎟
⎠
⎞
⎜ ⎜
⎝
⎛
−
= −
maxmax max
max (1)
where
2 2
1 40
400 1 ⎟⎟ ⎠
⎜⎜ ⎞
⎝
⎛ + +
= W
x W (2)
and W = Q 10 − ( T max − T opt ) (3)
r
maxrepresents the maximal growth rate, T
maxthe maximal temperature where positive growth is possible, T
optis the temperature where the growth rate takes the maximal value, T is the temperature in °C, the Q
10factor measures how much the growth rate changes when the temperature increases 10°C.
( aT bT
cT)
e r
r = max − (4)
( ) aT ( be
cT)
e r
r = max 1 − ( 5 )
for both functions r
maxis the maximal growth rate. The parameters a, b and c have no biological interpretation. T is the temperature in °C.
( ) ( ) ⎟⎟
⎠
⎜⎜ ⎞
⎝
⎛ ⎟⎟ ⎠
⎜⎜ ⎞
⎝
⎛ − − −
+
= − − 1
ln 1 ln
1 2
2 1 1
max
opt
opt
T T
T
T R
R R R
b r
r (6)
12
where r
maxis the maximal growth rate, T is the temperature in °C, T
optis the temperature where maximal growth rate takes place.
Parameters R
1and R
2have no biological interpretation.
⎟ ⎟
⎠
⎞
⎜ ⎜
⎝
⎛ ⎟⎟ ⎠
⎜⎜ ⎞
⎝
− ⎛
⎟⎟ ⎠
⎜⎜ ⎞
⎝
⎟ ⎛
⎟
⎠
⎞
⎜ ⎜
⎝
⎛ ⎟⎟ ⎠
⎜⎜ ⎞
⎝
− ⎛
⎟⎟ ⎠
⎜⎜ ⎞
⎝
⎛
+ +
=
k ah h ah l
al k al
T T T T T
T T T
e e
r r 1
max (7)
r
maxrepresents the maximal growth rate, T
kis the temperature in °K, T
hand T
lare respectively the maximal and minimal temperatures where positive growth is possible. T
aland T
ahare respectively the low and high Arrhenius temperatures and are related with the concept of activation energy of the Arrhenius function.
4. Mathematical model
The mathematical model was implemented with R version 2.10.1. The same program was used for the statistical analyses.
Results
1. Temperature dependent growth rates
Pedobacter sp.: the best fit (R
2= 0.96) was given by equation 7 with the following parameter values: r
maxis 3.56 d
-1, T
aland T
ahare 40422.29, 75273.69 respectively, T
lis 277. 63°K, and T
his 305.91°K.
13
0 10 20 30 40
-2 -1 0 1 2
Tempertaure [°C]
Gr o w th r a te [ 1 /d ]
Fig.1: Mean growth rate (d
-1) of triplicate experiments vs. temperature (°C) for Pedobacter sp..
Line represents the function (7) fitted to experimental data.
This function presented a broad range where the growth rate took maximum values, between 10 and 30°C. The maximal growth rate obtained experimentally was 2.92±0.17 d
-1at 15°C. The minimal temperature where there was still a positive growth rate was below 5.5°C. The maximal temperature at which positive growth rate was possible must lie between 30°C and 35°C. All those characteristics obtained experimentally were reflected by the model.
Acinetobacter: the function that best fitted (R
2=0.79) the data was equation (6) where r
maxis 2.71 d-1, T
optis 24.55°C, and b is 13.33, R
1is 1.07 and R
21.09.
14
0 10 20 30 40
-2 -1 012 34
Temperature[°C]
g ro w th r a te [1 /d ]
Fig.2: Mean growth rate (d
-1) of triplicate experiments vs. temperature (°C) for Acinetobacter sp.. Line represents the function (6) fitted to experimental data.
The maximal growth rate obtained experimentally was 3.67±0.87 d
-1at 25°C. The minimum temperature with a positive growth rate was between 5°C and 10°C, the maximum temperature allowing a growth should lie between 30°C and 35°C. The temperature dependent function fulfilled all those characteristics of the experimental data, although the maximal growth rate (with an optimized parameter value of 2.73 d
-1) was underestimated, and the optimal temperature given by the model (24.55°C) was slightly lower than the experimental value.
Tetrahymena pyriformis: both bacteria strains were offered as a food source separately so a direct comparison of Tetrahymena growth rates feeding on each bacterium was possible, allowing the consideration of a possible food preference of Tetrahymena (Fig.4).
The function that best fitted the data in both cases (R
2=0.77 for Tetrahymena feeding on Pedobacter, and R
2=0.83 when feeding on Acinetobacter) was equation (7) where the parameter values are (values in brackets are from the experiment where Tetrahymena fed on Acinetobacter) 1.98 d
-1(2.28 d
-1) for r
max, T
alwas 42081.57
15
(49382.93), T
ahwas 72444.94 (63887.17), T
lwas 282.42 °K (280.90°K), and T
hwas 305.27°K (305.99°K).
A B
0 10 20 30 40
-4 -3 -2 -1 0 1 2
Tempertaure [°C]
G row ht ra te [ 1 /d ]
0 10 20 30 40
-4 -3 -2 -1 0 1 2
Tempertaure [°C]
G row ht ra te [ 1 /d ]
Fig.3: Mean growth rate (d
-1) of triplicate experiments vs. temperature (°C). Line represents the function (7) fitted to experimental data. A: Tetrahymena feeding on Pedobacter, and B:
Tetrahymena feeding on Acinetobacter.
In order to asses if the growth rate differed with each bacterium as a food source, the data were divided in three groups (from 5 to 15°C, from 15 to 30 °C, and from 30 to 35°C) and fitted to linear models. The slopes of the linear regressions were compared with a two-way ANOVA. The analysis showed no significant differences of the growth rate depending on the food source (P=0.93, F=0.01 for the group from 5 to 15°C; P=0.45, F=0.88 for the group from 15 to 30°C; P=0.82, F=0.80 for the group from 30 to 35°C.).
Mathematical model
A mathematical model of the Lotka-Volterra type was developed to test the effects of temperature on the population dynamics. The model was based on experimental results of the growth rates of the organisms that formed the food web. Experiments showed that the growth rate for Pedobacter and Tetrahymena did not change
16
significantly for temperatures between 15 and 25°C (ANOVA:
F=0.4256, p>0.05 for Tetrahymena; F=2.193, p>0.05), and the temperature dependent function showed consequently maximal growth rates for a broad range of temperatures. In order to keep the model as simple as possible, only the function with temperature dependent growth rate for Acinetobacter was introduced.
The model consisted of the following differential equations:
( C 0 C ) D 1 1 ( ) C N 1 2 2 ( ) C N 2 t
C = − − ε μ − ε μ
∂
∂
,
(8)
( ) 1 ( ) 1 1
1 1
1 N C P N DN
t
N = − −
∂
∂ μ ϕ , (9)
( ) 2 ( ) 2 2
2 2
2 N C P N DN
t
N = − −
∂
∂ μ ϕ
,
(10)
( ) N P ( ) N DP t P
P = + −
∂
∂
2 2 2 1
1
1 ϕ β ϕ
β , (11)
where C is the nutrient concentration, N
1the abundance of Acinetobacter, N
2the abundance of Pedobacter and P the abundance of Tetrahymena. The growth rates of the bacteria, µ
1and µ
2follow the Monod function, the same as Tetrahymena feeding response, φ
1and φ
2, which was assumed to be of the Holling II type:
C K
C
i i
s i = μ max +
μ (12)
( )
i N
i i
i K N
N N
i i
= ϕ max +
ϕ (13)
The parameter ε
irepresents the bacterial yield and took the same value for ε
1and ε
2(2x10
6µgC/ind
prey); β
iis the predator yield and took the value 1/4000 ind
predator/ind
preyfor both β
1and β
2; C
0represents the inflow nutrient concentration and was 3 µgC/ml. The
17
bacterial growth rate was controlled by two parameters, for Pedobacter those parameters were µ
max1=0.15 h
-1and K
s1=0.0274 µgC/ml; for Acinetobacter µ
max2was substituted through the temperature dependent function (equation (2)), K
s2=0.002 µg/ml.
The feeding response of Tetrahymena followed the expression (9) which parameters are φ
max1=150 ind
prey/h ind
predator, and K
N1=422000ind
prey/ml for Pedobacter; and φ
max2=450 ind
prey/ind
predatorand K
N2=400000ind
prey/ml. The units for all the state variables were µC/ml, so a transformation from individuals in these units was done with the following factors: 1.241x10
-7µgC/ind for Acinetobacter, 5.72x10
-8µgC/ind for Pedobacter, and 6.5507x10
-3µgC/ind for Tetrahymena.
The flow rate was used as bifurcation parameter for numerical analysis at 20 and 25°C. According to the experimental results, in this temperature range species react differentially, the growth rate of Acinetobacter increased significantly (1-way ANOVA, P=0.0012, F=14.83) while Tetrahymena and Pedobacter did not show any changes. I analyzed how the different temperature reaction norms of the species affected the reaction to temperature of the whole food web. Sensitivity analysis of the model at 20°C showed that coexistence for all three species was possible for flow rates between 0.2d
-1and 1.52d
-1, at a flow rate of 1.53 Pedobacter was predicted to go extinct. The model predicts a stable equilibrium for all analyzed flow rates. At 25°C the coexistence interval was smaller than at 20°C and ranged from 0.2d
-1to 1.19 d
-1higher flow rates led to the extinction of Pedobacter. The dynamical behaviour predicted in this case was also stable equilibrium for all flow rates analyzed.
In a second investigation of the model, the temperature was changed during the run. At low flow rates, the stabilization period was very long, and the temperature effect almost unseeable (Fig. 4, A).
18
With increasing flow rates, the abundances relation changed after the temperature had reached 25°C. At a flow rate of 0.8 d
-1(Fig 4, B) the abundance of Acinetobacter was higher than the abundance of Pedobacter after the temperature had changed. Pedobacter went extinct at a flow rate of 1.2 d
-1. In this scenario the coexistence range was smaller than when the temperature was constant during the complete run (at 20 and 25°C).The phase space diagrams show that the system reaches different attractors at 25°C (Fig. 4).
Fig.4: Time series and phase space diagrams of model results. A run at 0.4 d-1, B at 0.8 d-1 and C at 1.2 d-1. A’, B’, and C’ represent the corresponding phase space diagrams; the temporal development follows the rainbow colors beginning in the red region and finishing in blue.
19
Discussion
The results of the experiments presented here lighten the following main assertion: the different temperature response of the species in a food web can affect the species interactions.
Temperature dependence of the growth rate is an autecological question that is linked to the concept of ecological niche (Begon et al., 2006). This has turned to be a major question in ecology derived from the necessity of predicting the consequences of climate change.
These predictions are based on mathematical models, but oversimplification can lead to false conclusions (Soetaert and Herman, 2009). Temperature reaction norms are species specific (Gaechter and Weisse, 2006, Clarke, 2006, Hahn and Pockl, 2005), and this ecological complexity has to be taken in account in the model predictions.
The growth rate data for Tetrahymena presented here differ slightly from other data found in the literature, although these data are also discrepant within the different authors. Schmid (1967) measured the optimal growth rate of Tetrahymena at 28°C , while Slater (1954) did it at 25°C and Elliott (1973) at 32.5°C . Our results show a broad range of temperatures (from 15 to 25°C) where the growth rate of the ciliate did not change significantly (ANOVA:
F=0.4256, p>0.05) and the temperature dependence function that best fitted the data also had this characteristic. The publications cited above concentrated on determining such parameters as optimal or maximal temperature and Schmid (1967) also differentiated between growth rate (somatic growth) and multiplication rate (population growth), this hindered a direct comparison of the results because our interest was to find a continuous function which would express the growth rate as a temperature dependent equation. Regarding the
20
maximal growth rate, the model fitted for each bacterium as a food source gave similar results in both cases (32.12°C feeding on Pedobacter and 32.74°C feeding on Acinetobacter) and both values were lower than those found by Slater (1954) and by Elliott (1973) (35 and 36.6 °C respectively). This difference can be due to the food resource: none of the bacteria was able to grow at 35°C so no food resources were available at this temperature for Tetrahymena. It is possible that our strain of Tetrahymena is able to grow at temperatures higher than 32°C but our interest lay not only in the temperature dependence but also on the food web interactions, so no other food source was analyzed. Regarding the minimal temperature where positive growth is possible, experimental data indicated that it must be between 5 and 10°C for Tetrahymena feeding on both bacterial strains. Both models supported this supposition with optimized parameter values at 9.27°C for the experiments with Pedobacter as food source, and 7.75°C for those experiments where Tetrahymena fed on Acinetobacter.
The bacteria used for our experiments: Pedobacter sp. and Acinetobacter johnsonii were isolated from lake Schoehsee (Germany) by Kristin Beck (Beck, 2000) and very few is known about their ecological performance except some experiments done previously in our working group for Pedobacter.(Becks, 2003). The temperature range where both bacteria were able to grow represented the range of a temperate lake in central Europe indicating an adaptation of both bacteria at the temperature regime from the region where they were isolated (Hall et al., 2009).
Nevertheless they showed significant differences. On one hand the growth rate of Pedobacter did not change significantly between 15 and 25°C (ANOVA: F=2.193, p>0.05), instead of that, Acinetobacter presented a clear optimal temperature at 25°C. On the other hand Pedobacter showed a better performance at low temperatures than
21
Acinetobacter being able to grow at 5°C. However, the temperature dependent function fit performed quite well and predicted a negative growth rate at 4.48°C. Both bacteria showed negative growth rates at 35°C, the model fitted to Pedobacter data had the maximal temperature where positive growth is possible as a parameter and the optimized value was 32.76°C which is a possible value according to the experimental results; the model fitted to Acinetobacter did not have this extreme temperature as a parameter but performed well graphically (see Fig. 5).
Sensitivity analysis of the model revealed a temperature effect on the coexistence range of the system. At 25°C, Pedobacter went extinct at a lower flow rate than at 20°C. This could be due to a food web effect because Acinetobacter has a higher growth rate at 25°C than at 20°C and therefore the competition pressure on Pedobacter is higher at 25°C.
Our results show that the population dynamics change when the temperature increases from 20 to 25°C. Observation of the time series (see Fig.4) indicated that the only species that benefits of the temperature increase is Acinetobacter. The maximal growth rate for Acinetobacter was predicted to be at 24.55 °C. The complexity of the food web response can be seen in the phase-space diagrams (see Fig.
5). The first thing visible on those diagrams is that the system changes the attractor when the temperature increases. This new attractor is set in the three dimensional space at higher abundances of Acinetobacter and Tetrahymena, reflecting also a benefit for the predator that was not observable on the time series. This indicates a food web effect, and means that although Tetrahymena does not grow better at 20 than at 25°C, it profits from the higher prey abundance. This food web effects regarding temperature response have been already observed experimentally in several investigations (competition between Colpidium and Paramecium (Jiang and Morin,
22
2004) field experiments with pea Aphids (Harmon et al., 2009) changing food web structure (Petchey et al., 1999)). Until now no data are available regarding dynamic behaviour.
The model presented here is based on experimental data and shows a complex response of a two-prey-one-predator food web to temperature that cannot directly be derived from the species specific temperature norm. The complexity of food web interactions and the interplay between those interactions and the single species autecology needs to be better understood in order to improve our management capacity concerning the actual climate change (Stenseth, 2010). Experimental microbial food webs can permit deeper insights of this interplay.
23
BECK, K. 2000. Experimentelle UEberpruefung der „Intermediate Disturbance Hypothesis” (Connell 1978) an Modell-Lebensgemeinschaften planktischer Bakterienisolate. PhD Thesis, Christian-Albrechts Universitaet.
BECKS, L. 2003. Chaotisches Verhalten - ein allgemein gueltiges Phaenomen in zwei-Beute-ein-Raeuber Sytemen? - Bakterien-protozoen Interaktionen im Chemostaten. Master Thesis, Universitaet zu Koeln.
BEGON, M., TOWNSEND, C., R., HARPER, J. L. (ed.) 2006. Ecology, Oxford:
Blackwell Publishing Ltd.
CARON, D. A., DAVIS, P. G., MADIN, L. P. & SIEBURTH, J. M. 1982.
Heterotrophic bacteria and bacterivorous protozoa in oceanic macro- aggregates. Science, 218, 795-797.
CLARKE, A. 2006. Temperature and the metabolic theory of ecology.
Functional Ecology, 20, 405-412.
DAVIS, A. J., JENKINSON, L. S., LAWTON, J. H., SHORROCKS, B. & WOOD, S. 1998. Making mistakes when predicting shifts in species range in response to global warming. Nature, 391, 783-786.
DURANT, J. M., HJERMANN, D. O., OTTERSEN, G. & STENSETH, N. C.
2007. Climate and the match or mismatch between predator requirements and resource availability. Climate Research, 33, 271-283.
ELLIOTT, A. M. (ed.) 1973. Biology of Tetrahymena: Dowden, Hutchinson &
Rosi inc.
GAECHTER, E. & WEISSE, T. 2006. Local adaptation among geographically distant clones of the cosmopolitan freshwater ciliate Meseres corlissi. I.
Temperature response. Aquatic Microbial Ecology, 45, 291-300.
HAHN, M. W. & POCKL, M. 2005. Ecotypes of planktonic Actinobacteria with identical 16S rRNA genes adapted to thermal niches in temperate, subtropical, and tropical freshwater habitats. Applied and Environmental Microbiology, 71, 766-773.
HALL, E. K., DZIALOWSKI, A. R., STOXEN, S. M. & COTNER, J. B. 2009. The effect of temperature on the coupling between phosphorus and growth in lacustrine bacterioplankton communities. Limnology and Oceanography, 54, 880-889.
HARMON, J. P., MORAN, N. A. & IVES, A. R. 2009. Species Response to Environmental Change: Impacts of Food Web Interactions and Evolution.
Science, 323, 1347-1350.
JESSUP, C. M., KASSEN, R., FORDE, S. E., KERR, B., BUCKLING, A., RAINEY, P. B. & BOHANNAN, B. J. M. 2004. Big questions, small
24
worlds: microbial model systems in ecology. Trends in Ecology &
Evolution, 19, 189-197.
JIANG, L. & MORIN, P. J. 2004. Temperature-dependent interactions explain unexpected responses to environmental warming in communities of competitors. Journal of Animal Ecology, 73, 569-576.
MARUYAMA, F., YAMAGUCHI, N., KENZAKA, T., TANI, K. & NASU, M. 2004.
Simplified sample preparation using frame spotting method for direct counting of total bacteria by fluorescence microscopy. Journal of Microbiological Methods, 59, 427-431.
PETCHEY, O. L., MCPHEARSON, P. T., CASEY, T. M. & MORIN, P. J. 1999.
Environmental warming alters food-web structure and ecosystem function. Nature, 402, 69-72.
SAVAGE, V. M., GILLOOLY, J. F., BROWN, J. H., WEST, G. B. & CHARNOV, E. L. 2004. Effects of body size and temperature on population growth.
American Naturalist, 163, 429-441.
SCHMID, P. 1967. Temperature adaptation of growth and division process of Tetrahymena pyriformis. 1. Adaptations phase. Experimental Cell Research, 45, 460-&.
SLATER, J. V. 1954. Temperature tolerance in Tetrahymena. American Naturalist, 88, 168-171.
SOETAERT, K. H., P .M. J. (ed.) 2009. A practical guide to ecological modelling. Using R as a simulation platform: Springer.
STENSETH, N. C. 2010. The Biological Consequences of Global Change.
Integrative Zoology, 5, 85-86.
STENSETH, N. C. & MYSTERUD, A. 2002. Climate, changing phenology, and other life history and traits: Nonlinearity and match-mismatch to the environment. Proceedings of the National Academy of Sciences of the United States of America, 99, 13379-13381.
WALTHER, G. R., POST, E., CONVEY, P., MENZEL, A., PARMESAN, C., BEEBEE, T. J. C., FROMENTIN, J. M., HOEGH-GULDBERG, O. &
BAIRLEIN, F. 2002. Ecological responses to recent climate change.
Nature, 416, 389-395.
WINDER, M. & SCHINDLER, D. E. 2004. Climate change uncouples trophic interactions in an aquatic ecosystem. Ecology, 85, 2100-2106.
25
Chapter II
Extrinsic temperature impact on intrinsic dynamic behaviour of an experimental food web
Introduction
Intrinsic population dynamics have been of interest for biologists since the early 20
thcentury from a theoretical point of view (Volterra, 1926) and also experimentally (Gause, 1935). Intrinsic population dynamics derive from the organisms densodependent growth and their interactions. Within those interactions, interspecific competition and predation have been widely studied (HilleRisLambers and Dieckmann, 2003, Jost et al., 1973) and are considered driving factors of the population dynamics (Chase et al., 2002). At the early 70’s the existence of intrinsic chaotic dynamics in biological systems was first theoretically shown (May, 1974), this opened a discussion about the importance of this type of dynamics in natural systems (Cushing et al. 2003). Since then, only few experiments showed the existence of chaotic dynamics: in a three species microbial food web (Becks et al., 2005), in a natural planktonic food web (Beninca et al., 2008) and in a flour beetle population (Costantino et al., 1997)
Extrinsic factors affect organisms and their interactions but do not derive from the organisms themselves. Some of those factors depend on climate and weather and are known to show chaotic behaviour (Lorenz, 1963). Temperature is one of those extrinsic factors that most affect organisms (Clarke, 2006), but each population has a different reaction to temperature (Hahn and Pockl, 2005, Gaechter and Weisse, 2006). The interaction between direct and indirect (food web mediated) temperature effects on populations need to be better understood in frame of the actual global warming.
As a consequence of climate change, the global warming is already affecting ecosystems (Walther et al., 2002, Stenseth et al., 2002), thus deeper knowledge of the mechanisms underlying the relation between intrinsic and extrinsic processes in food webs is urgently 26
needed. in order to avoid catastrophic consequences of global warming (Wake and Vredenburg, 2008).
In this work I studied the effects of a temperature increase from 20 to 25°C on a two-prey-one-predator microbial food web.
Chemostat experiments allow long term investigations under very constant conditions besides allowing the experimenter to determine some external parameters. In this case the flow rate and temperature were manipulated. This simple food web structure allows a deep analysis of the populations but it still offers the possibility of complex nonlinear dynamics (Takeuchi and Adachi, 1983, Becks et al., 2005).
Experiment results show that temperature increase induces a change in the population dynamics of the system that cannot be explained only through the single species temperature reaction norm. Model analyses support qualitatively these results.
Materials and Methods
1. Organisms and axenic cultivation.
The prey organisms were Pedobacter sp. (heparinolytic bacteria, Sphingobacteriaceae fam. nov.) kindly provided by Klaus Juergens (Warnemuende, Germany) and Acinetobacter johnsonii (α- proteobacteria, Caulobacteriaceae), kindly provided by Michael Steinert (Braunschweig, Germany). Pedobacter sp. is a rod-shaped bacterium, 2x1 µm in size. Acinetobacter johnsonii measures 2.5x2.5 µm in its single cell form. Bacterial strains were kept at -80°C and the experimental inoculum was obtained from overnight cultures with LB medium (10g trypton, 10g NaCl, 5g yeast extract) set 24 hours at ambient temperature before the experiments began. The predator Tetrahymena pyriformis CCAP 1630/1W (Ciliophora, Hymenostomatia, average size 85x22 µm; provided by the Culture Collection of Algae and Protists, Windermere, U.K) was cultivated at 27
20°C under dark conditions in a proteose pepetone yeast medium (PPY: 20g/l proteose pepetone, 2.5g/l yeast extract). Every 14 days the medium was renewed.
2. Experimental setup
One stage chemostats were filled after sterilization with 190 ml medium (proteose peptone yeast medium in a 1:100 dillution: 2g/l proteose peptone, 2.5 g/l yeast extract). Continuous fresh medium inflow was provided by syringe pumps (Cavro XLP6000 Tecan ®, Crailsheim, Germany) at three flow rates: 0.45±0.004d
-1, 0.5±0.004 d
-1, 0.75±0,004 d
-1. Temperature was kept constant with a thermostat (Julabo FC 600).at the desired temperature ±0.3 °C.
Gentle aeration ensured oxygenic conditions and homogeneous mixing.
Triplicate samples were taken daily through a computer controlled system consisting of a robot (RSP9000 Cavro Tecan ® Crailsheim, Germany), a syringe pump (Cavro XLP6000 Tecan ®, Cairlsheim, Germany) and a valve system (Smart valve, Tecan®, Carlsheim, Germany) 0.5 ml sample were fixed with 2% formol in PBS buffer (Phosphate buffered saline: 8.0 gl
-1NaCl; 0.2 gl
-1KCL, Merck, Darmstadt, Germany; 1.42 gl
-1Na
2HPO
4x H
2O, Merck, Darmstadt, Germany; 0.2 gl
-1KH
2PO
4, Applichem, Darmstadt, Germany; pH 7.4). Samples were stained following the frame spotting method (Maruyama et al., 2004) with CYBR green I (Invitrogen, Karlsruhe, Germany, 1:5000 dilution from original stock with distilled sterile water). Enumeration took place under epifluorescence microscope (Zeiss Axiophot, filter set 43, 1250 times magnification for the bacteria, 125 times for the ciliate). Lyapunov exponents were calculated with the TISEAN package (Hegger et al., 1999) implemented with R following the algorithm described by Rosenstein (Rosenstein et al., 1993)
28
3. Mathematical model
Numerical analyses of the mathematical model were implemented with R 2.10.1 (see supplementary material).
Results
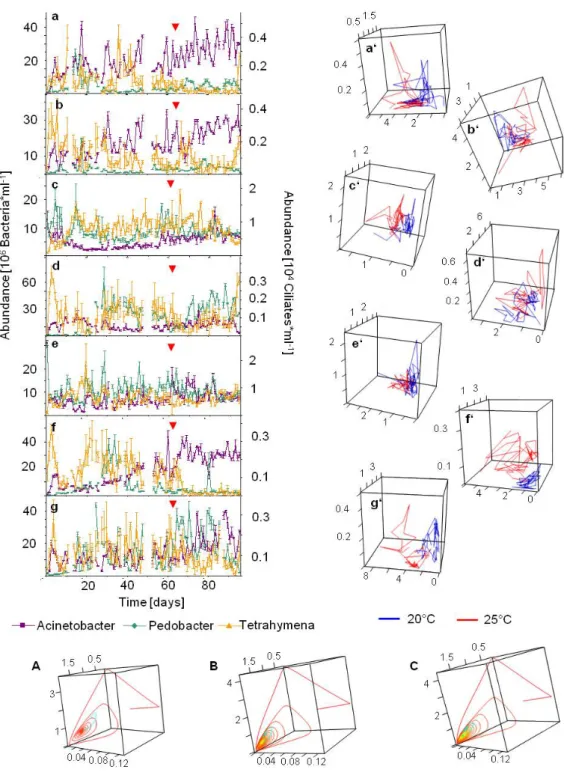
Chemostat experiments could be run under constant conditions and free of contamination through other organisms for 95 days (see Fig. 1). In order to avoid a temperature shock, the heating process took place progressively from day 59 to day 63 (1°C per day) for the onsets A, B, D, F and G; for onsets C and E temperature was gradually enhanced from day 55 to day 61.
Population dynamics were assessed through observation of the time series and supported by the calculation of the Lyapunov exponents. Only when both analyses coincided the resulting population dynamic was considered to be true.
At 20°C almost all onsets showed irregular dynamics, only in onset B, observation of the time series indicates that Pedobacter reached a stable equilibrium after a long period of stabilization of 14 days; calculation of the Lyapunov exponent between days 14 and 47 confirm this first impression and take negative values (-0.18±0.017).
For onset A, the Lapunov exponent for Acinetobacter at 20°C takes values near to 0 (0.025±0.028) which is indicative of stable limit cycles, this is not observable on the time series and therefore, according to the criteria aforementioned, not taken in account for the conclusions. The values of the Lyapunov exponents for all species in all onsets are positive (see Fig 2), this indicates the existence of
29
chaotic behaviour and coincides with the observation of the time series.
Fig 1: Time series of chemostat experiments and the corresponding phase space diagrams.
Onsets a, b, and c run at a flow rate of 0.75 d
-1; d and e at 0.5 d
-1; and f and g at 0.45 d
-1. Red arrows indicate the point where temperature increase began. On the left side are the corresponding phase space diagrams. A, B and C are the phase space diagrams of the model analyses at 0.75 d
-1, 0.5 d
-1, and 0.45d
-1respectively.
30
At 25°C and for onsets A and B, Pedobacter and Tetrahymena showed stable limit cycles that were clearly observable especially in onset A (see Fig. 1). This dynamic behaviour cannot be seen for Acinetobacter. The Lyapunov exponents are in this case near to zero for all three species and both onsets supporting the impression given by the time series. In onset G, Pedobacter and Tetrahymena showed in the time series a stable equilibrium, but the Lyapunov exponents took positive values, thus again, this statement was not considered conclusive.
15 25
-0 .1 0 .00 .1 0 .20 .3
a
T[°C]
LE
15 25
-0 .2 -0 .1 0 .0 0 .1 0 .2 0 .3
b
T[°C]
LE
15 25
0. 00 0 .10 0 .2 0 0. 30
c
T[°C]
LE
15 25
0. 00 0 .10 0. 20 0. 3 0
d
T[°C]
LE
15 25
0 .0 0 0. 1 0 0. 20 0. 30
e
LE
T[°C]
15 25
0 .0 0 0. 1 0 0. 20 0. 30
f
LE
T[°C]
15 25
0 .0 0 0. 1 0 0. 20 0. 30
g
LE
T[°C]
Acinetobacter Pedobacter Tetrahymena
Fig 2: Lyapunov exponents at 20 and 25°C. a, b, and c run at a flow rate of 0.75 d
-1, d and e at 0.5 d
-1, f and g at 0.45 d
-1.
31
Phase space diagrams for all experimental onsets were done in order to observe changes in the dynamic behaviour that could not be assessed with the Lyapunov exponents or through the observation of the time series. In those diagrams it can be seen that the system shifted to another attractor after the temperature was changed (see Fig. 1). The general tendency of this new attractor was directed towards higher abundances of Acinetobacter for all the experimental onsets. However, phase space diagrams lighten a different reaction depending on the flow rate, then the attractor shifted more abruptly at a flow rate of 0.45 d
-1(onsets F and G) than for the other flow rates analyzed, and this shift was bidimensional because Tetrahymena and Acinetobacter reached higher abundances. For the onsets that run at 0.5 d
-1and 0.75 d
-1the attractor only changed slightly, however it still can be seen that the system shifted towards higher abundances of Acinetobacter reaching so a new attractor.
The same scenario was analyzed with a mathematical model that consisted on four differential equations:
( C 0 C ) D 1 1 ( ) C N 1 2 2 ( ) C N 2 t
C = − − ε μ − ε μ
∂
∂ (1)
( ) 1 ( ) 1 1
1 1
1 N C P N DN
t
N = − −
∂
∂ μ ϕ (2)
( ) 2 ( ) 2 2
2 2
2 N C P N DN
t
N = − −
∂
∂ μ ϕ (3)
( ) N P ( ) N DP t P
P = + −
∂
∂
2 2 2 1
1
1 ϕ β ϕ
β (4)
32
where C represents the nutrient concentration, N
1and N
2the abundances of Pedobacter and Acinetobacter respectively, and P the abundance of Tetrahymena. The growth rates of the prey organisms, µ
1and µ
2follow the Monod function, the same as the predator feeding response for each bacterial prey, φ
1and φ
2, which was assumed to be of the Holling II type:
C K
C
i i
s i = μ max +
μ ( )
i N
i i
i K N
N N
i i
= ϕ max + ϕ
(5) (6)
The parameter ε
iis the bacterial yield and took the value 2x10
6µg/ind
preyfor ε
1and ε
2; β
iis the predator yield and took the value 1/4000 ind
predator/ind
preyfor both β
1and β
2; C
0represents the nutrient concentration of the inflow and was 3 µg/ml. The feeding response of Tetrahymena followed the expression (9) which parameters are φ
max1=150 ind
prey/h ind
predator, and K
N1=422000ind
prey/ml for Pedobacter; and φ
max2=450 ind
prey/ind
predatorand K
N2=400000ind
prey/ml.The bacterial growth rate was controlled by two parameters µ
iand K
si, for Pedobacter those parameters were µ
max1=0.15 h
-1and K
s1=0.0274 µg/ml; for Acinetobacter K
s2was 0.002 µg/ml, and µ
max2was variable and took its values from the temperature dependent function:
( ) ( ) ⎟⎟
⎠
⎞
⎜⎜ ⎝
⎛ ⎟⎟ ⎠
⎜⎜ ⎞
⎝
⎛ − − −
+
= − − 1
ln 1 ln
1 2
2 1 1
max
opt
opt