SFB 823
Tone onset detection using an auditory model
Discussion Paper
Nadja Bauer, Klaus Friedrichs,Dominik Kirchhoff, Julia Schiffner, Claus Weihs
Nr. 50/2012
Tone Onset Detection Using an Auditory Model
Nadja Bauer, Klaus Friedrichs, Dominik Kirchhoff, Julia Schiffner and Claus Weihs
Chair of Computational Statistics, Faculty of Statistics, TU Dortmund {bauer,friedrichs,kirchhoff,schiffner,weihs}
@statistik.tu-dortmund.de
Abstract. Onset detection is an important step for music transcription and other tasks frequently encountered in music processing. Although several ap- proaches have been developed for this task, neither of them works well under all circumstances. In Bauer et al. (2012) we investigated the influence of sev- eral factors like instrumentation on the accuracy of onset detection. In this work, this investigation is extended by a computational model of the human auditory periphery. Instead of the original signal the output of the simulated auditory nerve fibers is used. The main challenge here is combining the out- puts of all auditory nerve fibers to one feature for onset detection. Different approaches are presented and compared. Our investigation shows that using the auditory model output leads to essential improvements of the onset de- tection rate for some instruments compared to previous results.
1 Introduction
A tone onset is the time point of the beginning of a musical note or other sound. A tutorial on basic onset detection approaches is given by Bello et al.
(2005). The algorithm we will use here is based on two approaches proposed in Bauer et al. (2012): In the first approach the amplitude slope and in the second approach the change of the spectral structure of an audio signal are considered as indicators for tone onsets. In Section 2 we briefly describe these two approaches.
Since the human ear still is the best system for onset detection the onset detection approach is extended by using the output of an auditory model instead of the original signal. A similar idea was proposed in Benetos et al.
(2009) where the extension led to improved results. In contrast to our work in
their study two other features are used for onset detection (spectral flux and group delay). Furthermore, they use fixed parameter settings for the detection algorithm while the goal of our study is to explore different settings by an experimental design.
Section 3 describes the auditory model utilized for this study. As the out- put is a multidimensional time series the onset detection indicators of all dimensions have to be combined to one indicator. Therefore, in Section 4 we propose several combination strategies.
To test our approach we use randomly generated tone sequences of six music instruments with two tempo settings. Section 5 provides the detailed generation procedure. Section 6 presents the results in respect of the music instruments, the tempo and the chosen combination strategy. Additionally, the results of the extended approach are compared to the results of the ap- proach based on the original signal proposed in Bauer et al. (2012). Finally, Section 7 summarizes the work and provides ideas for future research.
2 Onset Detection Approach
The ongoing audio signal is split up into T windows of lengthL samples with an overlap ofOper cent ofL. In each window (starting with the second) two features are evaluated: The difference between amplitude maxima (FA) and the correlation coefficient between the spectra (FS) of the current and the previous window, respectively. Each of the vectorsFAandFSis then rescaled into the interval [0,1].
For each window a combined featureCombFcan be calculated asCombF= WA·FA+ (1−WA)·FS, where the weightWA∈[0,1]is a further parameter, which specifies the influence of the amplitude based feature on the weighted sum. In Bauer et al. (2012) we investigated further combination approaches and this approach provided the best results. Let detect(s,L,O,WA) denote the onset detection function which returns the CombF-vector for the audio signalsdepending onL,OandWA.
In the following, we describe the peak-picking procedure, which consists of two steps: thresholding of the onset detection function and localization of tone onsets. In order to assess if a window contains a tone onset, based on CombF, a threshold is required. We will use here a Q%-quantile of the CombF-vector as such threshold. If the CombF-value for the current win- dow, but neither for the preceding nor for the succeeding window, exceeds the threshold, an onset is detected in this window. If the threshold is exceeded
Tone Onset Detection Using an Auditory Model 3
in multiple, consecutive windows, we assume that there is only one onset, lo- cated in that window with the maximalCombF-value in this sequence. This is a simple fixed thresholding approach, but as we consider only music sig- nals with little dynamics, it is assumed to be appropriate here (see Bello et al. (2005)). For each window with an onset detected its beginning and ending time points are calculated and the onset time is then estimated by the centre of this time interval. Letonsets(CombF,Q)denote the onset estimation function which returns for the onset detection featureCombF =detect(s,L,O,WA) and quantileQthe estimated time points of the tone onsets.
In this work we assume that a tone onset is correctly detected, if the ab- solute difference between the true and the estimated onset time is less than 50 ms (see Dixon (2006)). As quality criterion for the goodness of the onset detection the so calledF-value is used here:
F= 2c
2c+f++f−,
wherecis the number of correctly detected onsets, f+is the number of false detections and f− denotes the number of undetected onsets (Dixon (2006)).
Note that the F-value always lies between 0 and 1. The optimal F-value is 1. For the given vector of the true onset time points true, the function f_value(est,true) returns theF-value for the vector of the estimated onset timesest=onsets(CombF,Q).
3 Auditory Model
An auditory model is a computer model of the human auditory system. It requires an acoustic signal as input and outputs the spike firing rates of the auditory nerve fibers. The human auditory system consists of roughly 3000 auditory nerve fibers. Auditory models contain usually a much smaller num- ber of fibers. For this study the popular model of Meddis (2006) is employed.
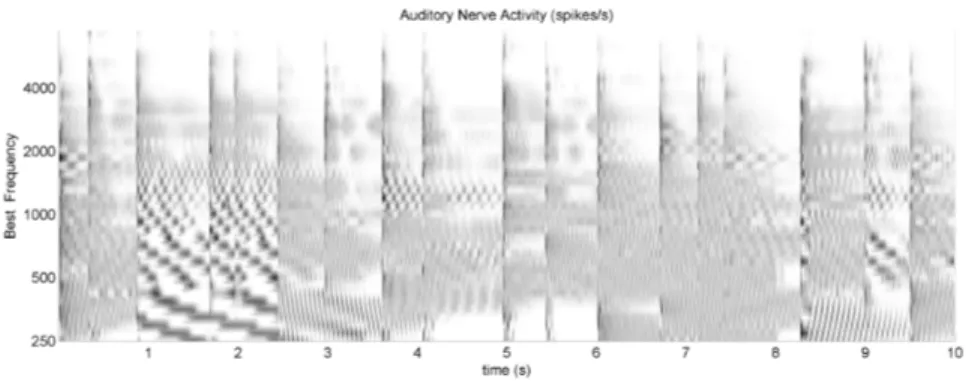
To put it simply, in this model the auditory system is coded by a multichannel bandpass filter where each channel represents one specific nerve fiber. Each channel has its specific best frequency by which its perceptible frequency range is defined. In this work we use 40 channels with best frequencies be- tween 250 Hz (channel 1) and 7500 Hz (channel 40). An exemplary output of the model, called auditory image, can be seen in Figure 1. While the 40 chan- nels are located on the vertical axis and the time response on the horizontal axis, the grey level indicates the channel activity per second.
Fig. 1.Auditory image
4 Auditory Model Based Onset Detection Approach
The output of the auditory model is, according to Section 3, a set of 40 au- dio signals(chan1,chan2, . . . ,chan40), where each signal corresponds to one of 40 hearing channels. For all channels the combined featuresCombF are computed as described in Section 2 and then combined to one onset indi- cator. While there are more comprehensive ways, we tried a simple method first. The detailed procedure is described in the following1:
1 For each channelchank,k=1, ...,40,calculate the onset detection func- tionCombFk=detect(chank,L,O,WA).
2 For each windowi,i=1, ...,T, do:
• v[i] = (CombF1[i], ...,CombF40[i])0,
• output[i] =quantile(v[i],C), where the functionquantilereturns the C%-quantile of the vectorv[i].
3 output= (output[1], ...,output[T])0. 4 est=onsets(Output,Q).
5 error=f_value(est,true).
In the following we will investigate the influence on the onset detection accuracy of the parametersL,O,WAandC. In order to reduce the complex- ity, we estimate the parameterQby means of grid search in the interval from 0 to 1 with step size 0.05 (the same approach as in Bauer at al. (2012)).
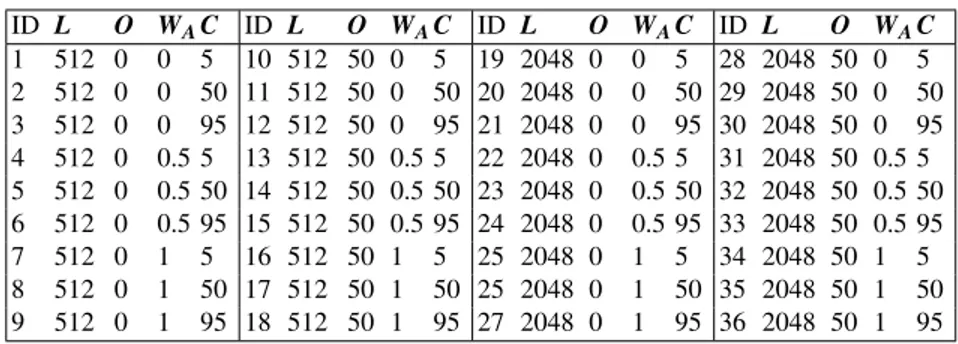
The following settings of the four parameters are tested:Lwith two levels (512 and 2024 samples),Owith two levels (0 and 50 per cent),WAwith three levels (0, 0.5 and 1) andCwith three levels (5, 50 and 95 per cent). Table 1 lists the 36 parameter settings.
1v[i]is the notation for thei-th element of vectorv.
Tone Onset Detection Using an Auditory Model 5
Table 1.Parameter settings for auditory model based onset detection ID L O WAC ID L O WAC ID L O WAC ID L O WAC 1 512 0 0 5 10 512 50 0 5 19 2048 0 0 5 28 2048 50 0 5 2 512 0 0 50 11 512 50 0 50 20 2048 0 0 50 29 2048 50 0 50 3 512 0 0 95 12 512 50 0 95 21 2048 0 0 95 30 2048 50 0 95 4 512 0 0.5 5 13 512 50 0.5 5 22 2048 0 0.5 5 31 2048 50 0.5 5 5 512 0 0.5 50 14 512 50 0.5 50 23 2048 0 0.5 50 32 2048 50 0.5 50 6 512 0 0.5 95 15 512 50 0.5 95 24 2048 0 0.5 95 33 2048 50 0.5 95 7 512 0 1 5 16 512 50 1 5 25 2048 0 1 5 34 2048 50 1 5 8 512 0 1 50 17 512 50 1 50 25 2048 0 1 50 35 2048 50 1 50 9 512 0 1 95 18 512 50 1 95 27 2048 0 1 95 36 2048 50 1 95
5 Music Data Set
In order to compare the original onset detection with the extended approach proposed in this paper the same data set is used as in Bauer et al. (2012), which consists of 24 randomly generated tone sequences. In the following we briefly describe the construction principles of this data set.
There are many characteristics that describe a music signal like tempo, genre, instrumentation or sound volume. We consider merely the instrumen- tation and the tempo as control variables when designing the data set: The same tone sequences are recorded by different music instruments with differ- ent tempo settings. This allows to explicitly measure the influence of these two control variables on the accuracy of the onset detection.
Six music instruments are considered: piano, guitar, flute, clarinet, trum- pet and violin. The tone sequences are generated randomly by considering the following settings:
1. Sound intensitiesfollow the uniform distribution in the interval [70,90]
(in MIDI-coding).
2. Notes follow the uniform distribution in the interval [60,76] (in MIDI- coding). This interval corresponds to the common pitch range (from C4 to E5) of the instruments under consideration.
3. Tone durations(in seconds) are
a) absolute values from the normal distribution with parametersµ=0.5 andσ=0.2,
b) absolute values from the normal distribution with parametersµ=0.2 andσ=0.1.
The first tone duration setting generates slow music pieces with two beats per second on average (or 120 BPM2), whereas the second setting gener-
2BPM: beats per minute
ates fast music pieces with five beats per second on average (300 BPM). For each of six music instruments and for each of two tone duration settings five tone sequences (with the duration of 10 seconds) are generated. The fast tone sequences hence include ca. 50 tone onsets and the slow sequences ca. 20 onsets.
The generated MIDI-files are converted to WAVE-files using real tone samples from the RWC data base (Goto et al. (2003)).
6 Results
In this section we will compare the 36 proposed parameter settings of the auditory model based onset detection in order to investigate the influence of these settings on the goodness of onset detection for each instrument.
Further, we will compare the results of original signal and auditory model based detection for the same algorithm’s parameter settings. This should re- veal whether an extension of the onset detection algorithm (proposed in our previous work) with an auditory model leads to better detection accuracy.
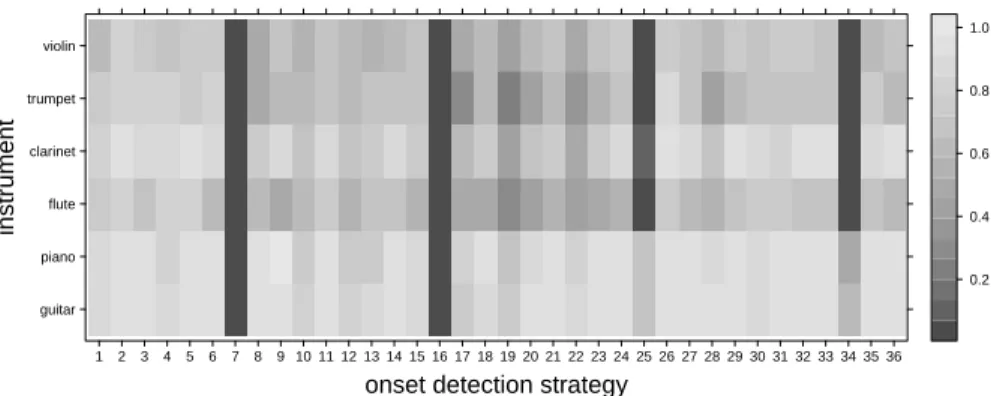
6.1 Comparison of Auditory Image Based Onset Detection Approaches In order to compare the goodness of the proposed 36 onset detection strate- gies (see Section 4) we calculate the F-measure for each music instrument and for each of the five slow and five fast sequences (see Section 5). The resulting averageF-measures of the six music instruments and 36 strategies are presented in Figure 2. Most strategies provide acceptable results but few strategies obviously fail. Furthermore, it can be seen, that for the music in- struments piano, guitar and clarinet – in contrast to the others – systematically better detection accuracies are achieved.
Table 2 presents the best parameter settings for each instrument and on average. We can observe an interaction between parameters C andWA: if WA=1,Cshould be chosen high (C=95). Whereas the best setting on av- erage is the one with the small window length (L=512 samples), without overlap (O=0%), considering merely the spectral based feature (WA =0) and middle quantile (median,C=50%). Further, in Table 3 the worst strate- gies are listed: Considering only the amplitude based feature (WA =1) in combination with smallC-values does not seem to lead to acceptable results.
Tone Onset Detection Using an Auditory Model 7
onset detection strategy
instrument
guitar piano flute clarinet trumpet violin
1 2 3 4 5 6 7 8 9 10 11 12 13 14 15 16 17 18 19 20 21 22 23 24 25 26 27 28 29 30 31 32 33 34 35 36 0.2 0.4 0.6 0.8 1.0
Fig. 2.Comparison of the 36 onset strategies (see Table 1): For each instrument and each strategy the averageF-value over five slow and five fast sequences is presented
Table 2.Best parameter settings for each instrument and on average
instrument ID L O WA C
piano 36 2048 50 1 95
guitar 23 2048 0 0.5 50
flute 9 512 0 1 95
clarinet 36 2048 50 1 95
trumpet 2 512 0 0 50
violin 2 512 0 0 50
on average 2 512 0 0 50
Table 3.Worst parameter settings
ID L O WA C
7 512 0 1 5
16 512 50 1 5
34 2048 50 1 5
25 2048 0 1 5
19 2048 0 0 5
6.2 Comparison of Auditory Image Based and Original Signal Based Onset Detection
In Bauer et al. (2012) the original signal based tone onset detection algorithm was tested on the data set used in this work for eight possible combinations of the following parameter settings:Lwith two levels (512 and 2048 samples), Owith two levels (0% and 50%) andWA with two levels (0 and 1). As the parameterCis only given in the extended approach, it was set to the average best settingC=50% (see Table 2).
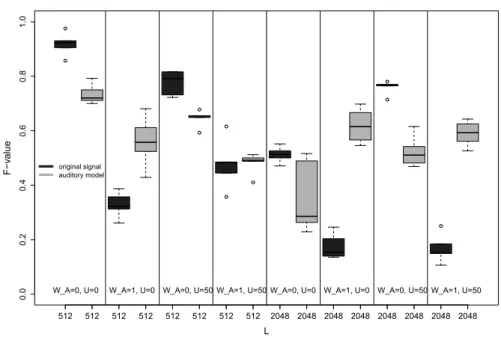
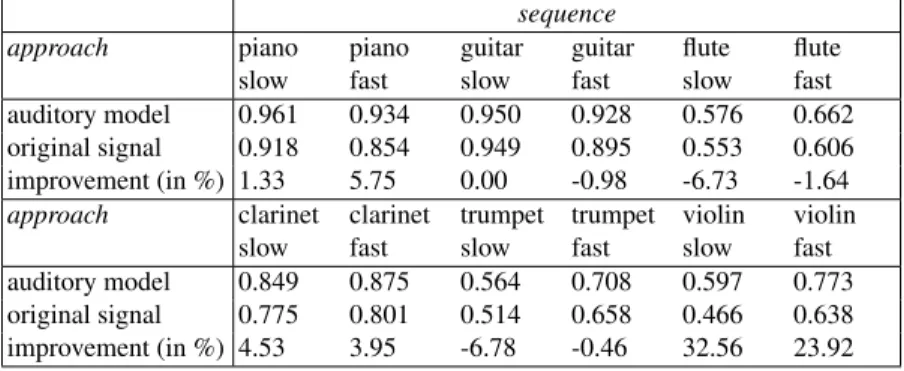
Table 4 shows the averageF-values of the auditory model based and orig- inal signal based onset detection over the eight parameter settings mentioned above. It also gives the median of the percentage change of the results when using the extended approach. Further, Figure 3 compares the detection accu- racy (F-measure) of both approaches for an example of slow trumpet tone sequences.
According to Table 4 the auditory image based onset detection is on aver- age (over all parameter settings) better than the original signal based. How- ever, when considering the median of the vector of 40 improvement-rates – for each setting and each tone sequence – we observe for flute and trumpet – in contrast to other music instruments – decline of the onset detection accu- racy when using the auditory model based approach (especially for the slow sequences). This is basically caused by the fact that many onsets for these two instruments were detected with a delay of more than 50 msec. Figure 4 shows a fragment of the auditory image for a slow trumpet sequence. Obvi- ously the channels with high best frequencies (over 3000 Hz) respond later than the channels with low best frequencies. Interestingly such delays do not occur very often for short tones from staccato tone libraries (for trumpet and flute). This may be due to the fact that short and especially staccato tones in contrast to long tones usually have stronger attacks. Thus, in order to improve the onset detection a systematic investigation of these effects is required.
0.00.20.40.60.81.0
L
F−value
512 512 512 512 512 512 512 512 2048 2048 2048 2048 2048 2048 2048 2048 W_A=0, U=0 W_A=1, U=0 W_A=0, U=50 W_A=1, U=50 W_A=0, U=0 W_A=1, U=0 W_A=0, U=50 W_A=1, U=50
original signal auditory model
Fig. 3.Comparison ofF-values of the original signal and auditory image based onset detection for slow trumpet tone sequences
Tone Onset Detection Using an Auditory Model 9
Table 4.AveragedF-values of the auditory model and original signal based onset detection over eight different parameter settings and the median of the percentage change of the results when using the extended approach
sequence
approach piano
slow
piano fast
guitar slow
guitar fast
flute slow
flute....
fast auditory model 0.961 0.934 0.950 0.928 0.576 0.662 original signal 0.918 0.854 0.949 0.895 0.553 0.606 improvement (in %) 1.33 5.75 0.00 -0.98 -6.73 -1.64
approach clarinet
slow
clarinet fast
trumpet slow
trumpet fast
violin slow
violin fast auditory model 0.849 0.875 0.564 0.708 0.597 0.773 original signal 0.775 0.801 0.514 0.658 0.466 0.638 improvement (in %) 4.53 3.95 -6.78 -0.46 32.56 23.92
Fig. 4.Cut-out of the auditory image for a slow trumpet sequence
7 Summary
In this work we proposed a strategy for using the multiple channel output of an auditory model for the tone onset detection problem. We compared the auditory model and original signal based approaches on the same data set for several algorithm parameter settings. The data set consists of random sequences which were generated for six music instruments and two tempi (fast and slow) using real tone recordings.
An essential improvement of the onset detection when using the audi- tory model can be noted for the violin (over 20 %). However, for the slow
trumpet and flute tone sequences a significant decline of the detection ac- curacy can be observed using the auditory model based approach. This can be explained through the delayed response of high frequency channels of the auditory model. In order to improve the auditory model based onset detection the detailed study of auditory model behavior depending on musical charac- teristics of audio signals is required and is the aim for our further research.
Additionally, we plan to compare the features we used for onset detection (amplitude difference and correlation between spectra) with the ones used by Benetos et al. (2009) and to develop a strategy for combining these features.
Further, other approaches for processing the channel outputs of the auditory model can be considered, for example by taking the channel order into ac- count.
Acknowledgements
This work was supported by the Collaborative Research Centre “Statistical Modelling of Nonlinear Dynamic Processes” (SFB 823) of the German Re- search Foundation (DFG), within the framework of Project C2 “Experimen- tal Designs for Dynamic Processes” and Project B3 “Statistical Modelling of Highly-Resolved Spectro-Temporal Audio Data in Hearing Aids”.
References
BAUER, N., SCHIFFNER, J. and WEIHS, C. (2012): Einfluss der Musikinstrumente auf die Güte der Einsatzzeiterkennung. Discussion Paper 10/2012. SFB 823, TU Dortmund BELLO, J. P., DAUDET, L., ABDALLAH, S., DUXBURY, C., DAVIES, M. and SANDLER,
M. B. (2005): A Tutorial on Onset Detection in Music Signals.IEEE Transactions on Speech and Audio Processing,13 (5), 1035–1047.
DIXON, S. (2006): Onset detection revisited. In:Proceedings of the 9th International Confer- ence on Digital Audio Effects(DAFx-06), 133–137.
BENETOS, E., HOLZAPFEL, A., STYLIANOU Y. (2009): Pitched instrument onset detec- tion based on auditory spectra.10th International Society for Music Information Retrieval Conference(ISMIR 2009), 105–110.
MEDDIS, R (2006): Auditory-nerve first-spike latency and auditory absolute threshold: A computer model.Journal of the Acoustical Society of America,116, 406–417.
GOTO, M., HASHIGUCHI, H., NISHIMURA, T., and OKA, R. (2003): RWC Music Database: Music Genre Database and Musical Instrument Sound Database,Proceedings of the 4th International Conference on Music Information Retrieval(ISMIR 2003), 229–
230.