Blijenberg and Lejjnse: Total bilirubin determination in neonatal sera with the ACA 303 J. Clin. Chem. Clin. Biochem.
Vol. 17,1979, pp. 303-308
A Spectrometric Version of the Total Bilirubin Determination with the Du Pont ACA with Respect to Neonatal Sera
By A G. Blijenberg and B. Leijnse
Department of Clinical Chemistry University Hospital Rotterdam, The Netherlands (Received November 6/December 27, 1978)
Summary: A spectrometric modification of the determination of total bilirubin with the Du Pont ACA is described.
Accuracy, precision and standardization problems are discussed in comparison with the earlier published diazo modification, as well as other techniques well known in the field of neonatal chemistry.
Spektrometrische Version der Bestimmung von Gesamt-Bilirubin mit dem Du Pont ACA unter Berücksichtigung von Seren Neugeborener
Zusammenfassung: Eine spektrometrische Modifikation der Bestimmung von GesamMJilirubin mit dem Du Pont ACA wird beschrieben. Richtigkeit, Präzision und Standardisierungsprobleme werden im Vergleich mit der früher veröffentlichten Modifikation der Diazo-Methode wie auch anderen für Bestimmungen bei Neugeborenen bekannten
Methoden diskutiert.
Introduction
In a previous study we described how the Du Pont Automatic Clinical Analyzer (ACA), TBIL method could be modified in order to make the method suitable for determining total bilirubin in neonatal serum (1). We reported that this modification, called BBIL, worked satisfactorily in the opinion of the clinicians working in our hospital. However, from a clinical chemical point of view we had certain reservations. As we have already mentioned the problem of accuracy was not completely solved (hemoglobin interference). Furthermore, we had the impression that the precision with the ACA could be improved, and finally the correlation study some- times showed differences that could riot be explained very easily. Therefore we decided to study the "state of the art" for the determination of total bilirubin in sera of neonates. In general, there are two ways by which total bilirubin can be determined:
1. spectrometric by measuring the absorbance of the bilirubin colour at about the peak wavelength, and 2. by means of the diazo reaction.
The advantage of the spectrometric method is its speed and ease. However, the advantage of the diazo reaction is a higher sensitivity and specificity.
For the majority of samples coming from neonates one is concerned with elevated unconjugated bilirubin levels. In these samples turbidity and interfering
goloured components are usually absent. These reasons and the simplicity of the technique have led to the popularity of the spectrometric method for measuring the bilirubin content of neonatal serum. Because of this fact, it seemed worthwhile to study the possibilities of the ACA with respect to a spectrometric modification, in addition to the ACA diazo modification already described.
Since empty packs (ABS packs) are used in the ACA as a functional check of the system (e. g. sample dilution and absorbance reading), it should be possible to use these packs for a spectrometric method for determining bilirubin concentrations.
Furthermore, the first ACA method for estimating total bilirubin had been comparable to our proposed proce- dure. We divided the study into four parts i. e.
1. the development of the ACA spectrometric method, 2. the interference of hemoglobin with the techniques used,
3. the estimation of the precision of these techniques, 4. the standardization of the method.
Materials and Methods Equipment
Du Pont Automatic Clinical Analyzer (ACA). By means of the Computer II the spectrometric method (NBIL) was laced in 0340-076X/79/0303-0308S2.00
© by Walter de Gruyter & Co. - Berlin · New York
304 Blijenberg and Leijnse: Total bilirubin determination in neonatal sera with the ACA
channel 62. For a further description the reader is referred to our earlier publication (1) or to the manufacturer.
Beckman DU-2 spectrophotometer. This well known instrument was checked regularly according to Rand (2) with respect to wavelength (didymium) and absorbance (cobalt sulphate).
Materials
ABS packs. The pack header code was changed by wiping off one black bar. As a result of this a new method was "developed".
Solid bilirubin was purchased as a rule from £. Merck Co, catalogue number 24519.
Furthermore we used the standard reference material, SRM 916 from the National Bureau of Standards.
Human albumin solution (200 g/1, salt-poor) was obtained from Institut Merieux S. A. (France).
The materials used for the methods si Hertz (3)i Richterich (4) and Michaelsson (5) were from E. Merck Co or J. T. Baker Chemical Co.
Commercial sera. The reader is referred to table 3.
Methods
The preparation of bilirubin standards and hemoglobin solutions was described earlier (1).
The methods of Hertz (3), Richterich (4) and Michaelsson (5) were used as described in the original publications.
The Boehringer technique (Test-Combination Bilirubin, DPD- method, cat. no. 123943) was applied according to the instruc- tions of the manufacturer.
Results
As we mentioned in the Introduction it should be possible to develop a spectrometric method in the ACA system. Simply by diluting a sample with phosphate buffer 0.15 mol/1, pH = 7.8 (already present in the system) in an empty pack, it is possible to measure an absorbance (filter 452 nm), which can be related to the bilirubin content of the sample.
Correction for hemoglobin can be done by measuring the absorbance either at 540 or 577 nm, because at these wavelengths the absorbances of hemoglobin are comparable to the absorbance at 452 nm.
We did our experiments with both combinations 452-540 nm and 452-577 nm. Because of the better precision, we chose the combination 452-540 nm.
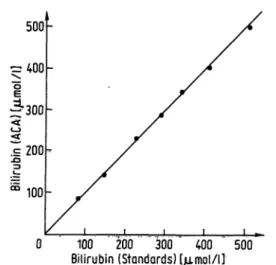
Figure 1 shows the calibration graph of the method, which we called NBIL. Each point represents the mean of six samples.
The study of the hemoglobin interference problem was performed as described earlier (1) with one addition: we also included blood additions in which a certain part was assumed to be "fetal" hemoglobin.
These samples were obtained by lysing blood clots from neonatal specimens. No difference was found to exist between the "adult" and the "fetal" additions. The results obtained for spiking with "adult" hemoglobin are shown in figure 2.
The same technique was applied in the measurement of the interference of hemoglobin with two other techniques.
These results are also shown in figure 2.
0 100 200 300 400 500
Bilirubin (Standards) [jamol/l]
Fig. 1. Calibration graph of the ACA-NBIL method. Each point is the average of six measurements.
400
^300
5c
1100
Ξ3100 200
Hemoglobin 300 400 Fig. 2. The interference of hemoglobin with the ACA-NBIL
method (I), the Michaelsson technique (2) and the Richterich technique (3).
A comparison of the precision for a number of methods was then made. We estimated the "within-run" and the
"day-to-day" precision at two levels.
In table 1 all results are tabulated.
At this point we found the spectrometric modification to be comparable in performance with the diazo modifica- tion. Therefore we focussed our attention more on this method.
We determined the recovery of bilirubin standards added to patient samples. Because of the small residual volumes of the samples (neonatal sera!) we decided to calculate the recovery data on the basis of the weights of the standard and patient sera. As an average value for the density of serum we used 1.026 kg/1 (6). We found with 29 patient samples an average value of 101% for the recovery (standard deviation 6%).
The correlation study for peripheral blood was done with two other techniques: a spectrometric technique described by Richterich (4), and the well-established Michaelsson diazo method (5). Figure 3 shows the comparison with the Richterich method.
J. Clin. Chem. Clin. Bipchem. / Vol. 17,1979 / No. 5
Blijenberg and Lejjnse: Total b irubin determination in neonatal seia with the ACA 305 Tab. 1. Precision data.
Method Sample
Within-run precision, n = ACA-NBIL 20 μΐ ACA-NBIL 60 μΐ ACA-BBIL 60 μΐ Richterich (4) 50 μΐ Hertz (3) 50 μΐ Michaelsson (S) 50 μΐ Boehringer 40 μΐ Ictometer 20 μΐ
Low value Average CV [μηιοΙ/11 \%\
20 109108 12987 13576 10465
2.21.0 5.22.3 1.96.4 4.41.6
High value Average CV [Mmol/l] [%]
298315 263350 361214 214347
0.70.5 2.91.5 4.92.3 2.20.8 Day-to-day precision, η = 20
ACA-NBIL ACA-BBIL Hertz (3) Michaelsson (5)
Boehringer Ictometer
20 μΐ 60 μΐ 50 μΐ
50 μΐ 40 μΐ 20 μΐ
6677 8182 10667
5.87.2 6.45.9 5.82.9
242246 238257 233260
2.33.7 2.73.5 2.42.6
300
1200
.i± 1DO
0 100 200 300 Bilirubin (Michaelsson tial) I/imol/l]
Fig. 4. Split sample comparison between the "NBIL" (y-axis) and the Michaelsson technique (x-axis) for peripheral blood (neonatal sera).
The straight line represents the "ideal" correlation,
300 -
200
£
100
100 200
Bilirubin (Richterich) [/imol/l] 300 Fig. 3. Split sample comparison between the "NBIL" (y-axis)
and the Richterich technique (x-axis) (neonatal sera).
The straight line represents the "ideal'* correlation.
The comparison with the Michaelsson technique was split into two parts. In total we compared 106 samples, 38 sera coining from babies receiving phototherapy, and 68 sera from babies without phototherapy. Figure 4 shows the correlation for all specimens. The regression equations of the two sets of specimens are given in table 2.
We also performed a correlation study for umbilical cord specimens. In figure 5 the results of the comparison be- tween the NBIL and the Michaelsson technique are shown.
In all experiments the results were obtained on the basis of a calibration with bilirubin enriched sera. In practice this is a rather cumbersome method. It is known that the standardization of the bilirubin determination is a difficult problem. The differences in standardization
Tab. 2. Statistical data.
L ACA-NBIL vs. Richterich, peripheral blood 2. ACA-NBIL vs, Michaelsson, without phototherapy 3. ACA-NBIL vs- Michaelsson, with phototherapy
4. ACA-NBIL vs, Michaelsson, peripheral blood (total 2 + 3) 5. ACA-NBIL vs, Michaelsson, umbilical cord blood
2.1.
3.4.
5.
Regression equation
„ (y on x) y = 0.92x + 5 y * 0,80 χ + 34 y = 0,82 χ + 31 y = 0.85 χ + 26 y=1.10x + 1
Correla- tioncoeffi- cient r 0.990,93 0,920.94 0.93
Number ofdetermi- nations n
4066 10539 43
Average
X
I/miol/1]
194162 169166 29
Average
y
(μιηοΐ/ΐ]
184161 170164 26
50 I 40ε I 30
|zo
m 10
ι _ 0 10 20 30 40 50 60
Bilirubin (Michoelsson et ο I. [/imol/l]
Fig. 5. Split sample comparison between the "NBIL" (y-axis) and the Michaelsson technique (x-axis) for cord blood.
The straight line represents the "ideal" correlation.
J. Clin. Chem. Clin. Biocherm /Vol. 17,1979 / No. 5
306 Blyenberg and Leynse: Total bilirubin determination in neonatal sera with the ACA
can be caused by incomplete dissolution of the solid bilirubin and/or the presence of compounds which interfere with the diazo coupling reaction»
Therefore we decided to simplify the preparation of the standard sera. The protein base was changed to human albumin 50 g/1 instead of human sera. This solution is more constant and no check on the colour is needed, Secondly, we studied the possibility of using cortlhletciai sera in calibrating the ACA. In fact we use two Ways of determining total bilirubin L e» the "adult" Way (tBIL) and the "neonatal" way (NBIL). In pf actice this means that at regular intervals (to be determined by the labo- ratory) the ACA must be calibrated, owing to the arrival of new lotnumbers of packs. We studied 11 commercial sera divided into two concentration ranges:
a low level between 50 and 200 /zmol/l and a high level between 300 and 400 μιηοΐ/ΐ.
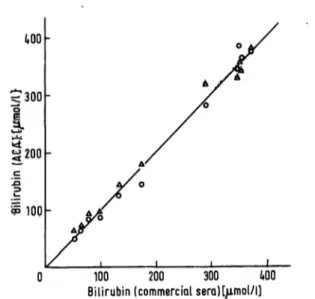
The details of the commercial sera are presented in table 3. Figure 6 shows the comparison of the ACA values against the assigned bottle values for the commet- cial sera.
The ACA was calibrated with bilifubin in human
albumin (50 g/1). Solid bilirubin was bought from Merck.
We compared this product with bilirubin from the National Bureau of Standards (Standard Reference Material, S. R. M. 916) and found as molar absorp- tivities (1 · mol"1 · cm"1) in chloroform:61,500 for
Tab. 3. Description of commercial sera used.
tQO
< 300
Name
Monitrol II Calibrate 2 Calibrate 3 Wellcomtrol 2 Baker Bilirubin Standard SMAC Control Versatol Pediatric Q-PAK Bilirubin Control · Precibil
Bilirubin Control Wellcomtrol 3
Manufacturer
Dade General Diagnostics General Diagnostics Wellcome Baker Technicon General Diagnostics Hyland Boehringer Dade Wellcome
Kind of protein base
Human serum Human serum Human serum Horse serum Bovine albumin Bovine serum Human serum Human serum Human serum Human albumin Bovine serum
Assigned value (only Jendrassik*
Grof) (Mmol/1]
60, 62 and 64 53 79 99 136 173 296 352 · · 354 357 374
3g 200
Joc
S 10Q
0 100 200 300 MO Bilirubin (commercial seraK/imol/l)
Fig. 6» Graph representing the results obtained with commercial sera
x^axis: data given by the manufacturer y-axis: ACA-results, ο = TBIL, Δ - NBIL.
the Merck product and 62,100 for the N.B.S. product respectively. Furthermore we estimated the molar absorptivity of the azobuirubin by theJendrassik-Grof reaction. The method we used is the one recommended by the Dutch Standardization Committee on Clinical Chemistry and is the same as described byDoumas et al (7). The coefficients (1 · mol"1 · cm"1) were 72,200 for the Merck product arid 71,700 for the S.R.M. 916. We found these values suitable for the calibration of the TBIL and the NBIL method (12).
Discussion
The literature on the determination of bilirubin is very extensive. A comprehensive survey of the available literature can be found in the publications of Hertz and Dybkaer (3,11). In general a preference exists for the determination with the help of the diazo reaction (7).
One exception concerns the neonatal field.
Because of the absence of disturbing factors the serum matrix with respect to bilirubin is well defined in neonatal sera; this has resulted in the development of many spectrometric methods. Speed and simplicity are the reasons for the wide popularity of these methods.
We started the study of the determination of total bilirubin on the ACA with neonatal sera by modifying
the existing method (TBIL) as we described earlier (BBIL). The method worked well, but because of the reasons mentioned in the Introduction, we wished to know if some kind of a spectrometric modification could be Worked out in the ACA; and if so, whether the method would be comparable or better in performance with respect to the BBIL. The present study therefore describes the development of a spectrometric determina- tion of total bilirubin with the ACA. Comparing this modification with our diazo modification we conclude
J.Clin. Chem. Clin. Biochem. / Vol. 17,1979 /No. 5
. I
e: Total WUwWn 4etermin^tiop in neonatal ssra with the ACA 307 that the spectrometric method has some practical
advantages for several reasons:
1. The main problem in neonatal bilirubin analysis, namely hemolysis, is solved in a better way as can be seen from figure 2.
2. The precision is better as can be seen in table 1, even if the sample volume is 20 μΐ (also advantageous!).
3. The comparison with two other techniques, Richterich's spectrometric method and the diazo method published by Michaelsson et al. is very favour- able (table 2).
4. Additional reagents are not needed.
Another two points are relevant. As one can see in figure 1 the calibration graph is linear up to ^t Je^st.
400 μτηοΐ/ΐ which is, clinically speaking, sufficient.
Furthermore as can be seen from table 2 we were not able to detect differences between samples coming from babies treated with phototherapy and samples from babies who were not treated with phototherapy. This is in accordance with the work ofEbbesen (8). The correlation coefficients for umbilical cord blood and peripheral blood analyses are comparable, when using the Michaelsson technique and the NBIL method. How- ever, there is a difference in the slopes of the regression lines (table 2). We cannot give an explanation for this phenomenon. It is possible that there is a serum matrix effect.
At the moment no further work is planned to determine the reason for the observed differences, because the
determination of bilirubin in cord blood is becoming less important. This is due to the general use, since
1969, of anti-D-immunoglobulin in Holland in cases of rhesus incompatability (9).
The comparison between R ichterich's technique and the NBIL method raises the question of accuracy. Although the coefficient of correlation is excellent (0.99) there is a difference in result (fig. 3). Work is in progress to try and solve this problem. One point which may be impor- tant is that the calculation of the results i {he manil^l method is based onRichterich's formula with absoff ances measured on a Beckman DU*2 spectrophotometer and in the case of the ACA by means of standard specimens. The same question of accuracy arises in considering figure 4. The problem is: "hp\v equal" is n spectrometric determination of bilirubin to a diazo measurement? The results we gfetaifie W§?§
comparable to each other which is also the conclusion of Hertz (3) ^ndBlumberger-(\Q).
This brings us to the method of standardization. When using a diazo reaction, such as the modification described by Doumas, or the Michaelsson technique, there is no difference between albumin-based and serum-based bilirubin standards. This was shown by Doumas (7), and it is in accordance with our own experience.
Dybkaer, however, ih his spectrometric modification, advocates suitable serum diluent instead of human albumin solution (U),
At the present time, for practical reasons, we have chosen bUirubjin standards in albumin, because their prepara- tion is easy and reproducible. In addition, preliminary studies show no appreciable difference between serum- based and albumin-based calibration graphs in the ACA.
However, it is our intention to study this part in more detail, not only because ofDybkaer's statements (though he doesn't mention data), but also because of differences seen in the preparation of the bilirubin standards. Compar- ing the Merck product with the N.B.S. bilirubin we noted that the Merck bilirubin dissolved much slower than the N.B.S. product. Furthermore the Merck standard is orange coloured while the N.B.S. standard is brownish orange. Both differences may be caused by the existence of isomeric forms and/or the presence of traces of impurities.
However, the calibration with some commercial sera gave results which were not acceptable. In the lower range we measured differences up to 20 μτηοΐ/ΐ and in the higher range up to 37 μπιοΐ/ΐ.
The turbidity of some samples (Monitrol, Calibrate, Versatol Pediatric and Hyland) is, in our opinion, one important cause of these differences.
Summarizing, we now prefer our NBIL modification to our earlier BBIL solution, with respect to the determina- tion of neonatal total bilirubin, although the standardiza- tion needs further investigation. ,
Acknowledgements
Many thanks are due to Mrs. H. J. Brouwer, Mrs. H. A. Roetering and to Mrs, L. /, Perret for their skillful technical assistance and tP Mr> A, Terlww for his clerical assistance.
Furthermore, we wish to thank Du Pont de Nemours Co. (The Netherlands) for providing the test packs.
References 1. BUJenberg;, B. G..
Glih.
, H. J. & Leijn.se, B. (1978), J, . . nv, Ji, 425=428,
2. Ran£,~R. A (iggg), Gift, &&&* Wi 83?=8«S<
3! He«?, H.;gybka#, R. & Lautem* M, (;l9m Seand. J.
" Clin'. Lab. Invest., 33, 215-230.
4. Richterich, R. (1969), eiinical Chemistry, p. 416, S. Karger, Basel and ^a$einie Press, New York and London.
5. Miohaelsson, M., Nosslin, B. & Sj lin, S. (1965), Pediatrics, 35, 925-931.
6. Documenta Geigy (1969), Wissenschaftliche Tabellen, p. 553, J. R. Geigy A. G., Basel.
7. Doumas, B. T., Perry, B. W., Sasse, E. A. & Straumfjord, J. V. (X973), CUn. Chem., 19, 984-993.
8. Ebbesen, F, (1977), CUn, Chem., 23, 695-699.
J. Glin. Chem. Glin. Biochem, / Vgl 17,1979 / No. 5
308 Blijenberg and Leijnse: Total bilirubin determination in neonatal sera with the ACA
• ·· — —-—-··· · - —·
9. Splinter, T. A, W, & Borst^Eilers, E. (1977), Ned. Tijdschr. 11. Dybkaer, R. & Hertz, H. (1970), ScaiuLJ. Clin. Lab.
Geneesk., 121, 2038-2043, Invest, 25,151-160.
10. Blumberger, T. A., Stein&rink, C. F., Cheskin, H. S., George, 12. Gambino, S. R. (1965), Stand. Methods Clin. Chem. 5, J. D. & Vogl, T. P. (1978), Arn, J. Clin. PathoL, 69, 55.
388-397.
Dr. B. G. Blijenberg
Department of Clinical Chemistry University Hospital
Rotterdam The Netherlands
J. Clin. Chem. Clin. Biochem. / Vol. 17,1979 / No. 5
Cuprophan tubings - dry for your processing convenience are available also in lay flat widths of 4, 8,10,15, 25, and 35 mm. This semipermeable membrane may be used for separation processes of small samplings in laboratories.
Ask for samples and quotation.
Enka AG Product Group Dialyzing Membrane Plant Wuppertal-Barmen P.O.B.200916
D 5600 Wuppertal 2 W. Germany
A
Akzo group memberElektrophorese-Scanner
Hh Elekf rophorese-integrator
-ja
Eine vollautomatische Auswerteeinheit mit grossem Bedienungskomfort
O Alle im klinischen Labor anfallenden Trennungen können problemlos ausgewertet--werden, z. B. SörünV Proteine,; Ljpöprpteine, Membranfplien, Gelschichten oder Disc-Röhrchen. . . . i O Das Messobjekt-ist während der Messung sichtbar,
daher leicht, zu kontrollieren. .
O Der Scanner m.isst- wahlweise im Durchlicht oder Auf licht, je nachdem, was "für dasv Messobjekt vorteil- hafter, ist. " \i~
O Auf dem gleichen Olatt werden Patientenidentifizie- furig, Auswertekürye und digitales Ergebnis ausge- . druckt,,, praxisgeredit. und.;in.;Sekundenschhelle.
Ein bedienungsfreundliches .Gerät für die Routine, jedoch mit ;Förschungsqualität. ; ; ~ · -
Verlangen Sie ausführlidie^lnformationen oder gleich eine Vorführung! ' '"'
Homburgerstrasse24 4132 Muttertz/Schweiz Tel. (061)613434
Bismarckstrasse 27-29 . 1000 Berlin 41
I 7951091
W
DEG Walter de Gruyter Berlin-New York
Eckhart Buddecke
Pathobiochemie
Ein Lehrbuch für Studierende und Ärzte 17,0 cm 24,0 cm. XXXVI, 446 Seiten.
Mit 247 Abbildungen und zählreichen Tabellen. 1978. Plastik flexibel DM 34,- ISBN 3 11 0075261
Das Lehrbuch Pathobiochemie beschreibt die biochemischen Grundlagen genetischer und erworbener Störungen des Stoff- wechsels, Abweichungen in der chemischen Struktur der Bausteine des menschlichen Körpers, fehlerhafte bio- chemische Prozesse, soweit sie sich als Symptome mit Krankheitswert manifestieren.
Als einführendes Lehrbuch umfaßt die Pathobiochemie die Hauptabschnitte:
Stoffwechsel, Stoffwechselregulation, Zellen, Gewebe und Organe und Dynamische Systeme.
Die Pathobiochemie liefert der Medizin neue theoretische Grundlagen, zeigt, in welchen Bereichen ein erfolgreicher Vorstoß bis zu einer „molekularen Krankheitslehre"
möglich ist, und vermittelt als fachgebiets- übergreifende Wissenschaft auch Beziehun- gen zu zahlreichen Nachbargebieten wie z. B., zu Pathologie, Immunologie, Pharma-
kologie, Klinischer Chemie und Innerer Medizin.
Bei der Auswahl des Stoffes wurde die revidierte und neugegliederte 2. Auflage (1978) des Gegenstandskataloges „Patho*
Physiologie und Pathobiochemie" ein- gehend berücksichtigt.
Ein entsprechendes Korrelationsregister zum GK ist dem Buch beigefügt.
Preisänderungen vorbehalten
(56) . l