Bioinformatics of Eukaryotic Gene Regulation
DISSERTATION
zur Erlangung des akademischen Grades doctor rerum naturalium
(Dr. rer. nat.) im Fach Biophysik
eingereicht an der
Mathematisch-Naturwissenschaftlichen Fakultät I Humboldt-Universität zu Berlin
von
Herr Dipl.-Phys. Szymon M. Kielbasa geboren am 12.03.1973 in Krakau, Polen
Präsident der Humboldt-Universität zu Berlin:
Prof. Dr. Jürgen Mlynek
Dekan der Mathematisch-Naturwissenschaftlichen Fakultät I:
Prof. Thomas Buckhout, PhD Gutachter:
1. Prof. Dr. Hanspeter Herzel 2. Prof. Dr. Joachim Selbig 3. Prof. Dr. Martin Vingron
Tag der mündlichen Prüfung: 27. Februar 2006
Abstract
Understanding the mechanisms which control gene expression is one of the fundamental problems of molecular biology. Detailed experimental studies of regulation are laborious due to the complex and combinatorial nature of interactions among involved molecules. Therefore, computational techniques are used to suggest candidate mechanisms for further investigation.
This thesis presents three methods improving the predictions of regula- tion of gene transcription. The first approach finds binding sites recognized by a transcription factor based on statistical over-representation of short mo- tifs in a set of promoter sequences. A succesful application of this method to several gene families of yeast Saccharomyces cerevisiae is shown. More advanced techniques are needed for the analysis of gene regulation in higher eukaryotes. Hundreds of profiles recognized by transcription factors are pro- vided by libraries. Dependencies between them result in multiple predictions of the same binding sites which need later to be filtered out. Therefore, the second method presented here offers a way to reduce the number of pro- files by identifying similarities between them. Still, the complex nature of interaction between transcription factors makes reliable predictions of bind- ing sites difficult. Exploiting independent sources of information reduces the false predictions rate. The third method described here proposes a novel ap- proach associating gene annotations with regulation of multiple transcription factors and binding sites recognized by them. The utility of the method is demonstrated on several well-known sets of transcription factors.
Although the regulation of transcription is the major cellular mechanism of controlling gene expression, RNA interference provides a way of efficient down-regulation of specific genes in experiments. Difficulties in predicting efficient siRNA sequences motivated the development of a library containing siRNA sequences and related experimental details described in the literature.
This library, presented in details in the last chapter, is publicly available at http://www.human-sirna-database.net.
Keywords:
prediction of transcription factor binding sites, prediction of transcription factors functions, regulation of gene expression, similarity of transcription factor profiles
Zusammenfassung
Die Aufklärung der Mechanismen zur Kontrolle der Genexpression ist ei- nes der wichtigsten Probleme der modernen Molekularbiologie. Detaillierte experimentelle Untersuchungen sind enorm aufwändig aufgrund der kom- plexen und kombinatorischen Wechselbeziehungen der beteiligten Moleküle.
Infolgedessen sind bioinformatische Methoden unverzichtbar bei der Suche nach neuen Hypothesen, die dann in den Experimenten überprüft werden können. Diese Dissertation stellt drei Methoden vor, die die Vorhersage der regulatorischen Elementen der Gentranskription verbessern. Der erste Ansatz findet Bindungsstellen, die von den Transkriptionsfaktoren erkannt werden.
Es basiert auf der statistischen Überrepräsentation von kurzen Motiven in einer Menge von Promotersequenzen. Eine erfolgreiche Anwendung dieser Methode in der Hefe Saccharomyces cerevisiae wird vorgestellt.
Weiter fortgeschrittene Techniken sind allerdings notwendig, um die Gen- regulation in höheren Eukaryoten zu analysieren. In verschiedenen Daten- banken liegen Hunderte von Profilen vor, die von den Transkriptionsfakto- ren erkannt werden. Die Ähnlichkeit zwischen ihnen resultiert in mehrfachen Vorhersagen einer einzigen Bindestelle, was im Nachhinein korrigiert werden muss. Es wird deswegen eine Methode vorgestellt, die eine Möglichkeit zur Reduktion der Anzahl von Profilen bietet, indem sie die Ähnlichkeiten zwi- schen ihnen identifiziert. Die komplexe Natur der Wechselbeziehung zwischen den Transkriptionsfaktoren macht jedoch die Vorhersage von Bindestellen schwierig.
Auch mit einer Verringerung der zu suchenden Profile sind die Resulta- te der Vorhersagen noch immer stark fehlerbehafted. Die Zuhilfenahme der unabhängigen Informationsressourcen reduziert die Häufigkeit der Falschpro- gnosen. Die dritte beschriebene hier Methode schlägt einen neuen Ansatz vor, die die Gen-Anotation mit der Regulierung von multiplen Transkriptionsfak- toren und den von ihnen erkannten Bindestellen assoziiert. Der Nutzen dieser Methode ist demonstriert am Beispiel von verschiedenen wohlbekannten Sät- zen von Transkriptionsfaktoren.
Obwohl die Regulation der Transkription der wichtigste Mechanismus zur Kontrolle der Genexpression ist, bietet die RNA-Interferenz einen ef- fizienten experimentellen Weg zur gezielten Genausschaltung. Die Schwie- rigkeiten in der Vorhersage von effizienten siRNA Sequenzen motivierte die Entstehung einer Bibliothek mit solchen Sequenzen und dazugehörigen ex- perimentellen Details, die der Literatur entnommen sind. Die Bibliothek,
Schlagwörter:
Vorhersage von Transkriptionsfaktor-Bindungsstellen, Vorhersage der Funktion von Transkriptionsfaktor, Regulation von Gen-Expression, Änlichkeit von Transkriptionsfaktor-Profilen
vi
Contents
1 Introduction 1
2 Overrepresented words as regulatory elements 7
2.1 Introduction . . . 8
2.2 Materials and Methods . . . 9
2.2.1 Scoring motif frequencies . . . 10
2.2.2 Scoring positional information . . . 11
2.3 Results . . . 13
2.3.1 Evaluation of the frequency score . . . 13
2.3.2 Frequency score: variation of the parameters . . . 16
2.3.3 Combination of both scores . . . 17
2.4 Discussion . . . 20
3 Regulatory elements of AP-1 and RAS targets 23 3.1 Introduction . . . 24
3.2 Study of AP-1 regulated genes . . . 25
3.3 Study of the RAS-dependent genes . . . 28
3.4 Discussion . . . 30
4 Similarities of profiles recognized by transcription factors 35 4.1 Introduction . . . 36
4.2 Methods . . . 37
4.2.1 Jaspar and Transfac databases . . . 37
4.2.2 χ2-based distance D between position frequency ma- trices . . . 39
4.2.3 Correlation C of position weight matrices scores . . . 41
4.3 Results . . . 43
4.3.1 Comparison of both similarity measures . . . 43
4.3.2 Clusters of similar matrices in Jaspar and Transfac databases . . . 46
4.3.3 Mapping of novel matrices . . . 49 vii
5 Prediction of functions of transcription factors (TFGossip) 53
5.1 Introduction . . . 54
5.2 Materials and Methods . . . 56
5.2.1 TFGossip . . . 56
5.2.2 Gossip . . . 56
5.2.3 Data preparation . . . 58
5.3 Results . . . 59
5.3.1 Functions of E2F transcription factor . . . 59
5.3.2 Functions of NFAT and AP-1 transcription factors . . . 59
5.3.3 Processes regulated by muscle transcription factors . . 61
5.4 Discussion . . . 61
6 Human siRNA Database (HuSiDa) 69 6.1 Introduction . . . 70
6.2 Results . . . 71
6.2.1 HuSiDa – database . . . 71
6.2.2 HuSiDa – web interface . . . 72
6.3 Discussion . . . 73
7 Outlook 77 A Overrepresented words as regulatory elements 81 A.1 Z-score formula . . . 81
B Lists of similar profiles 85
viii
List of Figures
2.1 Overview of Z-score calculation . . . 11
2.2 Known binding sites of yeast gene families . . . 12
2.3 A pattern found in promoters of H-Ras regulated human genes 15 2.4 Frequency and positional scores in several families. . . 19
3.1 Predictions of AP-1 binding sites . . . 27
3.2 Predictions in promoters of RAS target genes . . . 29
3.3 Distance of binding sites as a function of a score threshold . . 31
3.4 GC-content of the promoters the RAS-dependent genes. . . 32
4.1 Variables of χ2-based similarity definition . . . 39
4.2 Example of χ2 based distance: CREB and ATF matrices . . . 40
4.3 Weight matrix score calculation . . . 43
4.4 Matrices of CREB and ATF: correlation of scores . . . 44
4.5 Comparison of similarity measures of matrices . . . 45
4.6 Similar Jaspar and Transfac matrices . . . 47
4.7 Examples of clusters of similar matrices . . . 48
4.8 Mapping of CLOCK-BMAL1 matrices . . . 49
5.1 Data flow in the TFGossip algorithm . . . 56
5.2 Details of the TFGossip algorithm . . . 57
5.3 Predicted functions of E2F transcription factors . . . 60
5.4 Predicted functions of NFAT and AP-1 transcription factors . 65 5.5 Skeletal muscle genes transcription factors (details) . . . 66
5.6 Skeletal muscle genes transcription factors (context) . . . 67
6.1 Human siRNA Database search form . . . 73
6.2 A browser of records matching a database query . . . 74
6.3 A view of a siRNA record . . . 75
ix
List of Tables
2.1 Known and predicted motifs in yeast families . . . 14 2.2 Top overrepresented words in two human families . . . 15 2.3 Overrepresented motifs as a function of the motif length . . . 16 2.4 Overrepresented motifs for different background models . . . . 17 2.5 Overrepresented motifs for different upstream lengths . . . 18 3.1 Predictions of AP-1 binding sites . . . 26 4.1 Properties of Jaspar and Transfac matrices . . . 38 4.2 Differences of nucleotide distributions reported by χ2 measure 40 B.1 Matrices of Jaspar mapped to Transfac . . . 86 B.2 Clusters of matrices in Jaspar and Transfac . . . 89
xi
Chapter 1 Introduction
Eukaryotes, from yeast to man, maintain diverse sets of genes whose ex- pression levels are modulated to satisfy the demands of developmental, envi- ronmental or physiological conditions. Although the abundance of proteins can be controlled through a variety of mechanisms, alteration of gene tran- scriptional rates is the most direct and utilized cellular tool [Wasserman and Fickett, 1998]. Transcription factors influence gene expression as an effect of binding to regulatory sites typically located in promoters or enhancers of the corresponding genes. Therefore, understanding the language of binding sites describing the influence of transcription factors on the expression of corre- sponding genes is one of the fundamental challenges of molecular biology.
Effects of binding of single or several transcription factors in a promoter of a specified gene may be studied individually in laborious experiments.
Complex interactions of many involved components may be analysed (e.g.
the analysis of the sea urchin Endo 16 gene showed that the upstream region of this gene contains at least 33 transcription factors binding sites in five modules, Yuh et al. [1998]).
Results of such experiments corresponding to particular transcription fac- tors may be collected together in order to construct a model of the sites recognized by the factor (an example is given in chapter 3, where I con- struct a set of sites recognized by AP-1). To ensure maximum specificity of such a model only those binding sites are desired for which there exist clear and direct evidence both for function and identity of the transcription factor bound. Analysis of such DNA binding sites can be conveniently divided into two subproblems [Stormo, 2000]. The first is, given a collection of known binding sites of a single transcription factor, to develop a representation of those sites which can be used to search new sequences and reliably predict where additional binding sites occur. The choice of the representation de- pends on the number of available known binding sites and how precisely the
1
experimentally found binding motifs have been identified. The second prob- lem is, given a set of DNA sequences expected to contain binding sites for a common transcription factor, but not knowing where the sites are, to dis- cover the location of the sites in each sequence. Here, a conceptually simple procedure – scoring binding site models along the sequences results in acurse of false positives. The rate of transcription factor binding site predictions varies for different binding models and their parameters, but typically a can- didate site is reported every 500-5000 bp [Wasserman and Sandelin, 2004].
It has been shown that employing other features of binding sites helps to reduce the number of false predictions by an order of magnitude.
Roulet et al. [2002] propose a computationally driven method combin- ing systematic evolution of ligands by exponential enrichment (SELEX) and serial analysis of gene expression (SAGE, Velculescu et al. [1995]). Their technique allowed the authors to construct a high-quality model of interac- tion between DNA and the CTF/NFI transcription factor. Moreover, whole chromosome studies utilizing chromatin immunoprecipitation and genomic microarray techniques (ChIP on chip) provide a method for measuring loca- tions of a large number of transcription factor binding sites simultaneously.
For example, the sites bound by p65 (belonging to NF-κB family) [Martone et al., 2003] and by CREB [Euskirchen et al., 2004] were globally identi- fied on the human chromosome 22. The results showed, that binding was not restricted to promoter regions; the sites were found elsewhere, including introns and unannotated chromosome regions. Moreover, binding was ob- served in front of genes whose expression was not altered, thereby suggesting that binding alone was not sufficient for gene activation. This observation motivates the development of concepts taking into account cooperative inter- actions between transcription factors, like the method for inferring functions of transcription factors (which will be presented in chapter 5).
Sequencing of the yeastSaccharomyces cerevisiae genome as well as large scale gene expression studies provided data motivating the design ofab-initio regulatory elements prediction algorithms. Analysis of the levels of gene expression after a known stimuli allows to extract clusters of genes following the same behavior in several time points or experimental conditions. In such cases co-expressed genes are assumed to be co-regulated by the externally induced factor, although it can not be excluded that the co-expression occurs by mere coincidence [Pilpel et al., 2001].
Several methods have been developed to identify the corresponding bind- ing sites, provided that short (< 2 kb) promoter sequences containing the sites can be reliably extracted. Since the non-coding parts of the yeast genome are relatively short, and using of the upstream untranslated se-
3 quences is a good approximation of the promoter regions, several algorithms successfully predict the right sites:
• Gibbs sampler [Lawrence et al., 1993], AlignACE [Roth et al., 1998]
detect motifs by aligning short fragments of the input promoter se- quences, based on the statistical method of iterative sampling. GLAM [Frith et al., 2004b] extends this approach by providing a way to de- termine the width of the aligned motif and to calculate the statistical significance of the alignment. MEME [Bailey and Elkan, 1994] uses expectation maximization and artificial intelligence heuristics to con- struct an alignment. In all cases the outcome is a matrix describing frequencies of nucleotides at the motif positions (PFM, positional fre- quency matrix). Its quality is growing with the number of aligned sequences.
• When the number of aligned sequences is small, providing a consensus sequence enumerating nucleotides at the motif positions provides sim- ilar information to PFM. Therefore, van Helden et al. [1998] extract regulatory sites from the sequences based on computational analysis of short words frequencies. The words are constructed from the nu- cleotides A, C, G, and T.
• The ITB algorithm [Kielbasa et al., 2001], which will be presented in chapter 2, fills the gap between the above methods. The idea behind our approach bases on the observation of the experimental cases in which the number of available promoter sequences is still small, but the variability of the binding sites is such, that an extended alphabet containing symbols alternatively representing multiple nucleotides are more appropriate.
The methods presented above were sufficient to detect a large class of regulatory elements in yeast but, as demonstrated in chapter 3, their appli- cability to human genomic sequences is limited, so more advanced approaches are necessary. Several features of higher eukaryotic sequences are responsible for this complication. The regulatory element prediction algorithms require at their input short sequences expected to contain the binding sites. But detailed experimental studies of promoter locations have been performed for a small fraction of human genes only [Perier et al., 1998]. Therefore, pro- moter prediction methods [Davuluri et al., 2001, Ohler et al., 2001, Liu and States, 2002, Scherf et al., 2000] need to be applied to the gene upstream sequences, which ideally should handle the issue of long introns, non-coding
first exons and multiple transcripts. Moreover, growing complexity of regu- latory interactions makes it difficult to distinguish direct and indirect effects in high throughput gene expression studies. This way the chances grow, that a gene is classified as regulated by a certain factor although it rather belongs to a cascade induced by the factor. Moreover, examples show, that there are cases where regulatory elements are located far from the regulated gene (≈ 40 kb) [Gottgens et al., 2000]. Due to these reasons a binding site pre- diction algorithm needs to take into account that some of supplied sequences have poor overlap with the core promoters.
Consequently, concepts utilizing various properties of regulatory mecha- nisms have been developed to improve specificity of the predictions:
• Bussemaker et al. [2001], Caselle et al. [2002] propose to eliminate the clustering step needed to create a list of genes believed to be co- regulated. Instead, correlating presence of binding sites with gene ex- pression levels directly is suggested.
• Wagner [1997] proposes a method which takes advantage of the fact that many transcription factors show cooperativity in transcriptional activation. The algorithm detects closely spaced binding sites of the same transcription factor.
• Pilpel et al. [2001], Frith et al. [2002, 2003], Murakami et al. [2004]
construct techniques scoring overrepresented close occurrences of bind- ing sites recognized by different transcription factors. Experimental observations of such pairing are also collected in dedicated databases [Kel-Margoulis et al., 2000]. Furthermore, a computational analysis of the whole human genome is available [Hannenhalli and Levy, 2002].
• Phylogenetic footprinting – preferential conservation of functional se- quences over the course of evolution by selective pressure results in a striking enrichment of regulatory sites among the conserved regions [Di- eterich et al., 2002, Wasserman et al., 2000]. These lines were followed to combine the knowledge of co-regulation among different genes and conservation among orthologous genes to improve the identification of motifs [Wang and Stormo, 2003, Lenhard et al., 2003].
• Frith et al. [2004a] contributes with a method taking into account in probability calculations the possibility, that a part of genes is incor- rectly assigned to co-regulated set of genes.
The majority of the methods presented above require a collection of pro- files recognized by transcription factors as the input data. Typically the
5 provided profiles are treated as mutually independent (i.e. associated with different transcription factors). This assumption is not easy to guarantee, especially if profiles from a library (Jaspar [Sandelin et al., 2004a], Transfac [Wingender et al., 1996, 2000, Matys et al., 2003]) are used. Moreover, in some applications the libraries providing several hundred of records are too large and selection of a core subset is needed. These observations motivated the development of measures allowing to compare and filter the profiles rec- ognized by transcription factors. The details of this study are provided in chapter 4.
It has been widely accepted that improving the quality of transcription factor binding site predictions requires to employ many of the binding site properties in a statistically correct way [Sandelin et al., 2004b]. Since each of these features may reduce the number of the false positive predictions, following Kielbasa et al. [2004a] and Blüthgen et al. [2005b] I present in chapter 5 a method associating cooperative binding of transcription factors with biological functions of the corresponding genes. This novel approach, utilizing growing public gene annotations, not only provides a new technique for narrowing the list of genes involved in regulation of a process, but it also allows direct inferring the processes controlled by studied factors.
Finally it should be mentioned, that practical applications of the pre- sented tools require comfortable and easy user interfaces. The development of HomGL [Blüthgen et al., 2004], a web-based application for retrieval of upstream homologous human/mouse/rat sequences, was partially influenced by the requirements of transcription factor binding site prediction methods.
Additionally, the SeqVISTA application [Hu et al., 2004], provides a unified interface able to request calculations as well as visualize the results of many algorithms presented above.
Despite the fact, that alteration of gene transcription is the most di- rect and utilized regulatory tool, in recent years another cellular mecha- nism attracted efforts of experimental groups. RNA interference (RNAi) is a sequence-specific posttranscriptional mechanism, which is triggered by double-stranded RNA and causes degradation of mRNAs homologous in se- quence to the introduced dsRNA Elbashir et al. [2002]. The hallmark of RNAi is its specificity – carefully designed short interfering RNA sequence (siRNA) is able to reduce the expression of the gene from which the sequence is derived, with minor effects on the expression of genes unrelated in sequence [Fire et al., 1998]. Moreover, the induced gene silencing is reversible and thus does not appear to reflect a genetic change. Therefore, siRNAs have provided a new tool for studying gene functions.
It has been observed, that siRNA sequences which target different regions
of the same mRNA vary significantly in their effectiveness [Holen et al., 2002, Reynolds et al., 2004]. Many factors are likely to be responsible for that fact, including nucleotide composition of the siRNA sequence, presence of specific nucleotide patterns, mRNA secondary structure, etc. Therefore, costly search for new siRNAs prompted many groups to design algorithms predicting active sequences for genes specified by a user [Ui-Tei et al., 2004, Amarzguioui and Prydz, 2004, Reynolds et al., 2004, Khvorova et al., 2003, Saetrom, 2004]. Although the quality of predictions is growing, as it has been pointed out by Saetrom and Snove [2004], an independent and publicly available database containing a large collection of verified siRNA sequences should be established. This suggestion motivated us [Truss et al., 2005] to design the Human siRNA Database of the siRNA molecules and important technical details of the corresponding gene silencing experiments which I present in details in chapter 6. The database is available at the address http://www.human-siRNA-database.net.
Chapter 2
Overrepresented words as regulatory elements
Summary
Microarray studies analyse expression of a large number of genes in a num- ber of conditions or time points. Groups of genes following similar expression patterns are a typical result of such experiments. Emergence of such a pat- tern suggests existence of a regulatory mechanism shared within a group. In higher organisms control of gene expression is typically mediated by complex interactions involving many factors (studied later in chapter 5). In contrast, in lower eukaryotes the regulation can often be understood as an effect of a single factor. Assuming an existence of a single transcription factor regulat- ing a given gene family, it is possible to construct an algorithm to discover an unknown binding profile of this factor. This chapter presents a program ITB (Integrated Tool for Box finding, Kielbasa et al. [2001]), capable to build a ranked list of candidate profiles, which are significantly overrepresented in the upstream regions of a group in comparison to a training (reference) set of upstream gene sequences. The profiles are modeled as short words built up of simple nucleotidesA, C,G orT, as well as their mixed forms (expressed with the IUB nucleotide code). Given a profile length, possible words are ex- haustively enumerated while their probabilities are estimated and ranked for final evaluation (discussed in details in section 2.2). The results section 2.3 presents an application of the method to several yeast Saccharomyces cere- visiae gene groups and compares them to known experimental data. Chap- ter 3 discusses usage of the method for higher eukaryotes.
7
2.1 Introduction
Even though a number of genome projects have been completed on the se- quence level, only a small fraction of mechanisms governing gene expression have been identified. Using hundreds of profiles recognized by transcription factors, available in databases (Jaspar [Sandelin et al., 2004a], Transfac [Win- gender et al., 1996, 2000, Matys et al., 2003]), a promoter of a gene might be scanned for candidate binding sites [Stormo, 2000]. In practical applications such a simple approach leads to results difficult to interpret. Since exper- imental locations of real promoters are rarely known, they have either to be computationally predicted or sequences located upstream of gene coding regions are taken instead. In addition, simple techniques of calculating bind- ing probabilities result in a large number of false positive signals [Wasserman and Sandelin, 2004].
Therefore incorporation of independent experimental results may improve the prediction quality. High throughput differential expression measurements provide data describing transcription levels of genes of various model or- ganisms in response to environmental stimuli. Typically, groups of genes following similar expression patterns are constructed with the help of clus- tering algorithms [Herzel et al., 2001]. Genes belonging to such a group are assumed to be members of a family of genes regulated by the same tran- scription factor. Based on this assumption, the gene upstream regions are studied in order to extract transcription factor binding sites [Brazma et al., 1998, Roth et al., 1998, van Helden et al., 1998, Zhang, 1999, Hughes et al., 2000].
Several different approaches are used to detect regulatory elements in the promoter/upstream regions of co-regulated genes. An exhaustive algorithm RSA-tools-oligo-analysis [van Helden et al., 1998] compares the frequencies of conserved words (built of nucleotidesA, C,G orT) in a given set of promoter sequences to the corresponding frequencies in a reference set (in the following termed training set). This method is sensitive in detecting over-represented words in the upstream regions of co-regulated yeastSaccharomyces cerevisiae genes. Unfortunately, regulatory elements lacking a conserved core sequence might remain undetected by this method.
Weight matrix based methods like AlignACE [Roth et al., 1998] (based on the Gibbs sampling algorithm, first described by Lawrence et al. [1993]), MEME [Bailey and Elkan, 1994], or recently developed GLAM [Frith et al., 2004b] use a multiple alignment strategy to detect the signals of DNA reg- ulatory elements. In this way, elements lacking a conserved core may be found. However, signals due to regulatory elements involved in transcription are rather weak. If only a small number of motifs occur in the co-regulated
9 sequence set (or simply a small number of sequences is available), weight matrices are of limited use. In such a case, mono- or dimeric repeats or non-specific signals like the motif AAATAA are more likely to be aligned than functional regulatory elements.
An intermediate solution, usable for small sets of co-regulated genes, is to search exhaustively for regulatory elements expressed with symbols match- ing multiple bases. Based on Kielbasa et al. [2001], this chapter presents such a method – the ITB algorithm (Integrated Tool for Box finding), which integrates frequency and positional information to predict transcription fac- tor binding sites in upstream regions of co-regulated genes. Short regular expression-like patterns, allowing small gaps and matching of more than one nucleotide at a position, are analyzed exhaustively and ranked according to two independent scores. The first one, discussed in details in section 2.2.1, scores overrepresentation of a motif within the co-regulated genes as com- pared to a training set of genes. An idea similar in spirit was proposed independently by Sinha and Tompa [2000]. The second score, mentioned in section 2.2.2, uses a method developed with Jan Korbel, which ranks pref- erences of the motif candidates to cluster in a certain location relative to the transcription start sites. Results of applying both of the scores to sev- eral yeast Saccharomyces cerevisiae families (extracted as described in sec- tion 2.2) are presented in details in section 2.3. Additionally, an application of the program to a set of genes predicted to be RAS targets is shown there as well.
2.2 Materials and Methods
Prior to the development of the ITB algorithm a study has been done to identify sets of genes in the yeast Saccharomyces cerevisiae genome, known to be regulated by the same transcription factor. This way 11 families of genes were constructed, in which the factors as well as the corresponding binding site profiles were known. Gene families for the transcription factors: Gln3, Cbf1/Met4/Met28, Met31/Met32, Pdr1/Pdr3, Ino2/Opi1, Mig1, Yap1 and Gal4 have been provided by van Helden et al. [1998]. Additionally, a family corresponding to the Matα2 transcription factor was constructed based on DNA microarray experiments that revealed genes with a mating type specific transcriptional regulation [Roth et al., 1998]. The top ten transcripts whose expression levels increased the most in mating type "a" relative to "α" were chosen (genes: MFA1, MFA2, AGA2, STE2, BAR1, PMP1, SRA3, VPS13, YKR071C and YBR147W). DNA sequences were retrieved from the MIPS database [Mewes et al., 1997] by extracting 800 bp long regions upstream of
the corresponding ORFs. As the training set all yeast upstream sequences were used.
Besides, two human sequence sets were studied. Zuber et al. [2000] re- ported the down-regulation of several genes via the human H-Ras protein involving the RAF/MEK/ERK cascade of cytoplasmic kinases. Five pro- moter regions of co-regulated genes (LOX, LOXL1, LOXL2, RIL/LIM and TSP1) were kindly provided by the group. Moreover, four promoter se- quences of genes (EP11114, EP15041, EP36018 and EP37001) up-regulated via the c-Myc protein [Coller et al., 2000] were extracted from the EPD database [Perier et al., 1998]. In case of human analysis 271 human pro- moter sequences available in the EPD database were used as the training set. This set did not include the studied genes regulated via H-Ras. For the analysis of c-Myc-controlled genes, the four promoters extracted from EPD were removed from the training set.
The ITB program performs an exhaustive search – scores are calculated for all possiblen-mers built of the nucleotide alphabetACGTor from the stan- dard IUB nucleotide code ACGTWSRKYMN (where degenerated symbols stand for any of the enumerated nucleotides: W → AT, S → CG, R → AG, K → GT, Y → CT, M → AC, N → ACGT). Symbols matching three nucleotides are not studied, since for small numbers of matches the difference between them and N can be neglected. After analysis, both scores are visualized on a scatter plot. On request, self-overlapping patterns with a periodicity of one or two (e.g. AAAAAA orAWAWAW) are removed from the output.
2.2.1 Scoring motif frequencies
The first score used by the ITB algorithm compares observed frequencies of conserved elements in the given genomic sequence set to their expected frequencies, estimated based on a training (background) set (see Fig. 2.1).
The Z-score functionZ(W)[van Helden et al., 2000a] is used as the scoring formula for a motif W. It characterizes the difference between the observed number of occurrences nobs(W) of the motif W (on any strand) and the expected mean number µ(W), scaled by the expected standard deviation of the motifσ(W):
Z(W) = nobs(W)−µ(W)
σ(W) . (2.1)
The standard deviation of the motif is estimated based on expressions which take into account the possibility of motif self-overlapping (e.g. AAAAAA or TATATA) [Pevzner et al., 1989]. These formulae have been adapted for a double-strand analysis and for the degenerated alphabet (see Appendix A
11
Figure 2.1: Overview of Z-score calculation.
for a detailed derivation):
µ(W) = X
w∈W
N p(w),
σ2(W) = X
w∈W
N p(w) (1−p(w)) + 2
LW−1
X
s=1
(N−sM) X
w,v∈W
(πsw,v−p(w)p(v)), (2.2) where N is the total number of possible motif positions in the co-regulated set ofM promoters. By definitionW is a set of all oligonucleotides expressed with the simple alphabet ACGT, which match the pattern W or the pattern complementary to it1. The number of letters in the pattern W is represented byLW.
The remaining two symbols p(w) and πsw,v link the Z-score formula to the background model constructed on the training set. p(w)is the estimated probability of the sequence w. πw,vs expresses the probability of a sequence built by overlapping the sequences v at position s + 1 and w at the first position2. These probabilities are estimated with Markov models built on the training set. Here,w and v always denote motifs which consist only the simple nucleotides ACGT.
2.2.2 Scoring positional information
Experimentally verified binding sites of 52 yeast transcription factors were extracted from the SCPD database [Zhu and Zhang, 1999]. While locations
1For example, if W = ASTG the described expansion gives W = (ACTG, AGTG, CAGT, CACT).
2For exampleπATAC,ACGG
2 =p(ATACGG), πATAC,TTGG
2 = 0.
Figure 2.2: The locations of experimentally verified binding sites of Matα2, Gcn4, Pho4, and Gal4 in gene upstream regions. All positions were extracted from SCPD [Zhu and Zhang, 1999] and are relative to the translation start site. The lines at the bottom (denoted "[all]") show positions of all respective transcription factor binding sites marked along a single axis. Gene sets shown here are a part of the regulatory families analyzed in this study.
of some of the sites appear randomly distributed over the corresponding up- stream regions, a high proportion of the sites reveals a strong position bias.
For Gal4, Gcn4, and Matα2 a clustering was observed, despite the alignment of sequences according to the translation start sites instead of the transcrip- tion start sites (see Fig. 2.2). Therefore, the second score used by the ITB algorithm bases on the observation that transcription factor binding sites are often clustered or appear at preferred positions. A procedure (implemented by Jan Korbel in Kielbasa et al. [2001]) scores locations of motifs in gene upstream regions. Positions of all occurrences of a studied motif W within the upstream sequences are collected and marked on a single axis. Then, the lengths of the shortest distances l with a given number of motifs inside (n= 2,3, . . .) are measured. Probability p(n, l) of observing n motifs over a distancelis estimated with stochastic simulations. The negative logarithm of p(n, l)for the most unprobable pair(nW, lW)constitutes the motif positional score.
13
2.3 Results
2.3.1 Evaluation of the frequency score
The frequency score calculation procedure was applied to the genes belonging to the collected transcription factor families. The simple nucleotide alphabet ACGT, as well as the degenerated alphabet ACGTWRKSYMN were used. Over- represented motifs of length 6 bp were searched in 800 bp long upstream sequences of the respective genes. The background probabilities were esti- mated with a Markov model of order 3. An option to remove self-overlapping patterns with a periodicity of 1 or 2 was applied. The motifs of 10 highest Z-scores were studied.
An analysis performed on randomized sets of sequences revealed that the Z-scores were distributed nearly Gaussian, with no more than 0.5% of motifs with the Z-score greater than 3 and with less than 0.0001% of motifs with the Z-score above 5.
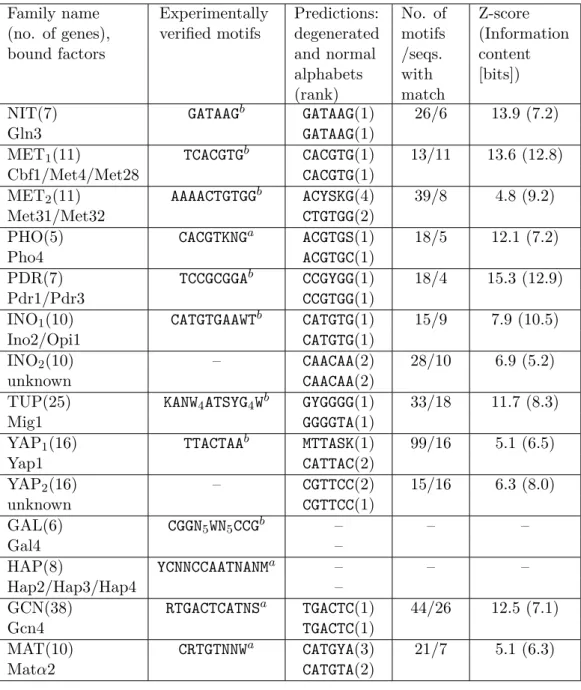
Tab. 2.1 shows results of an analysis of 11 co-regulated yeast Saccha- romyces cerevisiae gene sets. Most previously characterized yeast regulatory elements are correctly predicted. In the families: NIT, MET, INO, PHO, PDR, GCN, YAP, and TUP the highest scoring motifs matched previously characterized transcription factor binding sites. Analysis of the MAT family revealed a motif corresponding to a previously described consensus sequence at rank 3. In the MET family, a second site previously characterized as not directed by the Cbf1/Met4/Met28-complex but by Met31/32 [Kuras et al., 1996] was also found. In most families analyzed, several of the top predic- tions partly matched previously identified consensus sequences. Principally similar results were obtained independently of the alphabet used.
In addition to matches to previously identified consensus sequences, a number of sequences not matching known transcription factor binding sites were predicted. In particular, the motifsCAACAA predicted in the INO family (Z-score 6.9, information content35.2 bits) andCGTTCC(6.3, 8.0 bits) found in the YAP family stand out with significant scores. Several other high scoring motifs, which self-overlap several times, were not considered as promising candidates.
The frequency score analysis failed to detect two known elements – the consensus sequences of the transcription factors regulating the GAL and HAP families.
The publicly available algorithms AlignACE version 3.0 [Roth et al.,
3The information content is calculated as in introduced in Schneider et al. [1986] for skewed genomes. Additionally, the sampling error correction by Miller and Quastler [1955]
is applied.
Family name (no. of genes), bound factors
Experimentally verified motifs
Predictions:
degenerated and normal alphabets (rank)
No. of motifs /seqs.
with match
Z-score (Information content [bits])
NIT(7) GATAAGb GATAAG(1) 26/6 13.9 (7.2)
Gln3 GATAAG(1)
MET1(11) TCACGTGb CACGTG(1) 13/11 13.6 (12.8)
Cbf1/Met4/Met28 CACGTG(1)
MET2(11) AAAACTGTGGb ACYSKG(4) 39/8 4.8 (9.2)
Met31/Met32 CTGTGG(2)
PHO(5) CACGTKNGa ACGTGS(1) 18/5 12.1 (7.2)
Pho4 ACGTGC(1)
PDR(7) TCCGCGGAb CCGYGG(1) 18/4 15.3 (12.9)
Pdr1/Pdr3 CCGTGG(1)
INO1(10) CATGTGAAWTb CATGTG(1) 15/9 7.9 (10.5)
Ino2/Opi1 CATGTG(1)
INO2(10) – CAACAA(2) 28/10 6.9 (5.2)
unknown CAACAA(2)
TUP(25) KANW4ATSYG4Wb GYGGGG(1) 33/18 11.7 (8.3)
Mig1 GGGGTA(1)
YAP1(16) TTACTAAb MTTASK(1) 99/16 5.1 (6.5)
Yap1 CATTAC(2)
YAP2(16) – CGTTCC(2) 15/16 6.3 (8.0)
unknown CGTTCC(1)
GAL(6) CGGN5WN5CCGb – – –
Gal4 –
HAP(8) YCNNCCAATNANMa – – –
Hap2/Hap3/Hap4 –
GCN(38) RTGACTCATNSa TGACTC(1) 44/26 12.5 (7.1)
Gcn4 TGACTC(1)
MAT(10) CRTGTNNWa CATGYA(3) 21/7 5.1 (6.3)
Matα2 CATGTA(2)
Table 2.1: Similarity of known and predicted binding sites in upstream re- gions of genes belonging to families of 11 yeast Saccharomyces cerevisiae transcription factors. Experimentally verified consensus sequences are taken from Transfaca [Wingender et al., 1996] or from van Helden et al. [1998]b.
15 Family name
(no. of genes), bound factors
Experimentally verified motifs
Predictions:
degenerated and normal alphabets (rank)
No. of motifs /seqs.
with match
Z-score (Information content [bits])
c-Myc(4) CACGTGa – – –
c-Myc/Max –
Ras(5) – CGARCG(1) 9/4 10.1 (10.9)
unknown CGAGCG(1)
Table 2.2: Results of the frequency score calculation in two human fami- lies. The experimentally verified consensus sequence is taken from Transfaca [Wingender et al., 1996].
1998], RSA-tools-oligo-analysis [van Helden et al., 1998], and MEME ver- sion 2.2 [Bailey and Elkan, 1994] were also applied to detect motifs in the 11 yeast regulatory families. No algorithm was able to detect all of the described motifs.
In order to evaluate the applicability of the frequency score for the pre- diction of functional sites in the human genome, the algorithm was applied to human sequences (Tab. 2.2). No significant motif similar to the expected element CACGTG was found in the promoters of genes regulated via c-Myc.
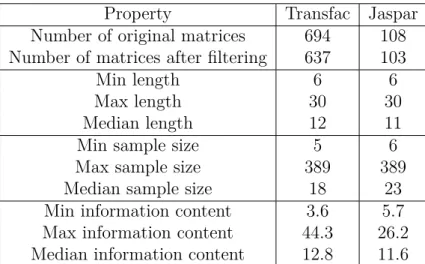
In contrast, the analysis of five genes regulated via H-Ras revealed the sig-
Figure 2.3: A sequence logo [Schneider and Stephens, 1990] of the significant pattern CGARCG found in promoters of human genes regulated via H-Ras.
Bars correspond to sample size error corrections.
nificant pattern CGARCG (Z-score=10.1, information content=10.9 bits, see Fig. 2.3). The motif does not match any previously characterized site listed in the Transfac database [Wingender et al., 1996] and does not self-overlap in the promoter sequences matched.
2.3.2 Frequency score: variation of the parameters
In order to verify the motif predictions and to test the robustness of the algorithm, analyses were repeated with different sets of initial parameters.
The calculations were performed with the nucleotide alphabetACGT. In each run, a single parameter was changed while all other parameters were kept at their default values (motif length 6, upstream region of 800 bp, Markov model of order 3).
Family Motif 4 5 6 7 8
NIT GATAAG 4.5(1) 7.0(1) 13.9(1) 12.0(2) 10.0(15) MET1 TCACGTG 5.0(1) 6.1(1) 13.7(1) 23.7(1) 24.3(1) MET2 AAAACTGTGG 2.4(4) 4.4(3) 5.0(2) 10.6(2) 15.6(3) PHO CACGTKNG 5.8(1) 9.4(1) 10.3(1) 12.9(1) 16.8(1) PDR TCCGCGGA 6.2(1) 8.1(1) 11.8(1) 16.0(2) 24.2(1) INO1 CATGTGAAWT 1.7(12) 3.0(10) 7.9(1) 11.0(1) 19.3(1) INO2 aCAACAAs∗ 4.1(1) 5.2(1) 6.9(2) 6.8(7) 6.9(40) TUP KANWWWWATSYGGGGW – 8.7(1) 10.2(1) 11.3(1) 12.7(2) YAP1 TTACTAA 1.8(8) 4.3(2) 5.1(2) 7.7(1) 9.9(2) YAP2 cCGTTCCs∗ 1.6(16) 3.3(4) 6.3(1) 6.5(5) 9.1(5) GCN RTGACTCATNS 4.5(1) 7.5(1) 12.5(1) 12.8(1) 13.5(1) MAT CRTGTNNW 2.0(8) 4.0(4) 5.1(2) 6.8(4) 6.0(38) Table 2.3: Z-scores of predicted motifs as a function of the searched motif length (4, . . . , 8). Only complete or shifted by 1 bp matches to previously identified consensus sequences were considered. Z-scores of the most over- represented oligonucleotides matching known consensus sequences are pre- sented besides the ranks of the motifs (in brackets). ∗Patterns marked with a star represent new motif candidates.
Applying different word lengths revealed highly ranked motifs that match previously identified consensus sequences for most analyzed patterns (see Tab. 2.3 for results regarding the YAP and INO families). In this analysis, only complete matches to previously identified consensus sequences were con- sidered (shifts of motifs by a maximum of 1 bp were allowed). When word lengths of 5 to 7 were selected, the top predictions for 6 regulatory families revealed complete matches to previously identified transcription factor bind- ing sites. Choosing larger or smaller motif lengths led to worse predictions of corresponding known sites, but often provided additional information for motifs with wider conserved cores (e.g. the pattern CATTACTAA of the YAP family).
Moreover, the predictions were analyzed for different background models
17
Family Motif E B M1 M2 M3 M4 F
INO1 CATGTG 5.4(17) 6.3(4) 6.6(2) 6.5(2) 7.9(1) 7.5(1) 7.7(1) INO2 CAACAA∗ 12.0(2) 9.7(1) 7.8(1) 8.4(1) 6.9(2) 5.9(2) 6.0(2) YAP1 CATTAC 5.9(25) 4.3(16) 5.4(2) 6.5(1) 4.5(3) 5.2(2) 5.0(2) YAP2 CGTTCC∗ 3.5(72) 6.6(5) 6.8(1) 6.3(2) 6.3(1) 6.5(1) 6.4(1) Table 2.4: Z-scores (and their ranks) of motifs best matching the experimen- tally known consensus sequences depending on the background model (E = equiprobable base distribution; B = single nucleotide probabilities/Markov model order 0; M1, . . . , M4 = Markov chain models of the orders 1 to 4; F = probability of motifs based on the 6-mer frequency in the training set/Markov model order 5). ∗Patterns marked with a star represent new motif candidates.
(results regarding the YAP and INO families are presented in Tab. 2.4).
Assuming equal and independent probabilities of all nucleotides typically lower Z-scores were observed. When instead single nucleotide probabilities were considered, or when a Markov chain model of the order 1 was applied, the resulting predictions were better, but still biased towards non-specific, partly self-overlapping patterns. Applying Markov chain models of the orders 2 to 5 revealed the highest numbers of motifs that match previously identified consensus sequences.
Finally, the robustness of the predictions was tested for variations of the analyzed sequence length upstream of the translation start. It could be observed that there exist motifs, which have significantly higher scores for particular lengths of the upstream regions. These peaks of Z-score indicate strong positional preferences of particular motifs. For instance, the pattern CATGTA matching a known regulatory element of the MAT family revealed the highly significant Z-score of 7.7 and the top rank for an upstream region length of 400 bp, while a score of only 5.1 and the rank 2 resulted applying the default length of 800 bp.
Generally, the analysis of varying upstream sequence lengths indicates that most functional elements of yeast can be detected, when 800 bp up- stream of the translation start are analyzed (see Tab. 2.5).
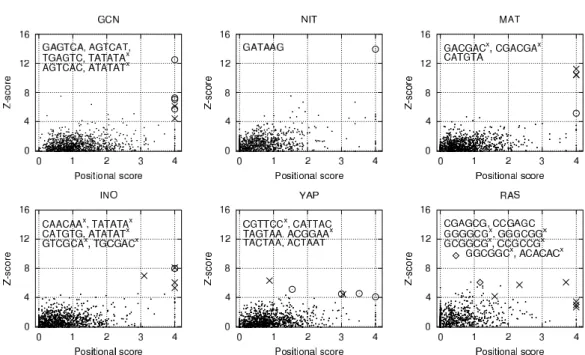
2.3.3 Combination of both scores
Scatter plots are a convenient representation of results of regulatory element search obtained with the ITB algorithm. For each studied motif the fre- quency score and the positional score constitute coordinates of a point on a
Family Motif 400 500 600 700 800 900 1000 NIT GATAAG 13.2(1) 16.9(1) 15.8(1) 15.1(1) 13.9(1) 13.5(1) 12.6(1) MET1 CACGTG 12.0(1) 13.5(1) 14.7(1) 14.7(1) 13.7(1) 12.7(1) 12.0(1) MET2 CTGTGG 5.6(3) 4.7(4) 5.5(3) 5.5(2) 5.0(2) 4.4(8) 4.0(9)
PHO GCACGT 8.8(1) 10.0(1) 12.1(1) 11.0(1) 10.3(1) 10.3(1) 9.7(1) PDR CCGTGG 8.3(1) 8.6(1) 11.4(1) 11.6(1) 11.8(1) 11.0(1) 10.3(1) INO1 CATGTG 10.5(1) 9.2(1) 8.1(1) 7.3(1) 7.9(1) 8.5(1) 7.9(2) INO2 CAACAA∗ 2.9(20) 3.1(23) 3.6(11) 4.4(5) 6.9(2) 7.5(2) 8.1(1) TUP GGGGTA 5.2(3) 5.5(2) 10.2(2) 9.2(2) 10.2(1) 9.8(1) 9.1(1) YAP1 CATTAC 2.8(28) 4.4(6) 4.5(6) 5.4(2) 5.1(2) 4.4(3) 5.2(2) YAP2 CGTTCC∗ 6.4(1) 6.1(2) 5.3(4) 5.8(1) 6.3(1) 5.7(1) 6.2(1) GCN TGACTC 16.8(1) 15.9(1) 14.5(1) 13.4(1) 12.5(1) 11.4(1) 11.1(1) MAT CATGTA 7.7(1) 6.6(1) 5.8(2) 5.1(2) 5.1(2) 4.6(3) 4.2(4) Table 2.5: Z-scores (and their ranks) of yeast motifs predictions as a function of the analyzed sequence lengths (in bp, upstream of the translation start site). ∗Patterns marked with a star represent new motif candidates.
scatter plot. Fig. 2.4 presents results of analysis for five yeastSaccharomyces cerevisiae gene families and a set of human genes regulated by the H-Ras.
Motifs of length six constructed out of the standard nucleotide alphabetACGT were enumerated in this analysis. Signals of motifs corresponding to known consensus sequences often appeared to have large scores and therefore to be located at the top right corner of the plots. Moreover, sequences similar to the expected patterns were frequently detected with high scores. When the MET, GCN, INO, TUP and NIT families were analyzed, signals correspond- ing to previously identified motifs represented the most appealing predictions clearly separated from the other spots. In case of the PDR and PHO fam- ilies, several variations of the expected sequences TCCGCGGA and CACGTKNG were predicted – at least one of each having both significant Z-scores and positional scores.
Moreover, ITB extracted new candidates for transcription factor binding sites. For instance, an analysis of the PHO family revealed the significant candidate CGTATA (Z-score 4.4, positional score 3.2). However, significant positional scores are often caused by strongly self-overlapping signals. In the MAT family, the three highest-scoring motif candidates represent shifted variations of the strongly self-overlapping GACGAC. The previously identified motif CATGTA represents the most appealing prediction of this family, if the former three signals are not considered. The new candidate CAACAA of the INO family revealed lower scores than the expected CATGTG. However, a cal-
19
Figure 2.4: Scatter plots combining the frequency Z-score and the positional score calculated by ITB (using the nucleotide ACGT alphabet). Five yeast Saccharomyces cerevisiae co-regulated gene families and human genes co- regulated via H-Ras were analyzed. Circles correspond to motifs matching previously identified consensus sequences, while crosses (’x’) indicate new candidates for sequences recognized by the transcription factors. Diamonds indicate oligonucleotides matching the degenerated motif CGARCG, which had been found independently by the frequency score calculation procedure when the alphabet containing degenerated bases was used. Oligonucleotides are listed from the left to the right (or – if signals are one upon the other – from the top to the bottom). Self-overlapping motifs were not removed from the output.
culated Z-score of 6.9 along with a significant positional score of 3.1 stress the potential importance of the candidate. In the case of the YAP family motifs representing good matches to the expected motif TTACTAA or the potential candidate CGTTCC were found at the top right corner.
Analyzing the human genes co-regulated via H-Ras revealed a number of potential motif candidates. However, most of those signals represent strongly self-overlapping sequences or rather non-specific sequences like GGGCGG or GGGGCG. The sequenceCCGAGC, a good (shifted) match to the previously iden- tified candidate CGARCG (see Fig. 2.3), revealed a significant Z-score of 6.1 along with a positional score of 1.2.
2.4 Discussion
ITB (Integrated Tool for Box finding introduced in section 2.2) is a sensitive and powerful algorithm integrating frequency and positional information to detect transcription factor binding sites in promoters of co-regulated genes.
The algorithm performs an exhaustive search for regular expression-like pat- terns, allowing matching of more than one nucleotide at any position a motif.
Such an approach may be considered as a good compromise between searches for frequent oligonucleotides and weight-matrix based methods. It allows the detection of motifs that are not completely conserved – and it guarantees to find the most significant elements due to the exhaustive search strategy. In order to correct an enlarged variance of the number of motifs due to self- overlapping, an appropriate correction formula is applied (Eq. 2.2). Sinha and Tompa [2000] provide an analysis of the algorithm complexity as the function of the alphabet size and the length of studied motifs.
Based on the performed parameter variations motifs of lengths six or seven nucleotides were found as a reasonable choice for performing searches with ITB in the yeastSaccharomyces cerevisiae genome, although analyzing wider sequences may still provide further information. Modeling background probabilities with Markov models of orders from two to five led to compa- rable predictions. Variation of upstream sequence lengths led to significant changes of the frequency scores, indicating positional peculiarities of yeast motifs. ITB detected highly significant motifs corresponding to functional regulatory elements found by experimental analysis. Only a limited set of additional patterns was predicted. Even when positional information was not considered, known regulatory elements of 8 out of 11 yeast regulatory fami- lies were predicted correctly using the alphabet allowing matches of multiple nucleotides. Similar results were obtained using the standardACGTalphabet.
Combining both the frequency score (section 2.2.1) and the positional score (section 2.2.2) increases the specificity of ITB. Motifs with significant positional scores, which correspond to previously identified consensus se- quences, were extracted from 9 out of 11 families (see section 2.3.3). Only few new candidate motifs having both high positional and frequency scores were predicted. A couple of reasons might lead to the observed positional preferences. Among these are interactions of transcription factors with the pre-initiation complex, the removal of single nucleosomes within a promoter, protein-protein interactions within factors that stabilize weak protein-DNA interactions, or recent duplications of regulatory regions. Moreover, an ac- cumulation of functional sites might serve to increase the local concentration of transcription factors.
ITB failed to detect described consensus sequences of two yeast fami-
21 lies (presented in Tab. 2.1). Some tools like AlignACE, Dyad-detector [van Helden et al., 2000b] or the method in Sinha and Tompa [2000] are capable of predicting the consensus described for the GAL family. ITB does not detect sequences like the Gal4 binding site containing longer gaps.
Some motifs predicted by ITB are potential candidates for novel yeast transcription factor binding sites. The elementsCGTTCCandCAACAArepresent strong candidates for regulatory elements involved in the regulation of the YAP and INO families. Moreover, analysis of the PHO family revealed a significant candidate CGTATA. These predictions are highly robust against variations of the algorithm parameters. Furthermore, the calculation of high positional scores for the candidates or at least for other motifs matching the candidates supports a selection of these patterns. Searching Transfac [Wingender et al., 1996] for the elements CGTTCC, CAACAA and CGTATA did not reveal matches to known yeast consensus sequences.
Since ITB succeeded in detecting regulatory elements in yeast upstream regions, it might sound reasonable to assume that this method may also work in human promoters. This chapter presents results for two human gene sets.
The expected binding site was not detected for genes controlled by the c-Myc transcription factor, but the motif CGARCG appears as a candidate transcrip- tion factor binding site of genes co-regulated via H-Ras. However, the mech- anisms regulating transcription in higher eukaryotes are significantly more complex. The ITB algorithm assumes a direct interaction of a single tran- scription factor with upstream regions close to the genes. However, in higher organisms a cooperation of many factors needs to be taken into account (more details in chapter 5). Moreover, active promoters are often located far from protein coding sequences. Unfortunately, only a limited number of experi- mentally verified promoter sequences is available [Perier et al., 1998, Suzuki et al., 2002], therefore prediction algorithms might have to be used. Ad- ditionally, larger gene regulatory networks make direct and indirect targets more difficult to distinguish. Usage of proper training sets and the reliable detection of co-regulated genes are prerequisites for an analysis of regulation in the genomes of higher eukaryotes [Herzel et al., 2001]. Since these prob- lems cannot be left aside, applications of several algorithms (including ITB) applied to human sequences are studied in detail in chapter 3.
Chapter 3
Regulatory elements of AP-1 and RAS targets
Summary
This chapter contains a description of a computational tool designed for prediction of cis-regulatory elements. The method combines predictions of different algorithms: Clover, Cluster-Buster, an own implementation of hu- man/rat/mouse sequence identity and the ITB algorithm (described in chap- ter 2). The procedure utilizes data from the human genome sequence, NCBI gene annotations, the database of verified eukaryotic promoters (EPD), the collection of experimentally proven binding sites (Transfac) and homologies of human, mouse and rat (HomGL/HomoloGene).
Following Kielbasa et al. [2004b], two applications of the tool are dis- cussed. First, as presented in section 3.2, the method is tested on a collection of 18 upstream regions of experimentally verified AP-1 target genes. About a half of the known sites belongs to the high-scoring candidates found by the tool.
Next, the same analysis is applied to genes found to be up- or down- regulated as an effect of RAS transformation in rat fibroblasts (section 3.3).
A detailed literature and computational search for promoter regions of these genes has been performed. Indications of overrepresented matches to the motifs recognized by Elk-1 and AP-1 transcription factors are found via a comparison with shuffled promoter sequences. In some promoters consistent predictions of clustered binding sites were obtained.
23
3.1 Introduction
Growing databases of mRNA expression profiles increase the need for bio- computational methods to predict regulatory rules in sets of co-regulated genes. A typical analysis of a large scale microarray experiment results in clusters of genes sharing similar expression profiles as functions of different experimental conditions or time points [Herzel et al., 2001]. Emergence of such patterns might be a hint suggesting existence of regulatory mechanisms controlling genes within each of the clusters.
Yeast Saccharomyces cerevisiae was one of the first organisms, whose genome was studied using the approach mentioned above. Several groups [van Helden et al., 1998, Pilpel et al., 2001, Caselle et al., 2002] predicted or verified short DNA sequences bound by transcription factors in the upstream regions of genes assigned to a common cluster (see Tab. 2.1). Problems arise when these methods are directly applied to higher eukaryotic organisms. The number of incorrectly predicted binding sites grows with the total length of DNA sequences in which the search is performed. This observation empha- sizes the role of careful preselection of short promoter regions (instead of full upstream sequences in yeast) for further search.
Furthermore, one cannot ignore local properties of the DNA sequences selected. Noticeable changes of GC content (CpG islands versus CpG sup- pression) or poly–A sequences, known to occur frequently close to transcrip- tion start sites, may dominate the scoring procedure and produce unexpected results.
Certainly, to increase prediction quality all potential sources of informa- tion should be combined. Here a method is presented, which in the analysed set of co-regulated promoters associates sites matching known profiles recog- nized by transcription factors with statistically overrepresented motifs. Ad- ditionally, since it is probable that the regulatory mechanisms are preserved in the course of evolution [Wasserman et al., 2000, Dieterich et al., 2002], the results are presented in the context of promoter homologues between human, rat and mouse.
Last but not least, the presented schema of the regulatory motifs detection requires compilation of information stored in several databases: Ensembl for human, mouse and rat [Birney et al., 2004], RefSeq [Pruitt et al., 2005], EPD [Perier et al., 1998], DBTSS [Suzuki et al., 2002], Homologene, Unigene [Wheeler et al., 2003], Transfac [Wingender et al., 2000, Matys et al., 2003].
Even though the task seems to be well defined, the practical implementation is difficult due to different standards for expressing gene names and base positions within genomic sequences. In order to overcome these technical issues, a dedicated database HomGL has been developed by Blüthgen et al.
25 [2004], which provides a direct access to homologues and their upstream regions, as well as it handles a variety of gene accession identifiers.
3.2 Study of AP-1 regulated genes
In order to elucidate properties of the prediction algorithms an artificial collection of genes was constructed. The tablegenesof the Transfac database was scanned for genes regulated by the AP-1 transcription factor. Only human genes were selected, based on the HS$ pattern present in the gene identifier. Next, these genes were identified using the human Ensembl service and the corresponding DNA sequences were extracted. Additionally, with the help of the HomGL database the human genes were mapped and their mouse and rat homologues were located. Fragments from 1500 bp upstream to 200 bp downstream around transcription start site (as provided by Ensembl) were used.
The table sitesof the Transfac database was processed to find the short DNA sequences representing the binding sites experimentally proven to be recognized by the AP-1 transcription factor. In 18 cases it was possible to match exactly the substring representing the factor binding site within the extracted human DNA sequences. It should be noted, that there were no data available stating whether an extracted site was a unique AP-1 site per gene or the one with the highest affinity.
The final piece of information taken from the Transfac database came from the matrix table. Since more than one positional frequency matrix was provided for the AP-1 transcription factor, the one was chosen which corresponded to the largest number of sequences aligned (a matrix identifier M00174, an alignment of 56 observations). This single matrix was used for prediction of binding sites.
Using this data set, results of the following algorithms were studied:
• the Clover program [Frith et al., 2004a] calculating a similarity scores between a weight matrix and DNA sequences belonging to a family (several advanced background models might be taken into account);
• the Cluster-Buster program [Frith et al., 2003] detecting multiple close occurrences (clusters) of binding sites predicted based on weight ma- trices from a provided set;
• an own implementation of a percent identity [Schwartz et al., 2000]
procedure reporting percent of similarity between homologous DNA sequences;
Gene Clover Cluster-Buster %-identity
Hs.511899 1 + h
Hs.1832 1 + h
Hs.435800 1 + m
Hs.25647 1 − 0
Hs.694 1 − 0
Hs.89679 3 − 0
Hs.418083 4 0 0
Hs.1349 4 − 0
Hs.202453 5 − l
Hs.253495 6 0 m
Hs.856 6 − 0
Hs.408312 7 − h
Hs.78465 7 − m
Hs.385521 10 − l
Hs.446641 >10 0 0
Hs.1905 >10 − m
Hs.83169 >10 − h
Hs.375129 − 0 h/m
Table 3.1: Predictions of AP-1 binding in gene upstream sequences experi- mentally proven to contain AP-1 binding sites. Clover: rank at which the known site was predicted ("−" stands for no prediction at all). Cluster- Buster: "+" the known site within a predicted cluster; "−" the known site outside a predicted cluster; "0" no cluster was predicted. %-identity: "h" – high identity at the experimental site, "m" – average, "l" – low, "0" – no data available.
• the ITB algorithm (discussed in chapter 2, Kielbasa et al. [2001]) cal- culating overrepresentation of short DNA words (5,6 or 7 nucleotides) in a family of DNA sequences in comparison to a training (background) set of DNA sequences.
The Clover program was requested to perform calculations with all three background methods it provides (mononucleotide DNA sequence shuffling, dinucleotide shuffling, and shuffling of the positions of the weight matrix).
The score thresholds were lowered (min. motif score 3.0, max. P-value 0.15), since with the default values majority of the experimentally known sites were not found. A similar approach was used with the Cluster-Buster program – the motif score threshold was reduced to 3.0 and the cluster score threshold to 2.5. The ITB algorithm was run with the shuffled AP-1 sequences as the
27
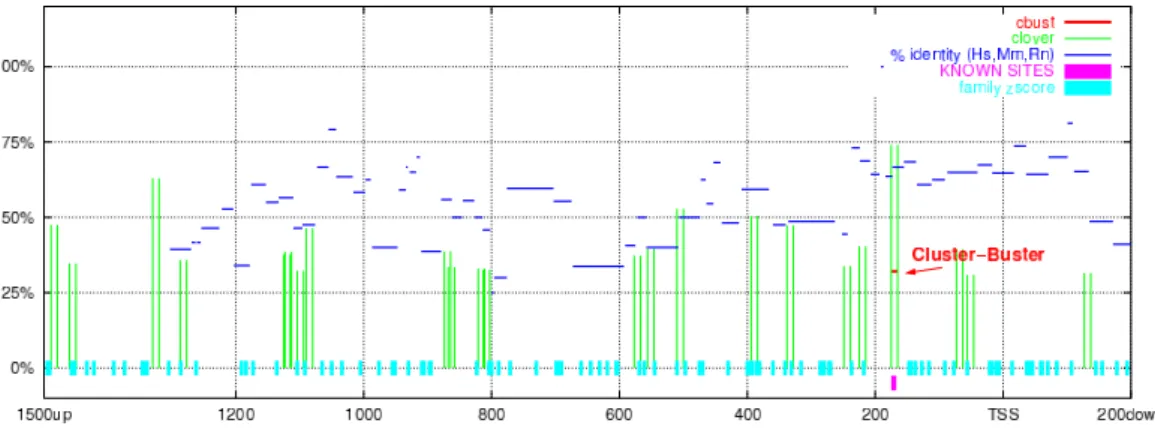
Figure 3.1: Predictions of AP-1 binding sites in upstream sequence of gene Hs.511899 (EDN1, endothelin 1). The single bar at the bottom of the picture shows the position of an experimentally proven AP-1 binding site. Clover:
predictions are shown with thin vertical lines (height is proportional to sim- ilarity score). Cluster-Buster: the single prediction is marked by the arrow.
The broken horizontal lines represent ungapped stretches of the sequence sim- ilar to rat and mouse (similarity scale provided on the vertical axis). ITB:
the bars on the horizontal axis mark locations of the mostly overrepresented 6-mers.
background set and for motif lengths 5, 6 and 7. No significant overrepresen- tation of DNA words was detected by the ITB algorithm. A detailed analysis of the AP-1 sites revealed that there was no significant excess of 5-mers due to the considerable variety of the sites.
The results of the mentioned programs as well as experimentally known sites were summarized together on graphs like in Fig. 3.1, describing each DNA sequence of the AP-1 collection separately. The summary for all 18 sequences is given in the Tab. 3.1. Even in this artificial set with enriched AP-1 sites and with a single weight matrix, only a half of the sites were detected by Clover (assuming a practical limit of top five candidate sites).
The top-ranked Clover motifs belong to groups reported by the Cluster- Buster program, i.e. such clusters may be used as an additional indicator of true sites. The human, mouse, rat percent identity signals tend to have values higher than average at the experimentally known sites, and can be used also as an additional indication of true sites.
3.3 Study of the RAS-dependent genes
In order to find candidate genes involved in tumor development two cell lines have been studied by Zuber et al. [2000]: preneoplastic rat 208F fibroblasts and its malignant HRAS-transformed derivative FE-8. Subtractive suppres- sion hybridization [Diatchenko et al., 1996] technique was used to find gene fragments up-regulated or down-regulated upon neoplastic transformation.
Out of more than 1200 subtracted cDNA clones 244 have been recognized by the authors as already known genes.
For the purposes of this chapter, first human homologues of these genes were identified. Based on the human Unigene set and alignments performed with the Blast algorithm [Altschul et al., 1997] 216 human homologues were found. Afterward, based on the human genome assembly provided by En- sembl, upstream regions of the homologues were extracted using the HomGL system. DNA fragments from 1500 bp upstream to 200 bp downstream around the transcription start site (as reported by Ensembl) were selected for further analysis.
Several available promoter prediction programs: First Exon Finder [Davu- luri et al., 2001], McPromoter [Ohler et al., 2001] and CONPRO [Liu and States, 2002] were applied to these sequences. Additionally, literature and database (Eukaryotic Promoter Database by Perier et al. [1998], NCBI data- bases) search for experimentally identified promoters of the genes was per- formed. After these steps the analysis was limited to the genes for which at least two of the programs predicted transcription start sites (TSS) not fur- ther than 300 bp from each other. Finally, promoters of 30 RAS suppressed genes and 20 RAS activated genes were selected.
The Transfac database (version 6.0, Wingender et al. [2000]) provided a collection of more than 300 (partially redundant) profiles recognized by ver- tebrate transcription factors. In contrast to the study of the genes regulated by the AP-1 transcription factor where only a single profile was studied (sec- tion 3.2), here all the profiles provided by the library should be separately analysed. Unfortunately, when searching for binding sites the amount of false predictions grows proportionally to the number of the profiles studied.
Therefore, only the profiles mentioned in the literature in the context of RAS regulation were chosen for further analysis. In total 52 weight matrices were selected. Naturally, such a selection of profiles is biased towards the knowledge of the user performing the literature search. An unbiased method which compares the statistical properties of the profiles in order to select nonredundant subset of them is discussed in chapter 4.
The same prediction algorithms as used in the AP-1 study were applied to the RAS suppressed and the RAS activated sets of promoter sequences


![Figure 2.3: A sequence logo [Schneider and Stephens, 1990] of the significant pattern CGARCG found in promoters of human genes regulated via H-Ras.](https://thumb-eu.123doks.com/thumbv2/1library_info/5644012.1693545/27.892.263.565.762.845/figure-sequence-schneider-stephens-significant-pattern-promoters-regulated.webp)