1. INTRODUCTION
The Antarctic benthos has been studied for over a century (e.g. Spry 1877). In the Weddell Sea, quanti- tative studies have focused more on the northwestern and eastern shelf areas (e.g. Gerdes et al. 2003, Sañé et al. 2012, Gutt et al. 2013). In contrast, the pack-ice- covered southern Weddell Sea is difficult to access and remains poorly studied (e.g. Voß 1988, Gerdes et al. 1992, Gutt & Starmans 1998). The present study attempts to reduce this gap by providing benthic com- munity data from an area of ~476 000 km2, covering the Filchner Trough and the adjacent continental shelf at the southern margin of the Weddell Sea (see Fig. 1).
The study area hereinafter referred to as the Filch- ner Region is characterized by heterogeneous topog- raphy, hydrography, and sea-ice conditions. The con- tinental shelf in front of the Filchner Ice Shelf is incised by the Filchner Trough with water depths
>1000 m (Arndt et al. 2013). The Filchner Trough is considered the main conduit for Ice Shelf Water (ISW) from underneath the Filchner-Rønne Ice Shelf to- wards the continental slope where it mixes with open ocean waters forming the deep and bottom waters of the Weddell Sea (Schröder 2016), making the Filchner Region key for the formation of Antarctic bottom water and the regulation of global water mass circulation (Gammelsrod et al. 1994, Foldvik et al.
2004, Ryan et al. 2017). Some key drivers of benthic
© The authors 2019. Open Access under Creative Commons by Attribution Licence. Use, distribution and reproduction are un - restricted. Authors and original publication must be credited.
Publisher: Inter-Research · www.int-res.com
*Corresponding author: santiago.pineda.metz@gmail.com
Benthic communities of the Filchner Region (Weddell Sea, Antarctica)
Santiago E. A. Pineda-Metz
1, 2,*, Enrique Isla
3, Dieter Gerdes
11Alfred-Wegener-Institut Helmholtz-Zentrum für Polar- und Meeresforschung, 27568 Bremerhaven, Germany
2Fachbereich 2 Biologie/Chemie, Universität Bremen, 28334 Bremen, Germany
3Institut de Ciències del Mar − CSIC, 08003 Barcelona, Spain
ABSTRACT: Due to extreme pack ice, the Filchner Region in the southern Weddell Sea is one of the least studied regions on the planet. Here, we provide a detailed description of the benthic communities of this high-Antarctic ecosystem, and assess the relationship between environmental factors and benthic distribution patterns. Fieldwork was performed in the austral summers of 2013− 14 and 2015−16 during the R/V ‘Polarstern’ cruises PS82 and PS96. Using a combination of multibox corer (MBC) and seabed image data from 37 stations (water depths 243−1217 m), we dif- ferentiated 6 station groups. While 1 of these groups was comprised of a single station, the other 5 groups represented distinct benthic communities. Three of these correspond to the previously described Eastern Shelf, Southern Shelf, and Southern Trench communities. However, we found distribution shifts and MBC abundance and biomass reductions when comparing our results with earlier studies. The other 2 groups have novel characteristics and are presented here as an Ice/Ice Shelf Water-related community and a Continental slope community. Water depth in combination with 2 or 3 other environmental variables (out of 7 available) explained < 30% of the benthic dis- tribution and composition. We found a tighter relationship between water mass circulation and spatial distribution of the communities; we suggest using water-mass-related characteristics (e.g.
productivity regimes, water currents) to better explain benthic spatial distribution patterns.
KEY WORDS: Southern Ocean · Infaunal benthos · Epifaunal benthos · Mega- and macrofauna · Zoobenthic distribution patterns · Sediment cores · Seabed images · Environment-benthic relationships
O
PENPENA
CCESSCCESSdistribution and composition, such as primary pro- ductivity, particle flux, and current regimes (Pineda- Metz in press), are characteristics which can be re - garded as water-mass-specific (e.g. Barry 1988, Barry
& Dayton 1988). Thus, we could expect the hetero - geneous water mass circulation, in combination with e.g. the increased depth range in the Filchner Region, to cause benthos to be equally hetero geneous.
Another conspicuous characteristic of the Filchner Region is the presence of the grounded iceberg A23- A. Iceberg A23-A is located on the Berkner Bank on the western shelf of the Filchner Region. The iceberg separated from the Filchner Ice Shelf in April 1986 and changed the circulation of High Salinity Shelf Water (HSSW) in the Filchner Region (Grosfeld et al.
2001). Previous to the calving of iceberg A23-A, HSSW flowed directly from the Berkner Bank into the Filchner Trough; after this event, HSSW started to flow southwards to the Rønne Ice Shelf before entering the Filchner Trough as ISW (Grosfeld et al.
2001, Ryan et al. 2017).
The Filchner Region is characterized by 2 main sea- ice regimes (see Fig. 2). On the shelf east of the Filch- ner Trough and in front of the Rønne Ice Shelf, sea-ice cover is seasonal, i.e. during summer, open water conditions prevail, and during winter, the sea surface is sea-ice-covered. In contrast, over the Filchner Trough and the continental shelf west of it, heavy year-round sea-ice cover dominates, as reported from previous campaigns to the Filchner Region (Knust &
Schröder 2014, Schröder 2016). Sea ice not only di- rectly regulates primary production (Arrigo et al.
2015) but also the particle flux from the euphotic zone to the benthic realm (Isla 2016, Pineda-Metz in press), especially in the marginal sea-ice zones, where pri- mary and secondary planktonic production are en- hanced and higher than in open water areas (e.g.
Bathmann et al. 1991, Isla et al. 2009, Isla 2016). Due to the opening of a polynya during summer, productiv- ity on the eastern shelf of the Filchner Region should be considerably higher than productivity at the heavy year-round sea-ice-covered Filchner Trough and the continental shelf west of it. Based on these productivity differences, benthic abundance and biomass should be higher in high-productivity regions compared to those with lower productivity. The composition of in- faunal and epifaunal communities should also reflect such local productivity re gimes. However, advection of primary-produced carbon to areas adjacent to polynyas here could support benthic communities similar to those within the polynyas with high benthic abundance and biomass (e.g. Greb meier & Cooper 1995, Smith et al. 2006, Jansen et al. 2018).
Changes in sea-ice cover and volume directly affect water mass characteristics and planktonic pro- ductivity, thus affecting benthos. During recent de - cades, sea-ice cover in the eastern Weddell Sea, including a large part of our study area in the Filch- ner Region, has increased (see our Fig. 2; Turner et al. 2016, S.E.A.P.M. & D.G. unpubl. data), in response to a de crease in surface water temperatures and a stronger positive Southern Annular Mode (Liu et al.
2004, Turner et al. 2016, Comiso et al. 2017). Thus, distinct differences in spatial and temporal scales of sea ice and productivity regimes should be ex pected on the eastern shelf of the Filchner Region, in the Filchner Trough, and on the shelf west of the trough.
The first description of the benthic fauna in this region was published in the late 1980s (Voß 1988). It differentiated among 3 community types: (1) a highly abundant and diverse Eastern Shelf community dom- inated by suspension feeders, especially sponges; (2) a Southern Shelf community, less diverse and abun- dant than the Eastern Shelf community, dominated by bryozoans; and (3) a Southern Trench community, with low diversity, high abundances, and a clear dominance of holothurians. This description was, however, exclusively based on trawl catches. Later campaigns on the eastern shelf collected quantitative data on benthic assemblages by means of a multibox corer (MBC; Gerdes et al. 1992) and seabed images (SBIs; Gutt & Starmans 1998). Based on benthic abun- dance and biomass data, these studies reported as - semblages that resembled the Eastern Shelf and Southern Trench communities sensu Voß (1988).
These descriptions encompassed either only infau - nal (based on MBC data) or only epifaunal benthos (based on SBI data), while an approach combining both benthic faunal compartments and in addition, integrating the whole study area, is still missing.
A recent study in the Filchner Trough and its ad - jacent shelves, based on MBC and SBI samples, con- cluded that both methods should be used in combina- tion whenever possible to allow a more comprehensive representation of the benthic fauna, including both infaunal and epifaunal benthos (Pineda-Metz &
Gerdes 2018). Due to a focus on the methodological approach, this recent description of the benthic fauna lacked the detail of previous studies. Here, we attempted to provide a detailed description of the benthic communities in the Filchner Region along with their distribution by using a comprehensive methodological approach which considers both in - faunal and epifaunal benthos. In a further step, we related the ob served benthic distribution with envi- ronmental factors which have already been affected
by climate change and which are predicted to change in the future. These include e.g. near-seabed water temperature and salinity, and sea-ice cover (Timmermann & Hellmer 2013, Turner et al. 2016, Hellmer et al. 2017), but also other factors which are considered to be important for the benthos, e.g. sedi- ment organic carbon (OC) content as food source, and e.g. water depth and sediment grain size (Cum- mings et al. 2010) as regulators for benthic distribu- tion. Based on this approach, we aimed to
observe how the different environmental parameters drive the structure, composi- tion, and distribution of the benthic com- munities of the Filchner Region.
2. MATERIALS AND METHODS Fieldwork was performed in the austral summers of 2013−14 and 2015−16 during the R/V ‘Polarstern’ (AWI 2017) cruises PS82 (ANT-XXIX/9; Knust & Schröder 2014) and PS96 (ANT-XXXI/2; Schröder 2016). At 37 stations with water depths ranging from 243 to 1217 m, the benthos fauna was investigated by means of MBC (Gerdes 1990) and SBI (Table S1 in the Supplement at www. int-res. com/ articles/
suppl/ m628 p037_ supp. pdf; Fig. 1).
A 10 cm diameter multicorer (MUC) was deployed at 22 stations (Table S1) to obtain data on sediment grain size, OC, and bio- genic silica (bSi). The upper 9 cm of the sediment cores were subsampled on board and frozen at −20 °C in darkness until fur- ther treatment in the laboratory. Sediment grain size was measured with laser diffrac- tion in a Horiba Partica LA950V2 laser scattering particle-size distribution ana- lyzer after removal of organic matter in a 20% hydrogen peroxide solution. The fine sediment fraction, expressed in weight %, is equal to the combined proportion of silt- and clay-sized material, while the coarse fraction represents the combination of the sand and gravel fractions. OC was meas- ured in a LECO Truspec CN analyzer, and expressed as weight %. bSi was calculated following sequential alkaline extractions with Na2CO3(DeMaster 1981, Mortlock &
Froelich 1989, DeMaster 1991) to distin- guish the biogenic and lithogenic silica fractions, both also ex pressed as weight %.
The OC and bSi inventories for the upper 9 cm of the sediment column were calculated as the product of their concen trations, dry bulk density (mg cm−3), and the height of the subsample sediment layer, and expressed as mg cm−2. Based on the homogeneous
210Pb activity in Antarctic sediment cores, we consid- ered that the upper 5−9 cm is the section of the sedi- ment column most susceptible to be reworked by benthic organisms (e.g. Isla et al. 2004, Isla 2016, E. I.
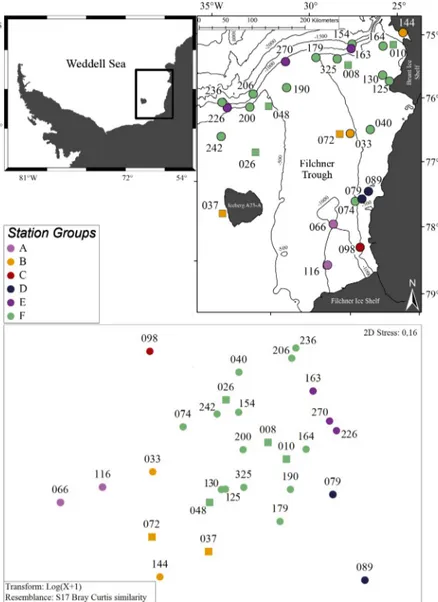
Fig. 1. Stations (numbered; see Table S1 in the Supplement) where multi- box corer (MBC) and seabed images (SBI) data were collected in the Filch- ner Region (Southern Weddell Sea; upper-left inset) during R/V ‘Polarstern’
cruises PS82 (circles) and PS96 (squares). Bathymetric data from IBCSO chart (Arndt et al. 2013). Lower graph: 2-dimensional MDS plot visualizing the among-station resemblance pattern of the benthic fauna identified in MBC and SBI samples collected during the cruises. The pattern is based on between-station Bray-Curtis similarities calculated from MBC biomass and SBI abundance data. Grouping obtained from Cluster and SIMPROF analy- ses and its distribution in the Filchner Region is shown (colors correspond to color key for station groups; numbers are Stn identification numbers)
unpubl. data). Furthermore, we found a high correla- tion between OC and bSi inventories of the upper 1 cm and those of the upper 5− 9 cm. Thus, only the inventories of the upper 9 cm of the sediment column were considered. Additional to MUC grain size data (especially from areas where this gear could not be deployed), areal cover (%) of fine sediments, gravel, and rocks/ stones were estimated at each SBI station (Table S2 in the Supplement).
To assess the effect of sea ice on benthic distribu- tion and composition, we first collected monthly sea- ice cover data from the Sea Ice Index provided by the National Snow and Ice Data Center (NSIDC) for the period 1979−2017 (Fetterer et al. 2018). Monthly data were used to calculate summer and yearly sea-ice cover averages, and the temporal trends of sea-ice cover per year and per summer. These temporal trends were calculated as the slope of the linear function of sea-ice cover over time for the period 1979−2017.
Additional to MUC samples and sea-ice cover, a CTD (Seabird SBE-911 plus) was deployed at 201 sta- tions to obtain oceanographic data on water column parameters (Schröder & Wisotzki 2014, Schrö der et al. 2016). From these data, we extracted near-seabed water temperature, salinity, density, and dis solved oxygen to use in the correlation analyses.
While sea-ice data were already in raster format, CTD and sediment data were first imported to the GIS environment and interpolated for the study area with the Kriging method of ArcMap 10 (ESRI). The
‘extract multi values to points’ toolbox of ArcMap was used to extract environmental data from each raster derived from CTD, MUC, and sea-ice cover at all stations where both SBI and MBC benthic data were obtained (Tables S1 & S2). The extracted envi- ronmental data were used to assemble an environ- mental data matrix consisting of 20 environmental variables. To avoid co-correlation when conducting a BEST test (see later in this section), the environmen- tal variables were correlated with each other. We then selected against environmental variables with significant correlations. The final environmental matrix consisted of 7 of the 20 environmental vari- ables (Table S3 in the Supplement).
Sediment cores for benthic analyses were sieved on deck over a 500 µm mesh. Material retained on the sieves was fixed in a 5% seawater-formaldehyde solution buffered with borax. In the laboratory, ben- thic organisms were sorted, identified to the lowest identifiable taxonomic level (ITL) via a stereomicro- scope, and classified into taxonomic units (TUs) simi- lar to those used in previous MBC studies, in order to enable a comparison with previous data obtained in
the Filchner Region (Gerdes et al. 1992) and other areas of the Weddell Sea (Gerdes 2014a−h). Al - though the use of larger TUs such as e.g. class or order is not common, other studies have shown little loss of statistical resolution regardless of the low tax- onomic resolution (e.g. Warwick 1988). Abundance (ind. m−2) and wet-weight biomass (g ww m−2) values were calculated for each TU and sample. Abundance of colonial (e.g. bryozoans and hydrozoans) and large benthic organisms (e.g. sponges) was counted as presence only.
MBC abundance and biomass data were 4th-root- transformed and used to calculate between-station Bray-Curtis (Bray & Curtis 1957) similarity matrices.
These MBC matrices were used in a PERMANOVA (Anderson 2001) to test for differences with older comparable MBC benthic abundance and biomass data from the Filchner Region (Gerdes et al. 1992) and other regions of the Weddell Sea (Gerdes 2014a−h).
These multivariate statistics were performed by means of the software package PRIMERv6 with its PERM- ANOVA+ add on (Clarke & Gorley 2006, Anderson et al. 2008).
A RELATE test between MBC abundance and bio- mass data showed benthic distribution patterns de - rived from abundance and biomass to be signifi- cantly correlated (Spearman rank correlation, rho = 0.893; p < 0.001). Based on this result, we only used MBC biomass values in combination with SBI abun- dance values for the subsequent statistical analysis.
All TUs from this benthic matrix were classified into 4 feeding guilds: deposit feeders, suspension feeders, scavengers, and predators (Table S4 in the Supple- ment). The classification of taxonomic groups into feeding guilds followed the recommendations in Yonge (1928), Hansen (1978), Fauchald & Jumars (1979), Montiel et al. (2005), and Macdonald et al.
(2010). In cases where different feeding types oc - curred parallel in 1 taxonomic group, the percentage of contribution of the respective guild was estimated following the detailed classification scheme pre- sented by Macdonald et al. (2010).
During cruise PS82, SBIs were taken every 15 s during a 15 min drift phase with a camera (Canon EOS D100) installed in an underwater housing at - tached to the MBC, resulting in an average of 55 images per station. Before treating SBIs for analyses, all images out of focus or blurred by suspended par- ticles were discarded, resulting in an average of 35 usable images per station (for more details on SBI sampling and treatment previous to the analyses, see Pineda-Metz & Gerdes 2018). At 4 stations (Stns 033, 040, 052, and 206), all SBIs were analyzed to calcu-
late the number of images per station sufficient to identify ≥75% of all TUs differentiated. These curves were extrapolated to 35 images whenever necessary to reach the mean number of SBIs per station. All taxon accumulation curves were calculated using the EstimateS software (Colwell 2013). The taxon accu- mulation curves at these 4 stations clearly indicated that the analysis of 15 images was sufficient for this purpose (Fig. S1 in the Supplement). For this reason, at all other stations, a subset of 15 randomly selected SBIs was used to describe epifaunal benthos. During cruise PS96, SBIs were obtained by means of the Ocean Floor Observation System (OFOS; for details of the gear, see Piepenburg et al. 2017). From each OFOS transect, 50 SBIs taken on the closest position to the corresponding MBC station were selected, and a subset of 15 randomly selected SBIs was analyzed and used to calculate the taxon cumulative curve, as described above (earlier in this paragraph) for the SBIs obtained with the underwater camera attached to the MBC. All images obtained by means of the OFOS can be found in the PANGAEA virtual data- base (Piepenburg 2016).
In the laboratory, all organisms visible in the images were counted, and identified to the lowest ITL, to TUs similar to those defined for MBC samples.
Whenever possible, TUs lower than those defined for the MBC were used. Organism counts were stan- dardized to abundance (ind. m−2). The abundance of colonial organisms (e.g. bryozoans, gorgonians, and hydrozoans) was calculated as the area covered by the colonies (m2).
Previous to multivariate analysis and to eliminate the influence of different units in the benthic data matrix (i.e. ind. m−2, m2, and g ww m−2), all data were first pre-treated to conform a benthic data matrix of the SBI abundance ratios and MBC biomass ratios of each TU at every station. Ratios were calculated by dividing TU abundance/biomass values at each sta- tion by the corresponding total abundance/biomass value of the station (Text S1 in the Supplement).
Multivariate statistics were applied by means of the software package PRIMERv6 with PERM- ANOVA+ (Clarke & Gorley 2006, Anderson et al.
2008). Prior to analysis, benthic data were log(x+1)- transformed. Between-station similarities were cal- culated using the Bray-Curtis index (Bray & Curtis 1957). The benthic data matrix was used in a Clus- ter and SIMPROF analysis (Clarke & Gorley 2006) to differentiate and define station groups, and the re semblance pattern was visualized using 2-d multi - dimensional scaling (MDS) plots. Additionally, 1- way PERMANOVA (Anderson 2001) and SIMPER
analyses (Clarke & Warwick 1994) were performed to test for significant differences among and be - tween station groups, to establish the mean dissim- ilarity be tween groups, and to determine which TUs mainly contributed to these between-group differences.
Additional to these tests, the similarity matrix de - rived from the benthic data matrix was used in a BEST analysis (Clarke & Gorley 2006) to test for cor- relations with the environmental data matrix, and thus the influence of environmental variables over benthic distribution patterns. This exploratory test was followed by a BEST analysis with 999 permuta- tions to test for significant correlations.
3. RESULTS
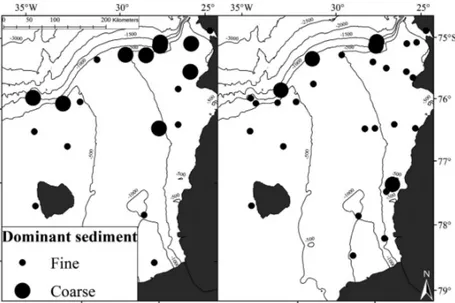
Fine (clay and silt) and coarse (sand and gravel) sediments were unevenly distributed among stations in the Filchner Region (Table S1). Shelf and trough stations were characterized by high (> 50%) propor- tions of fine sediments, whereas coarse sediments prevailed (> 50%) at slope stations (Fig. 3, Table S1).
In the SBIs, > 50% of the seabed of most stations was covered by fine sediments (Fig. 3, Table S1). OC in - ventories varied from 8.0 to 70.4 mg cm−2, with higher OC concentrations along the northern slope of the Filchner Region and lower concentrations on some parts of the eastern and western shelves of the region (Fig. 4). The bSi inventories ranged from 50.7 to 560.6 mg cm−2; lower bSi concentrations were found at the western shelf stations, while higher val- ues were observed in the deep trough and along the eastern shelf (Fig. 4).
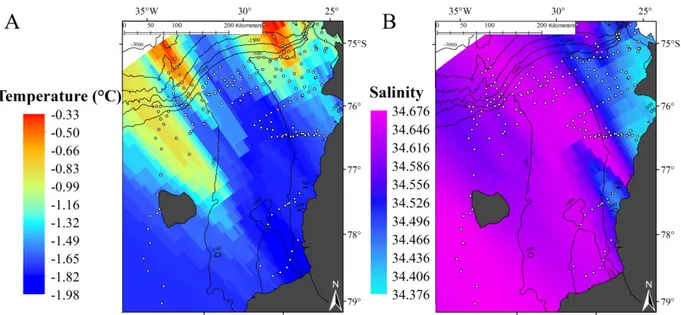
Near-seabed water temperatures in the Filchner Region varied between −1.98 and −0.33°C (Fig. 5;
Table S2). Lower temperatures were recorded in the southern Filchner Trough and at the southernmost stations on the eastern and western shelves, while higher temperatures were recorded on the northern slope of the Filchner Region (Fig. 5). Stations within the Filchner Trough were characterized by the high- est salinity values (Fig. 5).
The highest average summer and yearly sea-ice cover occurred over the Filchner Trough (Fig. 2A,B).
The sea-ice cover temporal trend over the years 1979− 2017 showed similar patterns for summer and yearly averages, with gain of sea-ice cover especially in the trough area and loss of cover in the direct vicinity west of the A23-A iceberg and on the eastern shelf close to the shelf ice edge (Fig. 2C,D). Average loss of sea-ice cover on the eastern shelf was greater
in summer (−0.19% yr−1) than over the year (slightly less than 0% yr−1; Fig. 2C,D), whereas west of the A23-A iceberg, the average loss in summer (−0.19%
yr−1) was smaller than over the year (−0.4% yr−1; Fig. 2C,D).
Thirty-five TUs were distinguished in the MBC samples at the Filchner Region stations (Table S5 in the Supplement). The number of TUs at MBC sta- tions ranged from 3 (Stn 066) to 26 (Stns 163 and 164);
only at 6 MBC stations <10 TUs were found. In the SBI analysis, a total of 31 TUs were distinguished.
The number of TUs per SBI station ranged from 6 (Stn 144) to 23 (Stns 164, 179, and 190); in all but 1 station, >10 TUs were identified. Combining MBC
and SBI data, a total of 46 benthic TUs were distin- guished (Table S5). Fifteen TUs were exclusively found in MBC samples (unidentified anthozoans, sipun cu lids, flatworms, nemer teans, priapulids, apla - co phorans, sca pho pods, clitellate worms, echiurids, acari, cuma ceans, har pac ti coid copepods, cirri peds, tanaids, and ostracods), and 11 TUs were ex clusively found in SBIs (unidentified medusae, stauro medu - sae, gorgonians, pennatulaceans, actina rians, scler- ac tinians, nudibranchs, cepha lo pods, mysids, sero - lids, and deca pods).
The mean total benthic abundances at the 31 MBC stations ranged from 104 to 4627 ind. m−2, with an overall mean of 1526 ind. m−2and an overall Fig. 2. (A) Yearly and (B) summer average sea-ice cover, and average (C) yearly and (D) summer sea-ice cover gain/loss for the period 1979−2017 in the study area in the Filchner Region. Note that each plot has its own color scale. Black: cells with no
values. Modified after Fetterer et al. (2018)
median of 1270 ind. m−2. Dominant TUs, which to - gether con tri buted > 75% to overall mean abun- dance, were poly chaetes, bivalves, ophiuroids, cli tel - late worms, and amphipods (Table 1). Deposit feeders were the most abundant feeding guild, with an over- all mean of 672 ind. m−2 (range: 44−2229 ind. m−2), followed by predators (460 ind. m−2; range: 20−
1532 ind. m−2), suspension feeders (344 ind. m−2; range: 20−1090 ind. m−2), and scavengers (34 ind. m−2; range: 1−117 ind. m−2).
The mean benthic biomass ranged from 1.31 to 335.47 g ww m−2, with an overall mean of 51.08 g ww m−2and an overall median of 23.85 g ww m−2. Fol- lowing the criteria given for MBC abundance data, bryo zoans, sponges, polychaetes, ophiuroids, and tunicates were identified as the dominant TUs (Table 1). Suspension feeders contri - buted most to biomass, with an overall mean of 33.04 g ww m−2(range: 0.38−
321.49 g ww m−2), followed by deposit feeders (10.81 g ww m−2; range: 0.47−
56.06 g ww m−2), predators (6.89 g ww m−2; range: 0.23−37.07 g ww m−2), and scavengers (0.34 g ww m−2; range:
0.01−2.20 g ww m−2).
Before combining MBC and SBI data (see Section 2), we considered only benthic data obtained from the MBC samples in our Filchner Region study (present study) and compared it with the MBC data ob tained at the Tip of the Antarc- tic Peninsula (TAP), the Larsen embayments (LA), and the South-Eastern Weddell Sea Shelf (SEWSS;
cf. Gerdes 2014a−h). Benthic abundance and bio- mass, as well as faunal community composition, dif- fered significantly among regions (PERMANOVA, pseudo-F = 5.549; p < 0.001) and between regions (pairwise PERMANOVA, p-values < 0.05; Table S6 in the Supplement). In terms of abundance, the domi- nant taxa were polychaetes, bivalves, amphipods, Fig. 3. Dominant sediment (proportion > 50%) in the sediment column calcu-
lated from multicorer stations (left), and at the seabed surface (derived from seabed images) for all stations where multibox corer and seabed images data were collected (right) in the Filchner Region during R/V ‘Polar stern’ cruises
PS82 and PS96
Fig. 4. (A) Biogenic silica (bSi) inventory and (B) organic carbon (OC) inventory for all stations where multibox corer and seabed images data were collected in the Filchner Region during R/V ‘Polarstern’ cruises PS82 and PS96. Value breaks based
on the Jenks natural breaks criterion
Fig. 5. (A) Near-seabed temperature and (B) salinity in the Filchner Region during R/V ‘Polarstern’ cruises PS82 and PS96.
Modified from Schröder & Wisotzki (2014) and Schröder et al. (2016). White dots: CTD cast locations
TUs SBI (n = 35) MBC (n = 31)
Mean abundance Domi- Freq. Mean abundance Mean biomass Dominance (%) Freq.
(ind m–2) nance (%) occ. (%) (ind m–2) (g ww m–2) Abundance Biomass occ. (%)
Porifera 3 ± 7 3.3 ± 4.9 80 1a 11.3 ± 23.4 0.1 15.2 ± 23.2 71 (0–38) (0–25.8) (0–87.7) (0–0.3) (0–81.1) Bryozoa 0.045 ± 0.111 22.2 ± 25.3 83 1a 13.6 ± 56.8 < 0.1 7.3 ± 18.7 55 (0–0.569)b (0–98.3)c (0–315.4) (0–0.3) (0–94.0) Bivalvia <1 ± <1 0.3 ± 1.4 17 101 ± 131 0.5 ± 0.5 7.6 ± 8.2 3.8 ± 7.4 97
(0–5) (0–8.5) (0–542) (0–1.9) (0–40.4) (0–31.7) Polychaeta 11 ± 18 15.6 ± 15.5 100 763 ± 580 11.3 ± 18.6 55.3 ± 13.2 38.2 ± 28.2 100 (<1–95) (0.5–65.2) (57–2181) (0.4–101.9) (33.3–82.7) (2.0–92.3) Clitellata – – – 143 ± 296 0.2 ± 0.5 6.0 ± 7.8 0.5 ± 1.0 74 (0–1292) (0–2.1) (0–29.4) (0–4.6) Amphipoda <1 ± <1 0.5 ± 0.7 74 108 ± 151 0.4 ± 0.5 5.8 ± 5.2 1.3 ± 2.2 84
(0–3) (0–4.8) (0–750) (0–1.9) (0–20.6) (0–10.4) Holothuroidea 8 ± 29 9.7 ± 23.0 97 9 ± 16 1.3 ± 3.3 0.5 ± 0.8 3.0 ± 7.2 48
(0–166) (0–97.4) (0–73) (0–15.3) (0–2.9) (0–31.9) Ophiuroidea 24 ± 24 40.7 ± 27.7 100 100 ± 121 4.8 ± 9.5 7.0 ± 7.0 10.1 ± 14.2 81 (<1–95) (0.2–88.5) (0–573) (0–39.3) (0–28.9) (0–56.4) Tunicata 7 ± 14 10.2 ± 13.7 89 8 ± 15 2.4 ± 7.6 0.8 ± 2.0 3.6 ± 11.6 45
(0–76) (0–57.1) (0–73) (0–38.0) (0–10.8) (0–61.2) Unidentified 3 ± 3 4.7 ± 10.5 97 2 ± 5 < 0.1 ± 0.1 0.2 ± 0.7 0.1 ± 0.5 16
(0–16) (0–47.4) (0–28) (0–0.4) (0–3.9) (0–2.8)
aAbundance recorded as presence/absence (see Section 2)
bAbundance given in m2
cDominance based on organism coverage in SBI
Table 1. Abundances derived from all seabed images (SBIs), abundances and biomass derived from all multibox corer (MBC) samples, and their respective dominance and frequency of occurrence for the dominant taxonomic units (TUs). Data are mean
± SD; parentheses: minimum and maximum; dominance calculated from mean abundance/biomass values; (–) not found in images; Freq.occ.: frequency of occurrence; ww: wet weight
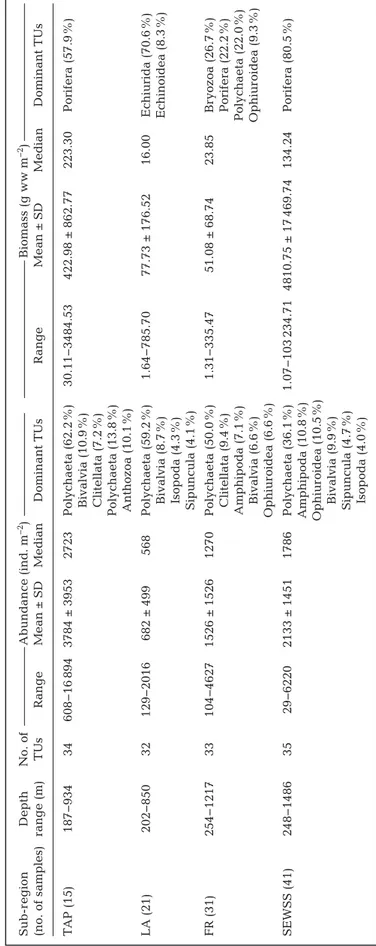
and ophiuroids. Polychaetes contributed the most to abundance in all 4 regions, but their dominance declined from west to east (Table 2). Composition based on biomass data clearly showed that sponges domi- nated in TAP and especially the SEWSS, where they contributed 57.5 and 80.5% to total benthic biomass, respectively; in the Filchner Region, sponges contributed 22.2% of the biomass. In the LA, echiurids dominated (71% of the total biomass) and sponges represented only < 2% of the total benthic biomass (Table 2). Further compar- ison of our MBC data set with previous data from the Filchner Region (Gerdes et al. 1992) also showed significant differ- ences on a temporal scale (PERMANOVA, pseudo-F = 6.289; p < 0.001). The mean abundance (1539 ind. m−2) and biomass (52.76 g ww m−2) resulting from the 2013−
14 and 2015−16 Filchner Region cruises were almost half the values (2758 ind. m−2 and 108.13 g ww m−2) recorded in the late 1980s (Gerdes et al. 1992). In terms of abundance, polychaetes, bivalves, amphi - pods, tanaids, and iso pods were the most abundant in the late 1980s, while sponges contributed most to biomass, followed by holothurians, polychaetes, priapulids, and ascidians.
For the Filchner Region, mean total ben- thic abundance at the 35 SBI stations ranged from 2 to 170 ind. m−2, with an over- all mean of 61 ind. m−2 and an overall median of 55 ind. m−2. Dominant TUs were ophiuroids, polychaetes, holothurians, tuni- cates, and un identified organisms, consti- tuting > 75% of the overall abundance (Table 1). Suspension feeders were the most abundant feeding guild, with an over- all mean of 28 ind. m−2 (range: <1−
124 ind. m−2), followed by deposit feeders (22 ind. m−2; range: 1−106 ind. m−2), preda- tors (10 ind. m−2; range: <1−31 ind. m−2), and scavengers (1 ind. m−2; range: <1−
5 ind, m−2).
Colonial organisms were not recorded at 6 SBI stations, and at the other SBI stations, their coverage ranged from 0 to 0.585 m2, with an overall mean of 0.051 m2 and an overall median of 0.012 m2. Bryozoans were the most abundant colonial TU, with
an overall mean coverage of 0.045 m2 Sub-r
egion Depth No. of Abundance (ind. m−2) Biomass (g ww m−2) (no. of samples) range (m) TUs Range Mean ± SD Median Dominant TUs Range Mean ± SD Median Dominant TUs TAP (15) 187−934 34 608−16894 3784 ± 3953 2723 Polychaeta (62.2%) 30.11−3484.53 422.98 ± 862.77 223.30 Porifera (57.9%) Bivalvia (10.9%) Clitellata (7.2%) Polychaeta (13.8%) Anthozoa (10.1%) LA (21) 202−850 32 129−2016 682 ± 499 568 Polychaeta (59.2%) 1.64−785.70 77.73 ± 176.52 16.00 Echiurida (70.6%) Bivalvia (8.7%) Echinoidea (8.3%) Isopoda (4.3%) Sipuncula (4.1%) FR (31) 254−1217 33 104−4627 1526 ± 1526 1270 Polychaeta (50.0%) 1.31−335.47 51.08 ± 68.74 23.85 Bryozoa (26.7%) Clitellata (9.4%) Porifera (22.2%) Amphipoda (7.1%) Polychaeta (22.0%) Bivalvia (6.6%) Ophiuroidea (9.3%) Ophiuroidea (6.6%) SEWSS (41) 248−1486 35 29−6220 2133 ± 1451 1786 Polychaeta (36.1%) 1.07−103234.71 4810.75 ± 17469.74 134.24 Porifera (80.5%) Amphipoda (10.8%) Ophiuroidea (10.5%) Bivalvia (9.9%) Sipuncula (4.7%) Isopoda (4.0%)
Table 2. Multibox corer (MBC) data of each sub-region of the Weddell Sea: Tip of the Antarctic Peninsula (TAP), Larsen embayments (LA), Filchner Region (FR), and South-Eastern Weddell Sea Shelf (SEWSS). MBC data of TAP, LA, and SEWSS modified after Gerdes (2014a−h). TU: taxonomic unit; ww: wet weight
(range: 0− 0.569 m2), followed by hydrozoans (0.003 m2; range: 0− 0.045 m2), and gorgoni- ans (0.003 m2; range: 0− 0.045 m2).
Based on the matrix constructed by com- bining MBC and SBI data obtained in paral- lel at 29 stations (see Section 2), the Cluster and SIMPROF analyses differentiated 6 sta- tion groups, which we named A to F (Fig. S2 in the Supplement). A summarized descrip- tion of these groups and their composition is given in Table 3, and 1 representative SBI picture of each station group is shown in Fig. 6. The composition in these 6 station groups differed significantly among them (PERMANOVA, pseudo-F= 4.69; p < 0.001).
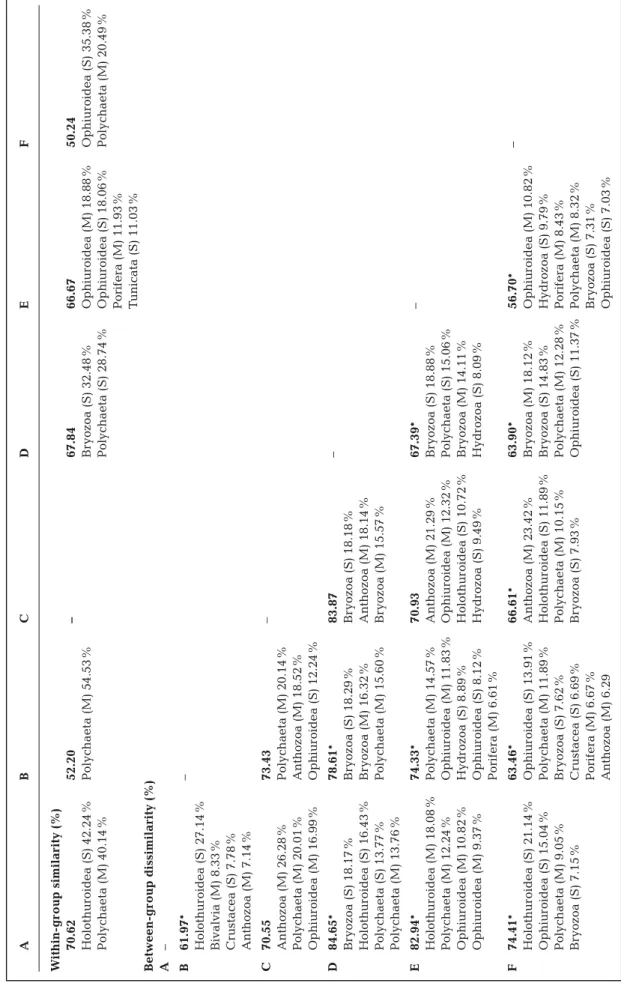
A pairwise PERMANOVA showed almost all groups to be significantly different from each other. Group C as a 1-station group was significantly different only from group F (Table 4). In the SIMPER test, within-group similarities ranged from 50 to 71%, while between-group dissimilarities ranged from 56 to 85%. SBI abundance of holothurians, ophi- uroids, bryo zoans, and polychaete MBC bio- mass contri buted the most to the between- group dissimilarities (Table 4).
Based on the PERMANOVA among- and between-group comparisons, we differenti- ated between the 1-station group C and all other groups. We considered the later groups to represent distinct benthic communities in the Filchner Region. Group A consisted of 2 stations (Stns 066 and 116) located close to each other in the deep southern Filchner Trough (Fig. 1). This group represents a de- posit-feeding epifauna-dominated commu- nity, characterized by a relatively low number of taxa, high epifaunal abundance (though not as high as group D), and low infaunal abundance and biomass. Holothurians con- tributed most to epifaunal abundance, whereas the infauna was dominated by polychaetes.
Group B consisted of 4 stations (Fig. 1), 1 lo- cated on the western shelf near iceberg A23-A (Stn 037), 2 at the eastern slope of the Filchner Trough (Stns 033 and 072), and 1 off the Brunt Ice Shelf (Stn 144). This group represents a mixed community, with suspension- and de- posit-feeding epifauna and a predator/de- posit-feeding- dominated in fauna (Table 3).
Abundance, biomass, and colonial organism cover showed low values. The number of taxa
was intermediate (Table 3), and ophiuroids Station Gr
oup Number of TUsSBI Main TUs Main feeding MBC Main TUs Main feeding (Stations per (SBI/MBC) Abundance Colonial guild(s) Abundance Biomass guild(s) Group) (ind. m–2) coverage (%) (ind. m–2) (g ww m–2) A (2) 21 (14/10) 95 ± 106 0 Holothuroidea Deposit 220 ± 164 2.4 ± 1.55 Polychaeta Deposit (44 %) (21–170) feeders (58 %) (104–341) (1.31–3.50) and suspension feeders (31 %) B (4) 26 (23/19) 11 ± 8 2.7 ± 28.3 Ophiuroidea Deposit (38 %) 373 ± 315 4.6 ± 3.30 Polychaeta Predators (42 %) (2–22) (0.0–59.0) and suspension (146–839) (2.51–7.40) and deposit feeders (37 %) feeders (39 %) C (1) 25 (11/17) 28 03. Apr Ophiuroidea Deposit (48 %) 1352 50.0 Anthozoa and suspension Predators (74 %) feeders (41 %) D (2) 32 (20/29) 114 ± 46 84.1 ± 22.4 Polychaeta Deposit (42 %) 2281 ± 560 204.5 ± 185.28 Bryozoa Suspension (82–147) (68.3–99.0) and suspension (1894–2766) (73.44–335.47) feeders (92 %) feeders (34 %) E (3) 37 (23/27) 81 ± 57 46.0 ± 20.8 Ophiuroidea Suspension 3079 ± 1560 83.0 ± 57.67 Ophiuroidea Suspension (16–123) (23.5–64.5) feeders (52 %) (1449–4627) (20.43–134.06) feeders (46 %) F (17) 43 (30/27) 60 ± 34 33.3 ± 19.2 Ophiuroidea Suspension (45 %) 1593 ± 1217 47.0 ± 47.29 Porifera Suspension (4–131) (5.3–69.1) and deposit (306–4474) (3.70–160.14) feeders (57 %) feeders (35 %)
Table 3. Standardized group parameters for station groups defined after the Cluster and SIMPROF analyses. Abundances, biomasses, and coverage are given as aver- age ± SD (range in parentheses) for the station group. Main seabed image (SBI) taxonomic units (TUs) and feeding guilds are based on abundance in ind. m−2, whereas main multibox corer (MBC) TUs and feeding guilds are based on biomass data. ww: wet weight
and polychaetes were the main TUs in terms of abun- dance and biomass, respectively. Group C was com- prised of only 1 station (Stn 098) located at the eastern slope of the trough (Fig. 1), dominated by ophi u roids and anthozoans (Table 3), and characterized by an in- termediate number of TUs; MBC abundance and bio- mass were higher compared to groups A and B.
Group D consisted of 2 stations (Stns 079 and 089) lo- cated close to each other (Fig. 1) on the eastern shelf, inhabited by a sessile suspension-feeder community dominated, in terms of biomass and organism cover, by bryozoans. The number of TUs was intermediate, and biomass, colonial organism coverage, and epi- faunal abundance were high (Table 3). Group E was formed by 3 stations (Stns 163, 226, and 270) on the shelf break of the Filchner Region (Fig. 1). This group represents a sessile suspension-feeder community with a high number of TUs, high abundance and biomass, and intermediate colonial organism cover, mainly hydrozoans. Ophiuroids showed the highest abundance and biomass values (Table 3), followed by a combination of suspension-feeding tunicates, bry- ozoans, and sponges. Group F was the biggest group,
spread with 17 stations especially over the northern parts of the Filchner Re- gion. This group is dominated by a mixture of suspension- and deposit- feeders, which accounted for up to 80% of abundance and 57% of bio- mass (Table 3). This community was characterized by the highest number of TUs and by intermediate abundance, biomass, and colonial organism cover- age. Ophiuroids dominated in terms of SBI abundance, while sponges and polychaetes contributed most to MBC biomass.
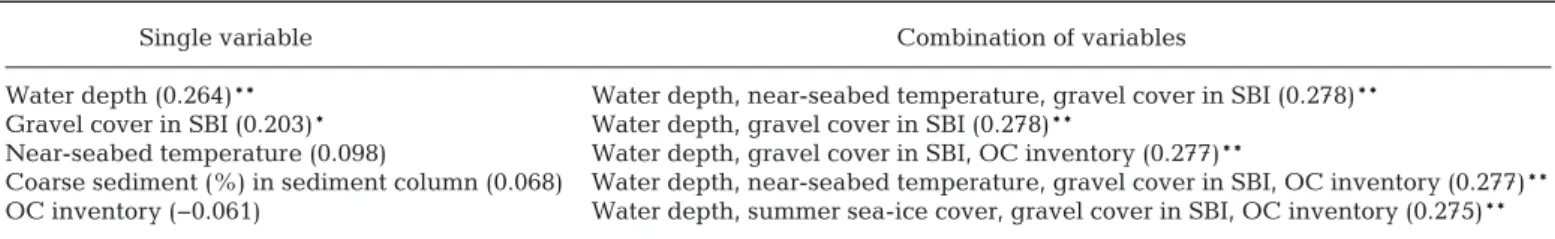
The exploratory BEST analysis indi- cated only rather weak correlations be tween the environmental data and the benthic data matrix conformed by MBC biomass and SBI abundances.
The combination of the 7 selected environmental parameters explained
< 30% of the overall benthic variation (Spearman rank correlation, rho = 0.275; p = 0.006). When testing each environmental variable individually, water depth was found to be the best explanatory variable (Spearman rank correlation, rho = 0.264; p = 0.014).
Combinations of 2 or 3 environmental parameters with water depth were found to be the best explanatory variable combina- tions, but even these combinations explained < 30%
of the benthic variation (Spearman rank correlation, rho = 0.284; p = 0.023; Table 5).
4. DISCUSSION
4.1. Benthic communities in the Filchner Region Our approach to describe benthic communities by combining corer samples and seabed imagery into a single data matrix, and also including stations in the difficult-to-access sea-ice-covered western shelf of the Filchner Region, has considerably extended and updated the current knowledge of the benthic fauna in this high-Antarctic region. Furthermore, our corre- lation analyses between benthic distribution and en- vironmental parameters could help us to understand how the benthos in the Filchner Region might be af- fected by ongoing climate change. Such an analysis enables us to recognize the environmental variables affecting benthic spatial distribution, such as near- Fig. 6. Seabed images representing the typical appearance of the benthic
fauna for station groups A−F defined by the Cluster and SIMPROF analyses.
Except for group C, each seabed image includes representatives of the domi- nant TUs for each group (see Table 3)
A B C D E F Within-group similarity (%) 70.62 52.20 – 67.84 66.67 50.24 Holothuroidea (S) 42.24% Polychaeta (M) 54.53% Bryozoa (S) 32.48% Ophiuroidea (M) 18.88% Ophiuroidea (S) 35.38% Polychaeta (M) 40.14% Polychaeta (S) 28.74% Ophiuroidea (S) 18.06% Polychaeta (M) 20.49% Porifera (M) 11.93% Tunicata (S) 11.03% Between-group dissimilarity (%) A – B 61.97* – Holothuroidea (S) 27.14% Bivalvia (M) 8.33% Crustacea (S) 7.78% Anthozoa (M) 7.14% C 70.55 73.43 – Anthozoa (M) 26.28% Polychaeta (M) 20.14% Polychaeta (M) 20.01% Anthozoa (M) 18.52% Ophiuroidea (M) 16.99% Ophiuroidea (S) 12.24% D 84.65* 78.61* 83.87 – Bryozoa (S) 18.17% Bryozoa (S) 18.29% Bryozoa (S) 18.18% Holothuroidea (S) 16.43% Bryozoa (M) 16.32% Anthozoa (M) 18.14% Polychaeta (S) 13.77% Polychaeta (M) 15.60% Bryozoa (M) 15.57% Polychaeta (M) 13.76% E 82.94* 74.33* 70.93 67.39* – Holothuroidea (M) 18.08% Polychaeta (M) 14.57% Anthozoa (M) 21.29% Bryozoa (S) 18.88% Polychaeta (M) 12.24% Ophiuroidea (M) 11.83% Ophiuroidea (M) 12.32% Polychaeta (S) 15.06% Ophiuroidea (M) 10.82% Hydrozoa (S) 8.89% Holothuroidea (S) 10.72% Bryozoa (M) 14.11% Ophiuroidea (M) 9.37% Ophiuroidea (S) 8.12% Hydrozoa (S) 9.49% Hydrozoa (S) 8.09% Porifera (M) 6.61% F 74.41* 63.46* 66.61* 63.90* 56.70* – Holothuroidea (S) 21.14% Ophiuroidea (S) 13.91% Anthozoa (M) 23.42% Bryozoa (M) 18.12% Ophiuroidea (M) 10.82% Ophiuroidea (S) 15.04% Polychaeta (M) 11.89% Holothuroidea (S) 11.89% Bryozoa (S) 14.83% Hydrozoa (S) 9.79% Polychaeta (M) 9.05% Bryozoa (S) 7.62% Polychaeta (M) 10.15% Polychaeta (M) 12.28% Porifera (M) 8.43% Bryozoa (S) 7.15% Crustacea (S) 6.69% Bryozoa (S) 7.93% Ophiuroidea (S) 11.37% Polychaeta (M) 8.32% Porifera (M) 6.67% Bryozoa (S) 7.31% Anthozoa (M) 6.29 Ophiuroidea (S) 7.03%
Table 4. Within-group similarities, between-group dissimilarities (bold), and taxonomic unit contribution (%) resulting from the SIMPER analysis of benthic station groups A−F based on seabed image abundances (S) and multibox corer biomasses (M). *Significantly different (p < 0.05) in a pairwise PERMANOVA. (–) Not applicable
seabed temperature and sea-ice cover, which are predicted to change by the end of the century due to climate change (Timmermann & Hellmer 2013, Hellmer et al. 2017).
We differentiated 6 station groups, 5 of which rep- resented distinct communities (see Section 3). We consider group C as a 1-station group separately. In terms of epifaunal benthos, group C appears similar to group B, whereas its infauna was different from other groups (Table 3). Whether the infaunal compo- sition at this station is driven more by local environ- mental characteristics or by the efficiency of the MBC to catch e.g. few but large anthozoans, which charac- terize the infauna at this station, remains unclear. As- sessing why group C is so peculiar will require further sampling in the southeastern part of the Filch- ner Region.
For the remaining groups, we as sume groups A, D, and F to correspond to the benthic communities pre- viously described for the Filchner Region (Voß 1988, Gerdes et al. 1992, Gutt & Starmans 1998). However, our results point to distribution shifts and expansion of previous distribution ranges. Group A corresponds to the Southern Trench community sensu Voß (1988).
In contrast to the original description of the Southern Trench community (Voß 1988), we found this group only in the southern deepest part of the Filchner Trough and not along the whole trough, making it a
‘Deep Trough community’ rather than a Southern Trench Community (Fig. S3 in the Supplement).
Group F corresponds to the Eastern Shelf community sensu Voß (1988). This group was distributed not only on the eastern shelf of the Filchner Region, but also on the western shelf, the continental slope, and the slope of the inner trough, hence extending the distribution borders of this community considerably.
This agrees with previous descriptions of the Eastern Shelf community, which also pointed to an extended distribution range of this community (Gerdes et al.
1992, Gutt & Starmans 1998). The extended distribu- tion of the Eastern Shelf community to the deeper continental slope and also to the northern part of the western shelf of the Filchner Region suggests a con-
nection between these shelves. Group D corresponds to the Southern Shelf community sensu Voß (1988).
The Southern Shelf community was originally de - scribed to be mainly distributed along the ice shelf edge southwest of the Filchner Trough and in one small area on the continental shelf off Halley Bay (our Fig. S3; Voß 1988). According to our results, group D on the continental shelf seems to have shifted southwards on the southeastern shelf. How- ever, heavy sea-ice conditions in the entire southern Filchner Region, especially off the Rønne Ice Shelf, did not allow extensive station work in this area, thus making the confirmation of the original distribution range of this community impossible.
The 2 other communities we differentiated are de - scribed for the first time in the Filchner Region. One of these corresponds to group B, defined as a poor and mixed community with low abundance, biomass, and number of taxa. This community was found in 700 m water depth at the inner slope of the continen- tal shelf northeast of Halley Bay, at the inner slope of the central part of the Filchner Trough, and in prox- imity of the large iceberg A23-A on the western shelf in 380 m water depth. We define the heterogeneous group B as an ‘Ice/ISW related community’. Although located in different areas of the Filchner Region (Stns 033, 072, and 037), the stations of this group share hydrographic characteristics, which might ex - plain the benthic similarities among them (Fig. S4 in the Supplement). The second newly defined benthic community was represented by group E and oc - curred along the continental slope at water depths between 600 and 800 m. This community living on sediments highly covered by gravel was dominated by ophiuroids and defined as the ‘Continental Slope community’.
4.2. Filchner Region compared to other Weddell Sea regions
The MBC quantitative benthic data we present for the Filchner Region allows us to compare our results Single variable Combination of variables
Water depth (0.264)** Water depth, near-seabed temperature, gravel cover in SBI (0.278)**
Gravel cover in SBI (0.203)* Water depth, gravel cover in SBI (0.278)**
Near-seabed temperature (0.098) Water depth, gravel cover in SBI, OC inventory (0.277)**
Coarse sediment (%) in sediment column (0.068) Water depth, near-seabed temperature, gravel cover in SBI, OC inventory (0.277)**
OC inventory (−0.061) Water depth, summer sea-ice cover, gravel cover in SBI, OC inventory (0.275)**
Table 5. Single and combination of variables ‘best explaining’ distribution patterns of benthic communities. Parentheses: Spearman rank correlation rho values. OC: organic carbon; SBI: seabed images. *Correlation p < 0.05; **correlation p < 0.01
with other Weddell Sea regions. PERMANOVA ana - lyses of benthic abundance and biomass as well as faunal community composition showed significant differences among these Weddell Sea regions (Sec- tion 3, Table 2). As a general pattern, high benthic abundance and biomass prevailed in regions with low sea-ice cover, such as TAP and the SEWSS, with a yearly average sea-ice cover of 12 and 58% and summer averages of 2 and 29%, respectively (Fet- terer et al. 2018). In contrast, lower abundance and biomass values were observed in regions with higher sea-ice cover, e.g. in the Filchner Region and the LA, where yearly average sea-ice cover reached 76 and 69% and summer sea-ice cover 50 and 75%, respec- tively (Fetterer et al. 2018). Sea-ice cover, its ex - tension and persistence, are key factors regulating primary production (Arrigo et al. 2015). Thus, the between-region sea-ice regime differences would imply differences in the primary production regime, which in turn would cause different particle fluxes and food input to the benthos (Gutt 2001, Isla 2016).
We therefore suggest regional differences of benthic abundance, biomass, and composition are due to dif- ferences in local production and particle flux regimes, regulated by sea ice (e.g. cover, ice-free days).
4.3. Filchner Region past vs. present
The comparison of the present MBC data set with previously reported data from the Filchner Region (Gerdes et al. 1992) showed significant differences, with reduced abundance and biomass as well as changes in the faunal composition. The MBC abun- dance and biomass values we found were half of those previously recorded in the Filchner Region dur- ing the late 1980s. In terms of abundance-based com- position, we found that groups such as tanaids and isopods lost importance, being ‘replaced’ by clitellate worms and ophiuroids. In terms of biomass-based composition, bryozoans gained in importance, con- tributing more to overall average biomass than sponges, which were formerly found to dominate the fauna (Gerdes et al. 1992). These observations might already evidence climate-induced changes (sea-ice cover increase; Fig. 2; Fig. S5 in the Supplement) in community parameters, also including modifications in composition patterns of benthic communities. Sim- ilar benthic abundance and biomass losses following productivity losses have been found for the Austasen region (eastern Weddell Sea shelf) in a 26 yr period (authors’ unpubl. data). These productivity losses were related to an increase in sea-ice cover between
1988 and 2014. Thus, we hypothesize our observed lower benthic abundance and biomass, compared to values recorded by Gerdes et al. (1992), to be related to the increase in sea-ice cover (our Fig. S5; Turner et al. 2016, Fetterer et al. 2018), which reduces the size and duration of the summer polynya, thus also reduc- ing primary productivity in the Filchner Region (Arrigo et al. 2015, Pineda-Metz in press).
Comparing our epifauna results with older data, too, reveals differences. Previous studies based on SBI data defined 6 clusters in the Filchner Region. These assemblages, however, were also found on the SEWSS and on the Lazarev Sea shelf (Gutt & Star mans 1998).
The holothurian ‘deposit-feeder- dominated’ cluster sensu Gutt & Starmans (1998) in the deep southern Filchner Trough corresponds to our group A. The ‘suspension-feeder-rich’ and ‘suspension- feeder-poor’
clusters (sensu Gutt & Starmans 1998) in the northern part of the eastern shelf of the Filchner Region par - tially overlapped with our station groups E and F.
However, while both suspension-feeder clusters were bryozoan-dominated (Gutt & Starmans 1998), these were less abundant in our groups E and F. This holds especially true for group E along the outer slope of the Filchner Region, where hydrozoans were the domi- nant TU. Bryozoan dominance in the Filchner Region appears to have shifted towards the south of the east- ern shelf, a shift which could be driven by the in - creased sea-ice cover over the outer slope, and de- creased sea-ice cover over the eastern shelf.
4.4. Environmental drivers for benthic distribution Our analyses did not indicate any strong correla- tion between the assessed set of environmental para - meters and benthic distribution patterns (all correla- tion coefficient values of the BEST analyses were < 0.3).
This agrees with studies conducted in the Bellings - hausen, Weddell, and Lazarev Seas, which found rank correlation coefficients < 0.550 by means of an analy- sis similar to the BEST test (Gutt & Starmans 1998, Saiz et al. 2008).
Water depth as a single variable showed the highest correlation value to explain benthic variabil- ity, although the correlation was weak (Table 5).
Water depth is proposed to regulate benthic food in- put, its quantity and quality, by modifying particle residence time in the water column (Smith et al.
2006), thus also regulating benthic distribution. This could explain why some TUs such as polychaetes, isopods, amphi pods, and bryozoans have been de- scribed as water-depth-dependent groups on Antarc-
tic shelves (Elling sen et al. 2007, Saiz et al. 2008, Jaz - dzewska & Sicinski 2017). In contrast, e.g. sponges, ascidians, and bivalves have been proposed to rely on water circulation and re-suspended particle supply instead (McClintock et al. 2005, Ellingsen et al. 2007, Segelken-Voigt et al. 2016), hence being more water- depth-‘independent’. The mix of water depth-depen- dent and -independent TUs could partially explain the low correlation between water depth and benthic spatial distribution patterns. This coincides with ben- thic distribution patterns described for the Ross Sea (Cummings et al. 2010) and Bellingshausen Sea (Saiz et al. 2008), and would support the proposed capacity of Antarctic benthos to distribute over large depth ranges (Brey et al. 1996).
The content of organic matter in or on the seabed is commonly regarded as an important food source for benthos (Sañé et al. 2011, Zhang & Wirtz 2017). In our study, OC inventories in the sediment were just defined as quantities, and quality was not examined.
The OC inventories did not show any correlation with benthic distribution patterns. This lack of corre- lation between OC as a single variable with benthic distribution would seem to agree with a recent study (Zhang & Wirtz 2017) which said that OC quality was more important than quantity for explaining the structure of benthic communities. Thus, our observa- tions reaffirm the idea that benthos distributes inde- pendently of the amount of OC found in the sediment column.
Sea ice affects benthos in an indirect way by regu- lating primary production (Arrigo et al. 2015, Pineda- Metz in press) and thus the food supply for benthic organisms. Despite these effects on primary produc- tion, sea-ice cover or its temporal trend were not listed as variables in our correlation analyses (Table 5).
However, we found hints pointing to a combination of polynya location and water mass circulation to be related to benthic spatial distribution, as proposed by bentho-pelagic coupling and benthic distribution studies in other Antarctic regions (Grebmeier &
Cooper 1995, Isla et al. 2006, Jansen et al. 2018). The main polynya in the Filchner Region is formed on the eastern shelf (Fetterer et al. 2018), where water from the Weddell Sea Gyre enters and flows southwards towards the Filchner Ice Shelf (Ryan et al. 2017).
While the polynya enhances primary production, the water mass circulation distributes this matter towards the south, supporting the presence of suspension feeders even in areas with relatively high sea-ice cover (e.g. southern part of the eastern shelf, where the Southern Shelf community was found). Con- versely, water masses in the Filchner Trough origi-
nating from underneath the Filchner Ice Shelf flow northwards towards the continental break (Ryan et al. 2017). Due to its sub-ice shelf origin and heavy ice conditions in the trough, these water masses should be less productive and transport less suspended or - ganic matter, which might explain the high domi- nance of deposit feeders such as elasipodid holo - thurians and the concomitant absence of suspension feeders. A similar situation was described for Mc - Murdo Sound in the Ross Sea. Benthos production was higher in the eastern Sound, where water masses flow towards the Ross Ice Shelf, and lower in the western Sound, where water masses come from underneath the Ross Ice Shelf (Barry 1988, Barry &
Dayton 1988).
Water mass circulation patterns in the Filchner Region appear to better explain the general benthic distribution pattern than any of our considered para - meters or combinations of them (Fig. S4). The ‘Deep Trough community’ occurs in the deep Filchner Trough, where dense water originating at the Rønne Trough circulates (our Fig. S4; Ryan et al. 2017). The
‘Ice/ISW related community’ was found outside of the Filchner Trough, either close to the iceberg A- 23A on the Berkner Bank, off the Brunt Ice Shelf, or in the ISW flow path (Fig. S4). The influence of water masses on benthic community distribution also be - comes evident in the Southern Shelf community, rep- resented in our study by 2 closely located stations in the south of the eastern shelf, likely related to the southern limit of modified Warm Deep Water (WDW;
Fig. S4) coming from the north. Furthermore, the Continental Slope and Eastern Shelf communities (groups E and F) appear to live in warmer waters, most likely WDW and modified WDW from the Wed- dell Gyre. The circulation of WDW along the conti- nental slope of the Filchner Region could also explain the connectivity between the eastern and western shelves of the Filchner Region, which we assume from the distribution of the Eastern Shelf community also on the western shelf.
5. CONCLUSIONS
Our approach using a combination of SBI and MBC data allowed for a comprehensive benthic commu- nity description by including data from both infaunal and epifaunal benthos. With this approach, we found the benthos of the Filchner Region to be highly het- erogeneous and composed of 5 distinct communities.
Comparison of our data with previous benthic studies in the Filchner Region and other areas of the Weddell
Sea show distinct differences among the benthic communities from the Filchner Region, the TAP, the SEWSS, and the LA. We attribute these differences to specific sea-ice and production regimes in these re - gions. Our results also provide partial evidence that benthos in the Filchner Region underwent changes in terms of abundance, biomass, and composition between the late 1980s and the mid-2010s. In addi- tion, shifts in the distribution ranges of the benthic communities became apparent. These changes are most likely related to water mass circulation patterns and increased sea-ice cover in the area. Our correla- tion analysis showed that the environmental parame- ters considered explained < 30% of the benthic spa- tial distribution. These results suggest further drivers for benthic community structure and composition, such as water mass circulation patterns, planktonic productivity, particle flux and lateral transport, and planktonic community abundance and composition.
However, due to a lack of data, we could not include these parameters into our analyses. Nevertheless, the results of our correlation analyses can prove useful to further define environmental parameters to be con- sidered for predicting future climate change effects on the Antarctic benthic fauna. Thus, we strongly re - commend future studies to take a coordinated multi - disciplinary approach. Such an approach should also include comprehensive bentho- pelagic coupling studies, which will provide a better tool to under- stand how benthos is (and could be) shaped by its environment.
Acknowledgements.We thank the crew of the R/V ‘Polar - stern’ for their help and good disposition during the PS82 and PS96 cruises. Many thanks also to Astrid Böhmer, Chester Sands, Dieter Piepenburg, Emilio Riginella, Harald Biebow, and Nils Koschnik for giving a helping hand during station work onboard the ‘Polarstern’, as well as to Claudio Richter, Dieter Piepenburg, and anonymous reviewers for their helpful contributions for polishing this manuscript.
Last, but not least, we thank the people who helped during the work onshore in direct and indirect ways: Laura Metz, Mario Pineda, and Horacio Costa.
LITERATURE CITED
Anderson MJ (2001) A new method for non-parametric mul- tivariate analysis of variance. Austral Ecol 26: 32−46 Anderson MJ, Gorley RN, Clarke KR (2008) PERMANOVA+
for PRIMER: guide to software and statistical methods.
PRIMER-E, Plymouth
Arndt JE, Schenke HW, Jakobsson M, Nitsche F and others (2013) The International Bathymetric Chart of the South- ern Ocean (IBCSO) version 1.0 − a new bathymetric com- pilation covering circum-Antarctic water. Geophys Res Lett 40: 3111−3117
Arrigo KR, van Dijken GL, Strong AL (2015) Environmental controls of marine productivity hot spots around Antarc- tica. J Geophys Res Oceans 120: 5545−5565
AWI (Alfred-Wegener-Institut Helmholtz-Zentrum für Polar- und Meeresforschung) (2017) Polar research and supply vessel POLARSTERN operated by the Alfred Wegener Institute. J Large-Scale Res Facil 3: A119
Barry JP (1988) Hydrographic patterns in McMurdo Sound, Antarctica and their relationship to local benthic commu- nities. Polar Biol 8: 377−391
Barry JP, Dayton PK (1988) Current patterns in McMurdo Sound, Antarctica and their relationship to local biotic communities. Polar Biol 8: 367−376
Bathmann U, Fischer G, Müller PJ, Gerdes D (1991) Short- term variations in particulate matter sedimentation off Kapp Norvegia, Weddell Sea, Antarctica: relation to water mass advection, ice cover, plankton biomass and feeding activity. Polar Biol 11: 185−195
Bray JR, Curtis JT (1957) An ordination of upland forest com- munities of southern Wisconsin. Ecol Monogr 27: 325−349 Brey T, Dahm C, Gorny M, Klages M, Stiller M, Arntz WE
(1996) Do Antarctic benthic invertebrates show an ex - tended level of eurybathy? Antarct Sci 8: 3−6
Clarke KR, Gorley RN (2006) PRIMER 6: user manual/tutor- ial. PRIMER-E, Plymouth
Clarke KR, Warwick RM (1994) Change in marine communi- ties. Natural Environmental Research Council, Plymouth Colwell RK (2013) EstimateS: statistical estimation of species richness and shared species from samples. Version 9.
User’s guide and application. http: //purl.oclc.org/ estimates (accessed 4 April 2018)
Comiso JC, Gersten RA, Stock LV, Turner J, Perez GJ, Cho K (2017) Positive trend in the Antarctic sea ice cover and associated changes in surface temperature. J Clim 30:
2251–2267
Cummings VJ, Thrush SF, Chiantore M, Hewitt JE, Cattaneo- Vietti R (2010) Macrobenthic communities of the north- western Ross Sea shelf: links to depth, sediment charac- teristics and latitude. Antarct Sci 22: 793−804
DeMaster DJ (1981) The supply and accumulation of silica in the marine environment. Geochim Cosmochim Acta 45:
1715−1732
DeMaster DJ (1991) Measuring biogenic silica in marine sediments and suspended matter. Geophys Monogr 63:
363−367
Ellingsen KE, Brandt A, Ebbe B (2007) Diversity and species distribution of polychaetes, isopods and bivalves in the Atlantic sector of the deep Southern Ocean. Polar Biol 30:
1265−1273
Fauchald K, Jumars PA (1979) The diet of worms: a study of polychaete feeding guilds. Oceanogr Mar Biol Annu Rev 17: 193−284
Fetterer F, Knowles K, Meier W, Savoie M, Windnagel AK (2018) Sea Ice Index, version 3 [01 January 1979 to 31 December 2017]. NSIDC: National Snow and Ice Data Center, Boulder, CO. doi: 10.7265/N5K072F8 (accessed 9 January 2018)
Foldvik A, Gammerlsrod T, Osterhus S, Fahrbach E and oth- ers (2004) Ice shelf water overflow and bottom water for- mation in the southern Weddell Sea. J Geophys Res Oceans 109: C02015
Gammelsrod T, Foldvik A, Nost OA, Skagseth O and others (1994) Distribution of water masses on the continental shelf in the southern Weddell Sea. Geophys Monogr Ser 85: 159−176