A qualitative study on the development and rectification of advanced medical students’ misconceptions about the physiological electrocardiogram (ECG)
Abstract
Purpose: The study takes a qualitative and explorative approach to capture the concepts that German medical students have of the
Mathias Trauschke
1physiological electrocardiogram (ECG) which they acquired during their
1 Leibniz University of Hannover, Institute for preclinical training. These concepts are then considered for possible
misconceptions. Afterwards a theory-based intervention which allows
Science Education Research subjects to see the connection of the curve progression with the spatial
spreading of excitation (animated vector loop) is put to the test. (Biology Education), Hannover, Germany Methods:In the course of a diagnosis of learning potentials, individual
students participated in problem-centred, guided interviews. The de- veloped intervention was tested in separately conducted teaching ex- periments using thinking aloud protocols. The data evaluation was done through qualitative content analysis. Based on the conceptual metaphor theory, conceptions and their underlying embodied cognition were analysed.
Results:One of the subjects’ typical misinterpretations is taking the progression of the ECG tracing for a mere increase and decrease of the myocardium’s electrical activity, rather than connecting it with its spatial and temporal aspects. The data evaluation has shown that the newly developed theory-based intervention can lead to re-learning. Reconstruc- ted metaphorical concepts illustrate this process of understanding. It is exemplarily shown how, through the course of the interviews, students are enabled to appropriately explain ECGs as the two-dimensional rep- resentation of the spatial excitation propagation in the heart.
Conclusion:By capturing typical misconceptions of the physiological electrocardiogram and demonstrating interventions that support learning, the study provides a contribution to comprehensive learning which can be used in the basic education of medical students.
Keywords:ECG (misconceptions), Model of Educational Reconstruction (MER), Conceptual Metaphor Theory
1. Introduction
The differences in potentials shown by the ECG result from the excitation of the heart. The ECG can give inform- ation on the position of the heart as well as on frequency, rhythm and spatial excitation propagation. The direction and the magnitude of the potentials vary throughout the excitation propagation which can be visualized by vectors.
The vector sum, calculated from the single vectors, pro- duces a typical loop-shaped graph in the course of the excitation. The chronological sequence of the vector – projected on the frontal, sagittal or horizontal plane – can be visualized in the ECG [1]. The ability to read and inter- pret an ECG is one of the key competences that students of human and veterinary medicine must acquire. However, acquiring this competence poses a particular challenge [2]. A number of studies on the teaching and learning of competences and abilities needed for ECG interpretation
are therefore subject of current research in education research [2], [3], [4], [5], [6]. All of the research ap- proaches refer mainly to the competence in interpreting pathological ECGs in the clinical part of the medical training. Students’ basal concepts of the basics of the physiological ECG are less considered. Thus, conducting a qualitative study, students’ understanding of ECGs was recorded in order to identify possible learning difficulties and to explore theory-based developed learning opportun- ities. To do so, the concepts students of human medicine have of physiological ECGs were captured by using guided interviews [7] and qualitative content analysis [8]. A specially designed intervention (video animation, see at- tachment 1) was tested in teaching experiments [9].
Abstract information – like the varying directions of poten- tials represented in the ECG [1] – is cognitively extrapol- ated by employing conceptual metaphors [10]. The con- ceptual metaphor theory [11] used in the research of
concepts in science education research was therefore used as an instrument of analysis [12] to model thinking processes. The reconstructed concepts drawn from the interviews and the teaching experiments were con- sequently interpreted by using systematic metaphor analysis [13]. The paper describes typical misconceptions of the physiological ECG and identifies a possible way of learning appropriate concepts of the abstractly visualized information on the directions of excitation in an ECG.
2. Theoretical framework
This research approach is based on the holistic approach known as cognitive linguistics, which states that syntax and semantics are intricately bound to each other. Lin- guistic phenomena are therefore of analytical interest in order to model conceptual structures [14].
The conceptual metaphor theory is used [10], [11], [12]
to analyze the understanding (and non-understanding) of a physiological ECG and to make predictions about in- terventions that support learning.
According to the theory of embodied cognition, we gener- ate embodied concepts by interacting with our physical and social surroundings. These embodied concepts con- stitute the core of the cognitive processes available to us. By unconsciously projecting such “cognitive primitives”
[11] even abstract concepts can be mentally represented.
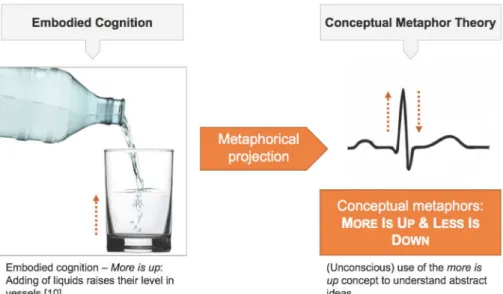
Embodied concepts which are used to make abstract entities tangible are called conceptual metaphors. This definition of metaphor is reserved to cognitive linguistics and should not be confused with metaphor as defined and used in philosophy and every-day language. Tradition- ally, the latter two define it as a consciously used figurat- ive expression of poetic language [14]. “Orientational metaphors” [10], amongst others, structure our thinking as can be seen in the example of themore is upmetaphor [10]. The concept ofmore is upis grounded in embodied experience and can structure the understanding of con- cepts which are more abstract and harder to grasp. With respect to the concepts of the electrocardiogram it seems reasonable that students are framing the curve progres- sion in terms of this orientational metaphor (see figure 1).
3. Research questions
The purpose of this study is to capture the concepts of the physiological ECG that medical students in the study phase of their clinical rotation have and to analyze poten- tially existing misconceptions. A teaching experiment was developed in order to test an instructional task explorat- ively. The following research questions are of interest:
1. Which concepts do medical students construe with regard to the physiological ECG and which conceptual metaphors structure their understanding?
2. Which concepts do medical students construe with regard to the physiological ECG while interacting with the theory-based teaching experiment?
4. Research design and methods
Conceptions are defined as cognitive constructs recon- structed from people’s utterances. These constructs can be ascribed to individuals according to the context in which the utterances were made. The aim of reconstruct- ing students’ conceptions from their subjective utterances makes a makes a qualitative and explorative research approach necessary. The Model of Educational Recon- struction (MER) [15], which is widely established within science education research, serves as frame of research.
Firstly, the learners’ ideas related to the subject matter are analyzed against the background of possible diffi- culties in understanding (investigation into students’
perspectives). Then, scientific concepts as found in origin- al publications or academic textbooks are examined from the point of view of their intended instructional impact (clarification of science content) in order to finally develop and explore learning opportunities derived from a recip- rocal comparison of the two and to then explore them (analysis, design and evaluation of learning environ- ments).
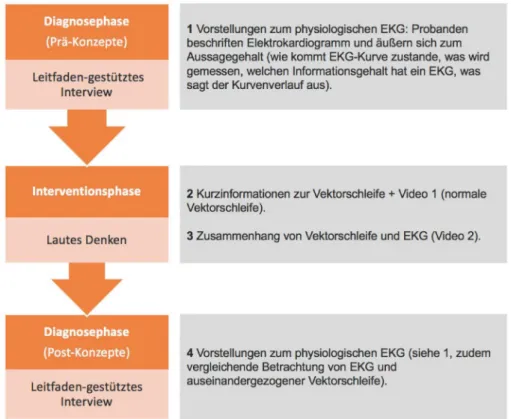
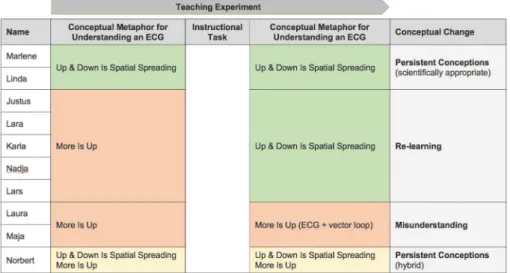
The methodological setting was oriented towards the teaching experiment [9]. In meetings with individual stu- dents (n=10, 5th-10th semester), their concepts of the physiological ECG before, during and after the interaction with our intervention (see attachment 1) were recorded (see also figure 2). In order to capture possible miscon- ceptions, subjects in the study phase of their clinical ro- tation were chosen because they have previously taken courses on the physiological ECG. As (mis)conceptions are reconstructed on the basis of conceptual metaphors, an attribution of subjects to specific semesters is not necessary since ideas framed by conceptual metaphors are regarded to be constant within similar cultural envir- onments [11].
During the intervention, subjects were asked to think aloud [16] in order to allow close analytic access to the individual thougt processes while being engaged in the animation.
Subjects took part in guided interviews on the ECG before and after the intervention, so that individual pre-concep- tions and learning effects could be reconstructed [7].
These meetings lasted 45 to 60 minutes. All videoed statements were evaluated using qualitative content analysis [8] and systematic metaphor analysis [13]. To ensure the intersubjectivity of the research results and their interpretation, the entire data evaluation was based on consensual and argumentative validation in a two-step procedure: The individual transcripts were examined by the author of this study to identify the conceptual meta- phors employed. Afterwards, a member of the research team re-examined the transcripts on the basis of the category system compiled in the first step.
Figure1: Relation of embodied cognition and metaphorical understanding of abstract concepts. The experientially based concept more is up is unconsciously activated in other more abstract situations in order to construe mental representations. This study
is based on the assumption that students identify the curve progression as increase and decrease of excitation.
Figure 2: Reciprocal analysis of conceptions und examination of the instructional task – overview of the course of the conducted single-sessions of the teaching experiments.
After establishing consensus within the research team on the reconstructed metaphors found, the argumentative validation of the data took place in the research group of the Institute for Natural Science Education of Leibniz University Hanover. All subjects were informed about the methodological procedure in detail and gave their con- sent. The data were anonymized, a matching of citations to the corresponding person is not possible because pseudonyms are used.
5. Results
5.1 Misconceptions of the physiological ECG
Two subjects showed scientifically correct conceptions during the entire course of the study. Their statements will therefore not be further examined. Eight subjects showed to have scientifically misleading conceptions which will be presented sorted into categories. The exem- plary citations, which we chose and will explain in detail, were collected during the phase of the qualitative content analysis. The metaphorical concepts drawn from this are
the same as the ones from the “individual structuring”
[8] at the end of the content analysis.
5.1.1 Metaphorical concept I: The higher the curve, the greater the excitation [6]
Exemplary statements (prime examples) Karla
(27-31): ”[The excitation in the ECG is greatest] there, where the peak is the highest.“
(36-41):“I would[mark the lines]of the depolarisation and repolarisation of the atria. The atria are completely depolarized here, I would say (marks the maximum of the P-wave).”
Justus
(147-158):”This is the P-wave. The other is the P-wave, too – the upward and downward deflection of the P-wave.
As this is the excitation of the atria, I interpret this as the increase and decrease in excitation of the atria.”
Explanation and metaphor analysis
Six subjects interpret the rise and fall in the curve progres- sion as an increase and decrease in excitation. The curve maxima are considered as the times of highest excitation.
The meaning of the abstract curve of the ECG is mentally represented as the orientational metaphormore is upor less is downrespectively.
This kind of interpretation of a physiological ECG is mis- leading because the curve maxima (peaks of P-wave and R-wave) are erroneously understood to be the times of complete excitation of the atria or the ventricles.
A further educational challenge is the fact that the basic relation between the ECG curve and the spatial progres- sion of excitation is not recognized.
Individual structuring (metaphorical concept)
More Is UpI – The higher the curve, the greater the excit- ation.
5.1.2 Metaphorical concept II: The higher the curve, the more cells are excited [3]
Exemplary statements (prime examples) Justus
(109-142):“I would say that here[points to the peak of the R-wave]the excitation is the greatest. There are, as we know, different phases: systole and diastole. Systole is the phase of ejection, diastole the phase of re-filling.
And the excitation is probably greatest during the systole, when the highest possible number of muscle cells in the heart (…) are excited and that is the case at the peak shortly before the systole.”
Explanation and metaphor analysis
Justus thinks that the peak of the R-wave correlates with the maximum number of excited heart cells. Themore is upmetaphor structures the understanding here, too. In this case, the curve progression (up/down) is being con- nected to the number of excited cells (many/ few). From the point of view of educational research this conception is to be regarded as a learning obstacle as it is scientific- ally misleading. The highest number of depolarized
myocardium cells is not reached until the end of the QRS- complex, and not at the peak of the R-wave.
Individual structuring (metaphorical concept)
More Is UpII – The higher the curve, the more cells are excited.
5.1.3 Metaphorical concept III: The higher the curve, the greater the contraction [2]
Exemplary statements (prime examples) Lara
(54-62):“Because of the addition of the various vectors which represent the electrical excitation, the contraction is, of course, greatest where there is the highest peak.
(…) So, up here at the peak of the R-wave the mass-re- lated highest electrical contraction is also occurring.“
Explanation und metaphor analysis
Lara’s conception is also marked by the employing of the more is up metaphor. In this case, the highest peak of the curve is connected with the highest excitation and the greatest contraction of the ventricles. The statements also show that excitation and contraction are semantically the same for Lara. She even speaks of “electrical contrac- tion”. From a medical point of view this conception is problematic because an electrocardiogram usually does not give hints on the cardiac contractility. Moreover, the assumed proportionality of curve amplitudes and extent of contraction is scientifically not correct.
Individual structuring (metaphorical concept)
More Is Up III – The higher the curve, the greater the contraction of the myocardium.
5.1.4 Metaphorical concept IV: Vector sizes represent number of excited cells [1]
Exemplary statements (prime examples) Nadja
(81-99):“If a few[cells]are excited,[…]then the vector is relatively small (…).”
(81-99):“If more than half[of the cells]are excited, (…), then the vector is becoming small again. This is the de- clining[part of the P-wave].“
Explanation und metaphor analysis
Nadja is mentioning the vectors. However, she thinks that the increase and the decrease of the size of the dipolar vector equals the rise of the ECG curve or respectively its fall. The abstract construct of added dipolar vectors is thus not understood appropriately from the scientific perspective.
Nadja is especially incapable of understanding the rela- tion of the ECG with the vector loop.
She is missing the concept of the vector sum changing extent and direction during the cardiac action. Again, the more is upconception is metaphorically used to cognit- ively grasp abstract information (→ a shrinking vector equals a declining curve). She is another student to whom the aspect of directionality is not conceivable.
Individual structuring (metaphorical concept)
More Is UpIV – Vector size represents number of excited cells.
5.2 Concepts of the relation of the animated vector loop with the ECG
The theory-based animation focuses on the teaching of the relation of the ECG and the spatial excitation propagation within the myocardium (see attachment 1).
Two subjects were able to correctly repeat the intention of the learning offers. These were the same two students in who we had entirely scientifically correct conceptions of the physical ECG throughout the course of the study (see 5.1). Their statements will not be examined in the following.
The main focus of the evaluation is the description of the pattern of captured learning effects which could be identified in five subjects. It is documented on the basis of a typical example (subject: Justus).
In the beginning, the subject explains and understands the ECG curve progression in terms of the orientational metaphorsmore is upandless is down. The rise and fall of the graph are interpreted as an increase and decrease of excitation (cf. 5.1.1 and 5.1.2).
Justus realizes in the interaction with the animation that there is a conceptional relation between the graph of the ECG and the vector loop which extends in time.
It is transparent that the animation brings Justus to dis- solve the semantical merging of the concepts of spatial and temporal excitation propagation.
(291-300): “The vector loop and the ECG curve are basically the same. I look at the excitation loop from different angles (…). For one,[I] can understand it spatially from different angles and, by protracting it, also temporally.”
Justus now terms the excitation as something ‘spatial’
and expresses a conception of the ECG curve reflecting the spatial propagation of cardiac excitation within the course of time.
(333-347): “When you look at this, here is the peak of the R-wave and here the peak of the S-wave. You can see that first the depolarization moves in this direction and then in the opposite direction because it goes towards minus. But it is something spatial. The ventricles are then fully excited.”
(348-355): “In the increase[of the R-peak]– in rela- tion to the heart axis, which runs like this – the excit- ation moves downwards, that is towards my viewpoint, towards me and[in the downward slope of the P-wave]
the excitation moves away from me.”
The progression of the ECG is not misinterpreted anymore in terms of themore is upmetaphor. The understanding is now structured by a new metaphorical concept. The vertical orientation of the curve progression is now under- stood as the representation of a spatial process (meta- phorical concept:up & down signifies spatial spreading).
In the course of his interview Justus even realizes his former incorrect view of the R-peak and develops an idea
of the electrocardiogram giving information on the spatial excitation progression within the heart.
(356-378): “Oh yes, I said that at the high peak the excitation was the greatest. Theoretically, it doesn’t get smaller as such, from my point of view it just changes its spatial orientation. (...) To look at the in- crease and decrease[of the ECG]is not very product- ive because the amplitude of the peaks is not import- ant primarily, but the viewing angle: Where exactly does the excitation move towards. When I want to look at it in the beginning, it is rather a directional vector,[it]gives information on the direction and not on something quantitative like millivolt, while we, of course, measure in millivolt, but for the interpretation of the ECG –educationally speaking – it is primarily important to understand in which direction it moves when I see a rise in this two-dimensional graph.“
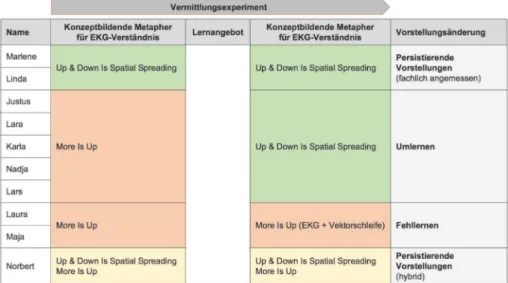
In conclusion, we will take a look at the other three sub- jects (cf. figure 3). Already in the beginning (in the first phase), Norbert explains correctly that an ECG reflects the spatial propagation of excitation. Rise and fall are interpreted as directions of excitation (metaphorical concept:up & down signifies spatial spreading).
(38-41): “The[increase in the ECG] says something about the spatial excitation propagation, that is the electrical activity which moves towards one direction of the electrode [and] away from the other depending on which lead is being projected.”
However, he also construes misleading conceptions of the ECG curve which can be traced back to themore is upandless is downconcept.
(26-55): “Then we elevate ourselves to the initial level again and end all this with a slightly bigger elevation than the first one of the P-wave. Then we phase out on the normal line. (…) In principle, the projected ex- citation is greatest at the peak of the QRS-complex, that is at the R-peak.”
Even after the intervention Norbert demonstrates hybrid thought constructions. He keeps construing misconcep- tions which are grounded in the afore described orienta- tional metaphor (metaphorical concept II: the higher the curve, the more cells are excited). Nevertheless, Norbert expresses an idea of the ECG representing directions of excitation.
(307-321): “The decrease of the P-wave signifies that fewer cells are newly excited in the ventricles than when the graph increases or at its highest peak. This means that fewer cells are excited there than at the highest point of the P-wave.[At the highest point of the P-wave]most cells in the ventricle are excited at this time.”
(391-407): “The key information of the ECG is this:
The ECG is showing the electrical excitation propagation within the heart in different directions.”
Norbert admits that he is not able to understand the an- imated vector loop right away. After a short time of thinking, however, he associates the stretched vector loop with the corresponding ECG parts correctly.
Figure 3: Conceptual metaphors for understanding and misunderstanding the physiological ECG during the teaching experiment
(163-190): “Now, it’s understood. [It was] drawn statically at first. (…) The first small circle is this part, the second big circle is this part and the small circle then is this part(pointing first to the P-wave, then to the QRS-complex and then to the T-wave).[The inclin- ing part of the R-peak]should be this large curve.”
The true intention of the intervention remains hidden to Norbert because he does not realize the relation between the animation and the direction of the excitation propagation represented in the ECG.
During the first part of the teaching experiment it was possible to identify misconceptions Laura had (metaphor- ical concept: the higher the curve, the more cells are ex- cited). These are also found after the interaction with the animation. We want to emphasize the misconception which came into being by the interaction with the learning offer/animation:
(590-645): “[The vector loop] stretches to the left.
This is because the left ventricle is much thicker than the right ventricle and it has much more muscles, so that the loop is bent in this direction and is not – for example – going straight up again.”
(648-669): “Even though a few go in this direction, the very most go towards this direction and because of that it keeps on going there, that is first in the septum, then it goes to the back, in the ventricles the signal again goes up. And then we’re back to the level of the AV node.”
The subject seems to be imagining that the vector loop is representing the excitation which is moving up and downwards within the heart tissue. The more is up metaphor is therefore also used to grasp the abstract vector loop. In this case the animation leads to a mislead- ing conception because the abstract idea of the vector loop cannot be understood in terms that would help to understand the ECG.
Maja’s statements show that she can label the phases of the ECG correctly. Looking at the data available there are no hints, however, to whether she has got a concep- tion of the spatial excitation propagation represented by the ECG. She also construes scientifically inappropriate
conceptions to which verticality again serves as embodied experience.
(33-69): “Theoretically, you could say [that] here (points to the peak of the R-wave)the excitation is the greatest because the peak is the highest.”
After the interaction with the animation she shows a positive reaction in her comment:
(136-174): “Oh, I’ve never seen this before. How cool is this?! Yes, of course,[it]totally makes sense, when you pull this together, but draw the heart loop like this. It almost looked like a normal ECG. Well, this is news to me. It almost looks identical.”
Maja indeed is able to match the parts of the stretched vector loop with the corresponding section of the ECG.
The statements at hand, however, suggest that she un- derstands the vector loop in terms of the more is up metaphor. Thus, this leads to a construction of a scien- tifically inappropriate idea.
(477-498): “Up here (points to the vector loop)we would have the beginning of the excitation of the ventricles. This would probably exactly represent the section of the Q-peak. You can see[the]ascending [and]descending[section]here (points to the corres- ponding segment in the vector loop).”
6. Discussion
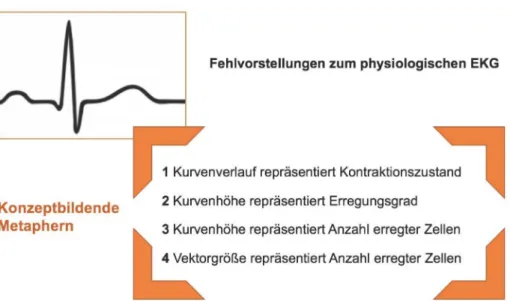
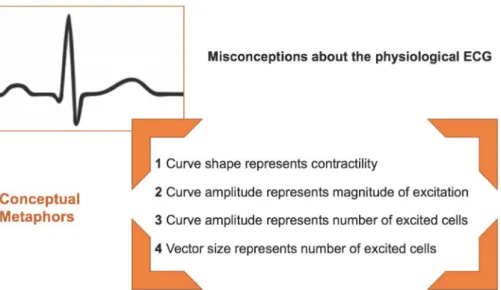
With our teaching experiment, it was possible to identify the misconceptions medical students had construed of the physiological ECG. Using conceptual metaphor theory, the identified misconceptions could be traced back to the misleadingmore is upmetaphor. Typically, the curve progression is merely understood as a representation of the increase or decrease of electric activity within the myocardium. The progression of the curve, however, could not be associated with spatial or temporal aspects of cardiac excitation. Hence, the initial hypothesis is suppor- ted; or can be rather specified: First, the progression of the curve can be understood as a representation of the cardiac contractility. Second, different amplitudes of the
Figure 4:More Is Up – metaphorical conceptions impeding an appropriate comprehension of the physiological ECG.
curve can be understood as representations of the mag- nitude of cardiac excitation or, third, of the number of excited cells. Finally, even the vector size can be under- stood as a representation of the number of excited cells (see figure 4).
Because of the limited number of participants of this study, the listing of conceptual metaphors impeding the understanding of ECGs is certainly not intended to be exhaustive. Due to the research design, the sample does not offer representative data. Hence, the results cannot be generalized beyond the test subjects. However, refer- ring to conceptual metaphor theory, misconceptions of a similar type are expected to appear in larger samples, too. Orientational metaphors are assumed to arise from grounded experiences with our physical environment, which are similar to all human beings [11].
Furthermore, in this study we explored a theory-guided instructional task which focuses on the correlation of the vector loop and the progression of the ECG. Thereby, we are able to show that some students explain an ECG as a two-dimensional representation of spatial excitation propagation appropriately after having interacted with the animated vector loops (see appendix). From then on, the understanding of the ECG no longer relies on the un- derlyingmore is upmetaphor. Instead, the curve´s rise and fall are comprehended as representational models of spatial excitation propagation (see figure 5). Thus, comprehending the ECG is now structured by a new metaphor (up & down signifies spatial spreading).
Limitations
Due to the research approach, all described learning ef- fects are related to the specific situation within the teaching experiment. The learning effects can be ex- plained epistemologically. However, all results have to be seen as descriptive data as they cannot be traced back causally to the instructional task. Predictions on persisting memory performances in regard to the learning effects cannot be done, either.
The study aims at describing possible conceptual changes which may occur by interacting with the instructional task.
But again, it has to be taken into account that any results about the instructional effect cannot be generalized beyond the sample.
The results also demonstrate cases of conceptual mis- guiding when themore is upmetaphor is continuously used to comprehend the abstract vector loop. In one case, for instance, the vector loop is understood as the real path of excitation propagation within the actual myocar- dium. Conceptual metaphor theory can again explain these findings: Our experience of physical objects and substances provides a bold basis for understanding ab- stract concepts. Thus, we may think about abstract con- cepts by employing conceptual structures acquired in our experience with the physical and social environment. So- called “ontological metaphors” [10] structure our compre- hension of things without clearly distinctive properties.
Hence, the abstract vector loop can be imagined as the real path of excitation through the human heart. An ab- stract process (cardiac excitation) is hereby comprehen- ded as a quasi-material entity moving within a conceivable and real room (the heart). Such kind of conception cer- tainly has to be defined as an obstacle to gaining suitable ideas of cardiologic phenomena. Moreover, we have to assume that such a misconception makes the understand- ing of pathologic ECGs more difficult.
Misconceptions are suitable to be used within medical education as contrasting ideas in lectures or tutorials.
Again, these findings about possible misconceptions resulting from the teaching experiment are limited to the examined sample. They can neither be generalized, nor make claims of identifying possible other kinds of miscon- ceptions.
7. Conclusions
This study aims at analyzing medical students’ concep- tions of the ECG. Misconceptions could be identified and traced back to four metaphorical concepts. Considering
Figure 5: Interacting with the instructional task generates a new conceptual metaphor [2]. As the analysis of the results of the conducted teaching experiments reveal, some of the students are able to explain the ECG as a two-dimensional representation
of spatial excitation propagation.
these misconceptions can contribute to taking action in order to align preclinical cardiologic education. For in- stance, these misconceptions are suitable to initiate cognitive conflicts by comparing them with appropriate concepts [18] within lectures or tutorials.
The theory-guided instructional task, which focuses on the relationship between the vector loop and the ECG, constitutes an approach to directly improve medical stu- dents’ comprehension of the spatial and temporal aspects of cardiac excitation represented in the ECG. As a con- sequence, the animation of the extended vector loop can be used as a helpful task to revise misconceptions. It can also be used in lectures during the preclinical education in order to prevent the arising of such misconceptions.
The approach can be easily integrated within lectures and tutorials (students also could draw the sketches themselves).
Cases of conceptual misunderstandig, however, are also shown as results of the conducted teaching experiments.
Since students can understand both, ECG and vector loop, by using the more is up metaphor, this possible misconception could also be utilized as a contrasting approach [18] within the learning process.
Using a qualitative-explorative research design and espe- cially the conceptual metaphor theory have been benefi- cial in analyzing conceptions as well as misconceptions of the ECG. Thus, insights into hitherto unexplored aspects of teaching and learning cardiologic basics have been obtained.
Moreover, the results lead to further research questions.
It will be of interest, for example, if the described learning effects are lasting and, if so, how they are made to be lasting. Furthermore, the question is, whether they con- tribute to the understanding of different kinds of patholo- gical ECGs.
With regard to analyzing potential obstacles in the dia- gnosis of cardiac diseases, our research approach could also be used to examine (mis)conceptions of pathological ECGs. It could also be of interest, if modulated versions
of the extended vector loop acted as instructional tasks to help students interpret pathological ECGs (e.g. bundle branch heart blocks with deviations in the QRS-complex).
Finally, these findings can form a data basis for further quantitative research (e.g. comparative studies) on the efficacy of the instructional task. Being aware of the identified conceptions and misconceptions could support researchers to develop tests of knowledge purposefully and, in consequence, to retest the qualitative findings in representative samples.
Acknowledgements
Special thanks go to Theresa Sethmann and Anja Schirmer for supporting part of this research work and also to Prof. Dr. Harald Gropengießer for scholarly ex- change. Moreover, I thank Prof. Dr. Tobias Raupach and the study group for medical education research at Georg- August-University (Göttingen) for their feedback. Finally, I give thanks to the reviewers for their constructive sug- gestions on the manuscript.
Audiovisual material
Audiovisual material for this article is available from the Dryad Digital Repository: [https://doi.org/10.5061/
dryad.f19p512] [19]
Competing interests
The author declares that he has no competing interests.
Attachments
Available from
https://www.egms.de/en/journals/zma/2019-36/zma001280.shtml 1. Attachment_1.pdf (95 KB)
Attachment 1
References
1. Silbernagel S, Despopoulos A. Taschenatlas der Physiologie.
Stuttgart, New York: Thieme; 2003.
2. Dong R, Yang X, Xing B, Zou Z, Zheng Z, Xie1 X, Zhu1 J, Chen1 L, Zhou1 H. Use of concept maps to promote electrocardiogram diagnosis learning in undergraduate medical students. Int J Clin Exp Med. 2015;8(5):7794-7801.
3. Mahler SA, Wolcott CJ, Swoboda TK, Wang H, Arnold TC.
Techniques for teaching electrocardiogram interpretation: Self- directed learning is less effective than a workshop or lecture.
Med Educ. 2011;45(4):347-353. DOI: 10.1111/j.1365- 2923.2010.03891.x
4. Goy JJ, Schlaepfer J, Stauffer JC. Competency in interpretation of the 12-lead electrocardiogram among swiss doctors. Swiss Med Week. 2013;143(May):8-10. DOI:
10.4414/smw.2013.13806
5. Jablonover RS, Lundberg E, Zhang Y, Stagnaro-Green A.
Competency in Electrocardiogram Interpretation Among Graduating Medical Students, Teaching and Learning in Medicine.
Teach Learn Med. 2014;26(3):279-284. DOI:
10.1080/10401334.2014.918882
6. Raupach T, Harendza S, Anders S, Schuelper N, Brown J. How can we improve teaching of ECG interpretation skills? Findings from a prospective randomised trial. J Electrocard. 2016;49(1):7- 12. DOI: 10.1016/j.jelectrocard.2015.10.004
7. Niebert K, Gropengießer H. Leitfadengestützte Interviews. In:
Krüger D, Parchmann I, Schecker H, editors. Methoden der Naturwissenschaftsdidaktik. Berlin, Heidelberg: Springer-Verlag;
2014. p.121-132. DOI: 10.1007/978-3-642-37827-0_10 8. Mayring P. Qualitative Content Analysis. For Qual Soc Res.
2014;1(2):e20. DOI: 10.17169/fqs-1.2.1089
9. Steffe LP, Thompson PW. Teaching Experiment Methodology:
Underlying Principles and Essential Elements. In: Lesh R, Kelly AE, editors. Research design in mathematics and science education. Hillsdale, NJ: Erlbaum; 2000. p.267-307.
10. Lakoff G, Johnson M. Metaphors We Live By. Chicago, London:
The University of Chicago Press; 1980.
11. Lakoff G, Nunez RE. Where Mathematics Comes From. New York:
Basic Books; 2000.
12. Lakoff G. Mapping the brain's metaphor circuitry: metaphorical thought in everyday reason. Front Hum Neurosci. 2014;8:958.
DOI: 10.3389/fnhum.2014.00958
13. Schmitt R. Systematic Metaphor Analysis as a Method of Qualitative Research. Qual Report. 2005;10(2):358-394.
14. Lakoff G. Women, Fire, and Dangerous Things. What Categories Reveal about the Mind. Chicago: Univ. of Chicago Press; 1987.
DOI: 10.7208/chicago/9780226471013.001.0001
15. Duit R, Gropengießer H, Kattmann U, Komorek M, Parchmann I. The Model of Educational Reconstruction - a Framework for Improving Teaching and Learning Science. In: Jorde D, Dillon J, editors. Science Education Research and Practice in Europe.
Cultural Perspectives in Science Education. Vol.5. Rotterdam:
SensePublishers; 2012.
16. Ericsson KA, Simon HA. How to Study Thinking in Everyday Life:
Contrasting Think-Aloud Protocols with Descriptions and Explanations of Thinking. Mind Cult Act. 1998;5(3):178-186.
DOI: 10.1207/s15327884mca0503_3
17. Steinke, I. Quality Criteria in Qualitative Research. In: Flick U, von Kardorff E, Steinke I, editors. A Companion to Qualitative Research. London, Thousand Oaks, New Delphi: Sage Publications; 2004. p.184-190.
18. Scott R, Asoko MH, Driver R. Teaching for conceptual change: a review of strategies. In: Duit R, Goldger F, Niedderer H, editors.
The proceedings of the international workshop on research in physics education: Theoretical issues and empirical studies (Bremen, Germany, March 5-8, 1991). Kiel: IPN; 1992. p.310- 329.
19. Trauschke M. Data from: A qualitative study on the development and rectification of advanced medical students' misconceptions about the physiological electrocardiogram (ECG). Dryad Digital Repository. 2019. DOI: 10.5061/dryad.f19p512
20. Boroditsky L. Metaphoric structuring: Understanding time through spatial metaphors. Cognition. 2000;75(1):1-28. DOI:
10.1016/S0010-0277(99)00073-6
Corresponding author:
Mathias Trauschke
Leibniz University of Hannover, Institute for Science Education Research (Biology Education), Am Kleinen Felde 30, D-30167 Hannover, Germany, Phone: +49 (0)162/1006963
trauschke@idn.uni-hannover.de
Please cite as
Trauschke M. A qualitative study on the development and rectification of advanced medical students’ misconceptions about the physiological electrocardiogram (ECG). GMS J Med Educ. 2019;36(6):Doc72.
DOI: 10.3205/zma001280, URN: urn:nbn:de:0183-zma0012802
This article is freely available from
https://www.egms.de/en/journals/zma/2019-36/zma001280.shtml
Received:2018-10-18 Revised:2019-07-15 Accepted:2019-08-13 Published:2019-11-15
Copyright
©2019 Trauschke. This is an Open Access article distributed under the terms of the Creative Commons Attribution 4.0 License. See license information at http://creativecommons.org/licenses/by/4.0/.
Eine qualitative Untersuchung zur Entstehung und
Korrektur von Fehlvorstellungen über das physiologische Elektrokardiogramm (EKG) bei Medizinstudierenden
höherer Semester
Zusammenfassung
Zielsetzung:In dieser qualitativ-explorativen Studie werden Vorstellungen von Studierenden im klinischen Studienabschnitt der Humanmedizin
Mathias Trauschke
1über das im präklinischen Studienabschnitt behandelte physiologische
1 Leibniz Universität Hannover, Institut für Didaktik der Elektrokardiogramm (EKG) erfasst und auf mögliche Fehlvorstellungen
untersucht. Ferner wird eine theoriegeleitet entwickelte Intervention
Naturwissenschaften (AG zur Verknüpfung von Kurvenverlauf und der dadurch repräsentierten Biologiedidaktik), Hannover,
Deutschland räumlichen Ausbreitung von Erregungsmustern (animierte Vektorschlei-
fe) erprobt.
Methodik:Im Zuge einer Lernpotenzialdiagnostik wurden Studierende einzeln mithilfe problemzentrierter, Leitfaden-gestützten Interviews befragt. Die entwickelte Intervention wurde mithilfe einzeln durchgeführ- ter Vermittlungsexperimente unter Nutzung von lautem Denken erprobt.
Die Datenauswertung erfolgte durch qualitative Inhaltsanalyse. Vorstel- lungen und die diesen zugrundeliegenden basalen Kognitionen wurden im Lichte der Conceptual Metaphor Theory analysiert.
Ergebnisse: Eine charakteristische Fehlinterpretation besteht darin, dass Probanden die räumlichen und zeitlichen Aspekte der Erregungs- ausbreitung nicht mit dem Verlauf des EKG verknüpfen und im Kurven- verlauf lediglich eine Zu- und Abnahme von elektrischer Aktivität im Myokard erkennen. Wie die Auswertung der Vermittlungsexperimente zeigt, kann eine theoriegeleitet entwickelte Intervention zum einem Umlernen führen. Anhand von rekonstruierten Metaphernkonzepten wird dieser Verstehensprozess exemplarisch illustriert und aufgezeigt, wie Studierende im Verlauf der Interviews ein EKG als zweidimensionale Repräsentation der räumlichen Erregungsausbreitung im Myokard an- gemessen erläutern können.
Schlussfolgerung:Durch das Erfassen typischer Fehlvorstellungen zum physiologischen Elektrokardiogramm und das Aufzeigen lernförderlicher Interventionen liefert die Studie einen Beitrag zum verstehenden Lernen, der in der physiologischen Grundausbildung von Medizinstudierenden genutzt werden kann.
Schlüsselwörter:EKG (Fehlvorstellungen), Modell der Didaktischen Rekonstruktion, Conceptual Metaphor Theory
1. Einleitung
Im EKG aufgezeichnete Potenzialdifferenzen rühren von der Herzerregung. Das EKG kann über Lage und Frequenz des Herzen sowie über Rhythmus und räumliche Ausbrei- tung von Erregung Auskunft geben. Richtung und Größe der Potenziale variieren im Verlauf der Erregungsausbrei- tung, was durch Vektoren dargestellt werden kann. Der aus den einzelnen Vektoren gebildete Summenvektor beschreibt im Verlauf der Erregung eine typische schlei-
fenförmige Bahn. Der zeitliche Verlauf des Summenvek- tors lässt sich im EKG, projiziert auf eine jeweilige Ablei- tungsebene, sichtbar machen [1]. Die Befähigung zum Auswerten von Elektrokardiogrammen gehört zu den zentralen Kompetenzen, welche Studierende der Human- wie auch Veterinärmedizin erwerben sollen. Gleichwohl stellt das Erlernen dieser Kompetenz eine besondere Herausforderung dar [2]. Eine Reihe von Untersuchungen zum Vermitteln und Erlernen von Kenntnissen und Fähig- keiten zur EKG-Interpretation gehören daher zum Gegen- stand medizindidaktischer Forschung [2], [3], [4], [5], [6].
Die Ansätze rekurrieren vor allem auf die Interpretations-
kompetenz pathologischer EKG im klinischen Studienab- schnitt. Weniger berücksichtigt bleiben basale Vorstellun- gen von Medizinstudierenden über die Grundlagen des physiologischen EKG. In einer qualitativen Studie wurde daher das Verständnis Studierender über Elektrokardio- gramme erfasst, um mögliche Lernschwierigkeiten iden- tifizieren und ein theoriegeleitet entwickeltes Lernangebot erproben zu können. Dazu wurden Vorstellungen von Studierenden der Humanmedizin über das physiologische EKG mithilfe Leitfaden-gestützter Interviews [7] und qualitativer Inhaltsanalyse [8] erfasst. Eine entwickelte Intervention (Videoanimation siehe Anhang 1) wurde in Vermittlungsexperimenten [9] erprobt.
Abstrakte Sachverhalte – wie etwa der im EKG repräsen- tierte Aspekt variierender Potenzialrichtungen [1] – wer- den kognitiv durch konzeptbildende Metaphern [10] er- schlossen. Die in der naturwissenschaftsdidaktischen Vorstellungsforschung genutzte Conceptual Metaphor Theory[11], [12] diente daher als Analyseinstrument, um Denkprozesse zu modellieren. In Interviews und Vermitt- lungsexperimenten rekonstruierte Vorstellungen wurden folglich mittels systematischer Metaphernanalyse [13]
interpretiert. Der Aufsatz beschreibt typische Fehlvorstel- lungen über das physiologische EKG und identifiziert einen möglichen Lernweg zum Erlangen fachlich ange- messener Vorstellungen über die im EKG abstrakt abge- bildete Information über Erregungsrichtungen.
2. Theoretischer Rahmen
Dieser Forschungsansatz basiert auf dem holistischen Ansatz der Kognitionslinguistik, dass Syntax und Semantik eng verknüpft sind. Sprachliche Phänomene sind daher von analytischem Interesse, um konzeptuelle Strukturen zu modellieren [14]. Um das Verstehen (und Nicht-Verste- hen) eines physiologischen Elektrokardiogramms zu analysieren oder Vorhersagen über lernförderliche Inter- ventionen treffen zu können, wird die Conceptual Meta- phor Theory [10], [11], [12] genutzt. Nach dem Ansatz der verkörperten Kognition (Embodied Cognition) generie- ren wir durch Interaktion mit unserer physischen und sozialen Umwelt verkörperte Vorstellungen, die den Kern unserer verfügbaren Kognitionen ausmachen. Durch un- willentliche Projektion solcher „cognitive primitives“ [11]
können auch abstrakte Sachverhalte mental repräsentiert werden. Verkörperte, zur kognitiven Erschließung abstrak- ter Sachverhalte genutzte Vorstellungen werden dabei als konzeptbildende Metaphern bezeichnet. Dieser kogni- tionslinguistische Metaphernbegriff ist vom philosophi- schen und alltäglichen Verständnis einer Metapher klar abzugrenzen, da Metaphern hier traditionell als bewusst genutzte Ausdrücke bildhaft-poetischer Sprache bezeich- net werden [14].
Unter anderem strukturieren „Orientierungsmetaphern“
[10] unser Denken, wie am Beispiel derMore Is Up-Meta- pher [10] deutlich wird. Die erfahrungsbasierte Vorstel- lung von Mehr Ist Oben kann das Verständnis anderer, abstrakt zugänglicher Sachverhalte strukturieren. Im
Hinblick auf Vorstellungen über das Elektrokardiogramm liegt die theoriegeleitete Vermutung nahe, dass Studie- rende den Kurvenverlauf durch diese Orientierungsmeta- pher erschließen (siehe Abbildung 1).
3. Forschungsfragen
Mit dieser Studie wird beabsichtigt, Vorstellungen über das physiologische EKG von Studierenden der Humanme- dizin im klinischen Studienabschnitt zu erfassen und bestehende Fehlvorstellungen zu analysieren. Eine entwi- ckelte Vermittlungsintervention soll zudem explorativ getestet werden. Folgenden Forschungsfragen sind von Interesse:
1. Welche Vorstellungen konstruieren Studierende der Humanmedizin zum physiologischen EKG und welche konzeptbildenden Metaphern strukturieren dieses Verständnis?
2. Welche Vorstellungen zum physiologischen EKG konstruieren Studierende der Humanmedizin in der Interaktion mit einer theoriegeleitet entwickelten In- tervention?
4. Forschungsdesign und Methoden
Unter Vorstellungen werden aus Äußerungen von Perso- nen rekonstruierte kognitive Konstrukte verstanden, welche Individuen kontextspezifisch zugeschrieben wer- den können. Ein solches Rekonstruieren subjektiver Be- deutungswelten legt einen qualitativ-explorativen For- schungsansatz nahe. Als Forschungsrahmen diente das in der fachdidaktischen Vorstellungsforschung etablierte Modell der Didaktischen Rekonstruktion [15]. Dabei werden zunächst fachspezifische Vorstellungen Lernender vor dem Hintergrund möglicher Verständnisschwierigkei- ten analysiert (Lernpotenzialdiagnose). Zudem werden die in Originalpublikationen und/oder akademischen Lehrbüchern repräsentierten fachwissenschaftlichen Vorstellungen aus Vermittlungsabsicht untersucht (fach- liche Klärung), um dann aus einem wechselseitigen Ver- gleich Lernangebote zu entwickeln und explorativ zu er- proben (Didaktische Strukturierung).
Das methodische Setting orientierte sich dabei am Ver- mittlungsexperiment [9]. In Einzelsitzungen wurden Vor- stellungen Studierender der Humanmedizin (N=10, 5.- 10. Semester) zum physiologischen EKG vor, während und nach der Interaktion mit der entwickelten Intervention (vgl. Anhang 1) erhoben (siehe Abbildung 2). Um etwaige Fehlvorstellungen erfassen zu können, wurden Probanden aus dem klinischen Abschnitt ausgewählt, da sie bereits Lehrveranstaltungen zum physiologischen EKG belegt haben. Da (Fehl)vorstellungen auf der Basis konzeptbil- dender Metaphern rekonstruiert werden, ist eine Zuord- nung der Testpersonen zu bestimmten Semestern nicht notwendig, denn über erfahrungsbasierte Kognitionen verstandene Sachverhalte gelten innerhalb gleicher Kul- turkreise als beständig [11].
Abbildung 1: Zusammenhang von verkörperten Vorstellungen (Embodied Cognition) und metaphorischem Verstehen abstrakter Sachverhalte. Die erfahrungsbasierte VorstellungMehr Ist Oben wird unwillentlich in anderen, abstrakten Zusammenhängen
aktiviert, um Vorstellungen zu konstruieren. Dieser Studie liegt die Vermutung zugrunde, dass Studierende im Kurvenverlauf eine Zu- bzw. Abnahme von Erregung identifizieren.
Abbildung 2: Wechselseitig Vorstellungen erfassen und Interventionen erproben – der Ablauf der in Einzelsitzungen durchgeführten Vermittlungsexperimente im Überblick.
In der Interventionsphase wurden die Probanden zu lau- tem Denken [16] aufgefordert, um einen möglichst lückenlosen analytischen Zugriff auf die individuellen Denkprozesse bei der Auseinandersetzung mit der Anima- tion zu gewährleisten. In der Absicht, individuelle prä- Konzepte sowie mögliche Lerneffekte rekonstruieren zu können, wurden die Probanden vor und nach der Inter- vention auf Basis von Leitfaden-gestützten Interviews [7]
zum Elektrokardiogramm befragt. Die Dauer der einzelnen Sitzungen betrug 45 bis 60 Minuten. Alle videografierten Aussagen wurden mithilfe der qualitativen Inhaltsanalyse
[8] und der systematischen Metaphernanalyse [13] aus- gewertet. Um die Intersubjektivität der qualitativen For- schungsergebnisse und deren Interpretation zu gewähr- leisten, erfolgte die gesamte Datenauswertung durch konsensuelle und argumentative Validierung [17] in ei- nem zweistufigen Verfahren: Die einzelnen Transkripte wurden zunächst durch den Autor ausgewertet, um die konzeptbildenden Metaphern zu identifizieren. Eine Mit- arbeiterin der Arbeitsgruppe führte auf Basis des dabei entstandenen Kategoriensystems eine erneute Analyse der Transkripte durch. Der Konsensbildung hinsichtlich
der rekonstruierten Metaphern im Forschungsteam folgte die argumentative Validierung der Daten in der Arbeits- gruppe Biologiedidaktik des Institutes für Didaktik der Naturwissenschaften an der Leibniz Universität Hannover.
Alle Probanden wurden detailliert über das methodische Vorgehen informiert und haben ihr Einverständnis erklärt.
Die Daten wurden anonymisiert, eine Zuordnung der Zita- te zu entsprechenden Personen aufgrund von Pseudony- men nicht möglich.
5. Ergebnisse
5.1 Fehlvorstellungen über das physiologische EKG
Bei zwei Probanden konnten kontinuierlich fachlich kor- rekte Vorstellungen identifiziert werden. Auf Äußerungen dieser Studierenden wird im weiteren Verlauf nicht einge- gangen. Bei acht Versuchspersonen konnten fachlich fehlleitende Vorstellungen identifiziert werden, die nach- folgend kategorial geordnet dargestellt sind. Aufgeführt und expliziert werden exemplarische Zitate der im Zuge der qualitativen Inhaltsanalyse erhaltenen geordneten Aussagen. Die daraus abgeleiteten Metaphernkonzepte entsprechen der Einzelstrukturierung am Ende der Inhalts- analyse.
5.1.1 Metaphernkonzept I: Je höher die Kurve, desto mehr Erregung [6]
Exemplarische Äußerungen (Ankerbeispiele) Karla
(27-31):„[Die Erregung im EKG ist]dort[am größten], wo die Zacke am höchsten ist.“
(36-41):„Ich würde[die Linien mit]Vorhoferregung und Rückerregung des Vorhofs [beschriften]. „Die Vorhöfe sind hier vollständig erregt, würde ich sagen(markiert das Maximum der P-Welle).“
Justus
(147-158):„Das ist die P-Welle. Das andere ist auch die P-Welle – der auf- und absteigende Anteil der P-Welle.
Das ist dann der absteigende Anteil der P-Welle. Da das die Vorhoferregung ist, interpretiere ich das (...) als stei- gende und die abfallende Erregung der Vorhöfe.“
Explikation und Metaphernanalyse
Anstieg und Abfall der Kurvenabschnitte werden in sechs Fällen als Zu- und Abnahme von Erregung gedeutet.
Kurvenmaxima werden als Zeitpunkte größter Erregung begriffen. Die Bedeutung der abstrakten EKG-Kurve wird mental dabei durch die OrientierungsmetaphernMore Is Upbzw.Less Is Downrepräsentiert.
Diese Form der Interpretation eines physiologischen EKG ist fehlleitend, weil Kurvenmaxima (Hochpunkte von P- Welle oder R-Zacke) fehlerhaft als Zeitpunkt vollständiger Erregung von Vorhöfen beziehungsweise Kammern be- griffen werden.
Eine weitere didaktische Herausforderung zeigt sich darin, dass der grundlegende Zusammenhang zwischen
EKG-Kurve und räumlichem Verlauf von Erregungsaus- breitung nicht erkannt wird.
Einzelstrukturierung (Metaphernkonzept)
More Is UpI – je höher die Kurve, desto größer die Erre- gung.
5.1.2 Metaphernkonzept II: Je höher die Kurve, desto mehr Zellen sind erregt [3]
Exemplarische Äußerungen (Ankerbeispiele) Justus
(109-142):„Also ich würde hier[zeigt auf das Maximum der R-Zacke]sagen, dass die Erregung am größten ist.
(...) Es gibt ja verschiedene Phasen: Systole und Diastole.
Systole ist die Austreibungsphase, Diastole die Füllungs- phase und bei der Systole ist die Erregung vermutlich am größten, wenn der größtmögliche Anteil vom Herzmuskel- len (...) erregt ist und das ist am Hochpunkt kurz vor der Systole.“
Explikation und Metaphernanalyse
Justus stellt sich vor, dass der Peak der R-Zacke mit einer maximalen Anzahl erregter Herzzellen einhergeht. Auch hier ist das Verstehen durch die More Is Up-Metapher strukturiert. In dieser Ausprägung wird jedoch der Kurven- verlauf (hoch/runter) mit der Anzahl erregter Zellen (vie- le/wenig) verknüpft. Diese Vorstellung ist aus fachdidak- tischer Perspektive ebenfalls als Lernhindernis einzustu- fen, da sie fachlich fehlleitend ist: Die Anzahl der maximal depolarisierten Myokardzellen ist erst am Ende des QRS- Komplexes erreicht, nicht aber am Peak der R-Zacke.
Einzelstrukturierung (Metaphernkonzept)
More Is Up II – Je höher die Kurve, desto mehr Zellen sind erregt.
5.1.3 Metaphernkonzept III: Je höher die Kurve, desto stärker die Kontraktion [2]
Exemplarische Äußerungen (Ankerbeispiele) Lara
(54-62):„Dadurch, dass die verschiedenen Vektoren, die die elektrische Kontraktion oder die elektrische Erregung darstellen, addiert werden, ist natürlich da, wo der höchste Ausschlag ist, auch die stärkste Kontraktion. (...) Also hier ist oben an der R-Zacke auch die massentech- nisch höchste elektrische Kontraktion gerade vorhanden.“
Explikation und Metaphernanalyse
Laras Vorstellung ist ebenfalls durch die metaphorische Nutzung der More Is Up-Metapher gekennzeichnet. In diesem Falle wird nun der höchste Kurvenausschlag mit der höchsten Erregung und gleichsam der stärksten Kontraktion der Ventrikel verknüpft. Die Äußerungen verdeutlichen zudem, dass Erregung und Kontraktion für Lara gleichbedeutend sind. Sie spricht sogar von „elektri- scher Kontraktion“. Diese Vorstellung ist aus medizini- scher Perspektive insofern problematisch, weil die Aus- wertung von Elektrokardiogrammen in der Regel keine Hinweise auf die Kontraktilität des Herzen zulässt. Zudem ist die angenommene Proportionalität von Kurvenaus- schlag und Kontraktionsausprägung fachlich nicht korrekt.
Einzelstrukturierung (Metaphernkonzept)
More Is Up III – Je höher die Kurve, desto stärker die Kontraktion des Myokards.
5.1.4 Metaphernkonzept IV: Vektorgrößen repräsentieren Anzahl erregter Zellen [1]
Exemplarische Äußerungen (Ankerbeispiele) Nadja
(81-99):„Wenn ein paar[Zellen]erregt sind,[...]dann ist der Vektor relativ klein (...).“
(81-99): „Wenn wir über die Hälfte[der Zellen] erregt haben, (...) dann wird der Vektor wieder kleiner. Das ist der abfallende[Bereich der P-Welle].“
Explikation und Metaphernanalyse
Nadja bringt die Vektoren zur Sprache. Sie stellt sich al- lerdings vor, dass Zu- und Abnahme der Größe eines Di- polvektors gleichbedeutend mit Anstieg beziehungsweise Abnahme der EKG-Kurve ist. Das abstrakte Konstrukt summierter Dipolvektoren wird somit fachlich nicht ange- messen verstanden. Insbesondere kann Nadja im EKG den Zusammenhang mit der Vektorschleife nicht begrei- fen. Es fehlt die Vorstellung, dass Summationsvektoren während der Herzaktion Größe und Richtung ändern. Er- neut wird dieMore Is Up-Vorstellung metaphorisch ge- nutzt, um den abstrakten Sachverhalt kognitiv zu erschlie- ßen (→ kleiner werdender Vektor entspricht Kurvenab- fall). Der Richtungs-Aspekt des Erregungsverlaufes ist auch dieser Studentin nicht präsent.
Einzelstrukturierung (Metaphernkonzept)
More Is UpIV – Vektorgröße repräsentiert Anzahl erregter Zellen.
5.2 Vorstellungen zum Zusammenhang von animierter Vektorschleife und EKG
Die theoriegeleitet entwickelte Animation fokussierte auf die Vermittlung des Zusammenhanges von EKG und räumlicher Erregungsausbreitung im Myokard (siehe An- hang 1). Zwei Probanden konnten die Intention des Lernangebotes korrekt wiedergeben. Es handelte sich bei diesen Studierenden um die zwei Probanden, bei denen ausschließlich fachlich angemessene Vorstellun- gen zum physiologischen EKG identifiziert wurden (s. 5.1).
Deren Äußerungen werden nachfolgend nicht näher be- trachtet.
Der Fokus der Auswertung liegt auf der Darstellung des Musters eines erfassten Lerneffekts, welches bei fünf Probanden identifiziert werden konnte. Es wird hier an- hand eines Ankerbeispiels (Proband: Justus) dokumen- tiert.
Der Proband erläutert und versteht die EKG-Kurve zu- nächst durch Orientierungsmetaphern in Form der meta- phorischen Nutzung des More Is Up- bzw. Less Is Down-Konzepts. Anstieg und Abfall der Kurvenabschnitte werden als Zu- und Abnahme von Erregung gedeutet (vgl.
5.1.1 und 5.1.2).
In der Interaktion mit der Animation erkennt Justus, dass zwischen der EKG-Kurve und der sich im zeitlichen Verlauf
in die Länge gezogenen Vektorschleife ein konzeptioneller Zusammenhang besteht. Die durch die Animation aufge- löste semantische Verschmelzung der Vorstellungen über die Prozesse Zeit und räumliche Erregungsausbreitung kann explizit nachvollzogen werden.
(291-300): „Die Vektorschleife und die EKG-Kurve sind an sich dasselbe. Also ich betrachte die Erre- gungsschleife aus verschiedenen Blickwinkeln (...) [Ich] kann es einmal räumlich aus verschiedenen Blickwinkeln nachvollziehen und dadurch, dass ich es in die Länge ziehe, auch zeitlich.“
Justus bezeichnet Erregung nun als etwas „Örtliches“
und äußert eine Vorstellung dahingehend, dass die EKG- Kurve die räumliche Ausbreitung von Erregung im Herzen im zeitlichen Verlauf abbilde.
(333-347):„Wenn man das hier betrachtet, ist hier einmal die R- und die S-Zacke. Man sieht, wie die Er- regung einmal in die eine und dann in die entgegen[ge- setzte] Richtung läuft, weil es wieder Richtung Minus läuft, aber ist es schon etwas Örtliches. Dann sind die Kammern voll erregt.“
(348-355):„In der Steigung[der R-Zacke] –bezogen auf die Herzachse, die so verläuft – läuft die Erregung nach unten, also auf meinen Blickwinkel zu, auf mich zu und[beim sinkenden Bereich der P-Welle]läuft die Erregung wieder von mir weg.“
Der EKG-Verlauf wird nun nicht mehr in derUp-Is-More-Me- taphorik fehlgedeutet. Das Verständnis wird über ein neues Metaphernkonzept strukturiert: Die vertikale Aus- richtung des Kurvenverlaufes wird als Repräsentation für einen räumlich verlaufenden Vorgang erfasst (Metaphern- konzept:Up & Down Signifies Spatial Spreading). Im Zuge dessen erkennt er sogar seine fachlich fehlerhafte Be- trachtung zur Spitze der R-Zacke und entwickelt eine Idee davon, dass ein Elektrokardiogramm Aussagen über räumliche Erregungsmuster im Herzen zulässt.
(356-378): „Ach stimmt, ich hatte gesagt, auf der hohen Zacke ist die Erregung am meisten. Also theo- retisch wird sie nicht weniger als solches, sie verän- dert sich nur räumlich von mir. (...) Anstieg ist aber, [um]das EKG[zu]betrachten, nicht so zielführend, weil beim EKG primär die Höhen der Zacken nicht so wichtig sind, sondern der Betrachtungswinkel: wo läuft die Erregung eigentlich lang. Wenn ich es am Anfang betrachten will, ist es eher ein Richtungsvek- tor,[er]gibt also eine Richtung an und nichts Quanti- tatives wie Millivolt, obwohl wir natürlich in Millivolt messen, aber für die Betrachtung des EKGs – rein didaktisch – ist es primär wichtig zu verstehen, in welche Richtung das verläuft, wenn ich hier einen Anstieg in dieser zweidimensionalen Grafik habe.“
Abschließend soll auf die übrigen drei Probanden einge- gangen werden (vgl. Abbildung 3). Norbert erläutert be- reits in der Anfangsphase sachlich korrekt, dass ein EKG die räumliche Ausbreitung von Erregung abbildet. Anstieg und Abfall der Kurve werden als Erregungsrichtung inter- pretiert (Metaphernkonzept:Up & Down Signifies Spatial Spreading).
Abbildung 3: Konzeptbildende Metaphern beim Verstehen und Missverstehen des physiologischen EKG im Rahmen des Vermittlungsexperiments.
(38-41):„Das[Ansteigen im EKG]sagt etwas über die Erregungsausbildung aus, also die elektrische Aktivi- tät, die sich in eine Richtung der Elektrode bewegt [und]von der anderen weg, je nachdem welche Ablei- tung wir abgebildet haben.“
Er konstruiert aber auch fehlleitende Vorstellungen zur EKG-Kurve, die auf das More Is Up- bzw. Less-Is- Down-Konzept zurückzuführen sind.
(26-55): „Dann heben wir uns wieder auf die Aus- gangshöhe an und beenden das Ganze mit einem etwas größerem Hügel als dem ersten der P-Welle.
Dann laufen wir auf der normalen Strecke aus. (...) Prinzipiell ist die Erregung, die wir abgebildet haben, an der Spitze des QRS-Komplexes am größten, also an der R-Zacke.“
Auch nach der Intervention zeigt sich diesbezüglich ein hybrides Denkgebäude. Es werden weiterhin Fehlvorstel- lungen konstruiert, die sich auf der beschriebenen Orien- tierungsmetapher basieren (Metaphernkonzept II: Je hö- her die Kurve, desto mehr Zellen sind erregt). Gleichwohl äußert Norbert eine Vorstellung darüber, dass im EKG Erregungsrichtungen repräsentiert werden.
(307-321): „Beim Sinken der P-Welle sind weniger Zellen im Vorhof neu erregt als beim Anstieg oder am höchsten Punkt. Also da werden weniger Zellen neu erregt als am höchsten Punkt der P-Welle. [Am höchsten Punkt der P-Welle]sind gerade zu diesem Zeitpunkt am meisten Zellen im Vorhof erregt.“
(391-407): „Die Hauptaussage aus einem EKG ist:
Das EKG zeigt die elektrische Erregungsausbreitung des Herzens in unterschiedlichen Richtungen.“
Die animierten Vektorschleifen kann Norbert nach eigener Bekundung nicht umgehend verstehen. Nach kurzer Überlegung bringt er jedoch die auseinandergezogene Vektorschleife mit den entsprechenden EKG-Abschnitten korrekt zusammen.
(163-190): „Jetzt ist es verstanden,[es wurde] erst statisch gezeichnet. (...) Der erste kleine Kreis ist der Teil, der zweite große Kreis ist der Teil und der kleine
Kreis ist dann wieder der Teil (zeigt nacheinander auf P-Welle, QRS-Komplex und T-Welle).[Der aufsteigende Teil der R-Zacke]müsste die große Kurve[sein].“
Die eigentliche Intention der Intervention erfasst Norbert nicht, da er keinen Zusammenhang zur Animation und der im EKG repräsentierten Richtung von Erregungsaus- breitung bemerkt.
Bei Laura konnten im ersten Teil des Vermittlungsexperi- ments Fehlvorstellungen identifiziert werden (Metaphern- konzept: Je höher die Kurve, desto mehr Zellen sind er- regt). Auch nach der Interaktion mit Lernangebot finden sich diese Vorstellungen. Hervorgehoben werden soll hier die Fehlvorstellung, die sich überdies aus der Interaktion mit dem Lernangebot ergibt:
(590-645):„[Die Vektorschleife]geht nach links rüber.
Das liegt daran, dass der linke Ventrikel viel dicker ist als der rechte Ventrikel und viel mehr Muskelzellen aufweist, sodass die Schleife dann in die Richtung gebogen ist und nicht z.B. wieder gerade hochläuft.“
(648-669):„Auch wenn ein paar nach hier gehen, die allermeisten gehen nach hier und deswegen läuft es hier weiter lang, also erst im Septum, dann geht es an die Rückseite, in den Kammern läuft das Signal wieder hoch. Dann sind wir wieder auf der Höhe vom AV-Knoten.“
Die Probandin scheint sich vorzustellen, dass die Vektor- schleife die sich im Herzgewebe auf- und abwärts bewe- gende Erregung abbildet. DieMore Is Up-Metapher wird also auch für das Verständnis der abstrakten Vektorschlei- fe genutzt. Das Lernangebot führt in diesem Fall zu einer fehlleitenden Vorstellung, weil das abstrakte Konstrukt der Vektorschleife nicht sachdienlich begriffen werden kann.
Die Äußerungen von Maja zeigen, dass sie die Phasen des EKG korrekt benennen kann. Es gibt aufgrund der Datenlage aber keine Hinweise darauf, ob sie eine Vor- stellung von der im EKG abgebildeten räumlichen Erre- gungsausbreitung hat. Sie konstruiert jedoch auch fach-
![Figure 5: Interacting with the instructional task generates a new conceptual metaphor [2]](https://thumb-eu.123doks.com/thumbv2/1library_info/4871829.1632693/8.892.188.696.110.394/figure-interacting-instructional-task-generates-new-conceptual-metaphor.webp)