2010 Annual Report
Economic2010_260S_innen.indd 1 30.08.2010 12:34:16 Uhr
Economic Freedom of the World
2010 Annual Report
James Gwartney Joshua Hall Robert Lawson
Florida State University Beloit College Auburn University
with
Christopher J. Coyne John W. Dawson
George Mason University Appalachian State University
Horst Feldmann John Levendis
University of Bath Loyola University New Orleans
Russell S. Sobel Edward Peter Stringham
West Virginia University Fayetteville State University
2010
Economic2010_260S_innen.indd 3 30.08.2010 12:34:16 Uhr
Table of Contents
Executive Summary / v
Chapter 1 Economic Freedom of the World, 2008 / 1 Chapter 2 Country Data Tables / 21
Chapter 3 How Are Institutions Related? / 163 by Christopher J. Coyne and Russell S. Sobel
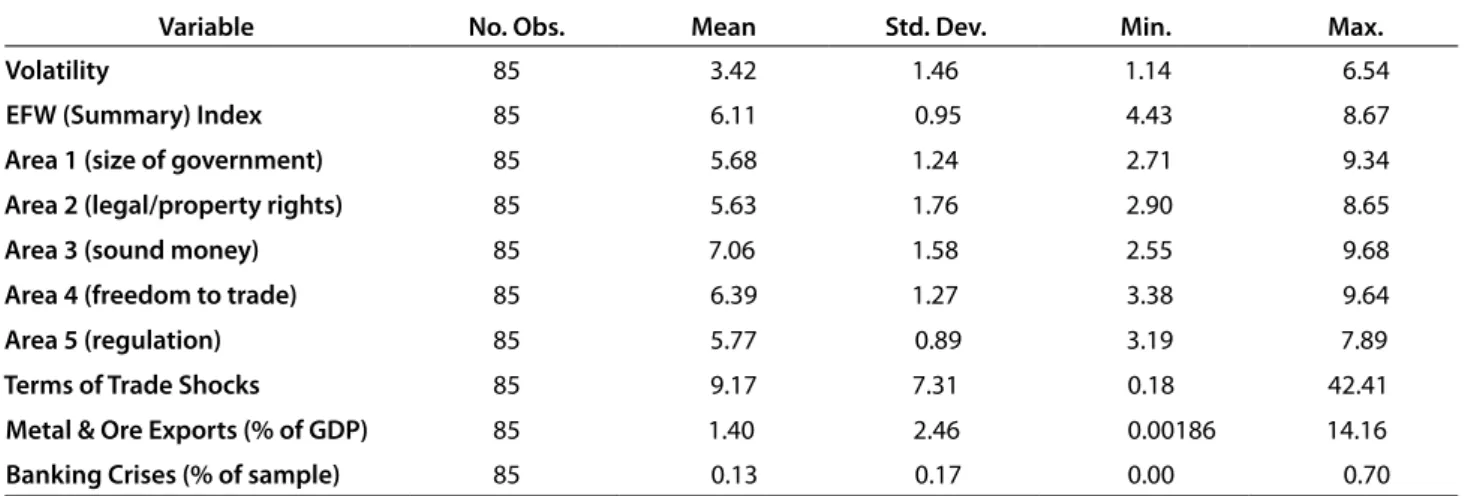
Chapter 4 Macroeconomic Volatility and Economic Freedom: A Preliminary Analysis / 175 by John W. Dawson
Chapter 5 Economic Freedom and Unemployment / 187 by Horst Feldmann
Chapter 6 The Relationship between Economic Freedom and Homicide / 203 by Edward Peter Stringham and John Levendis
Appendix Explanatory Notes and Data Sources / 219
Acknowledgments / 231 About the Authors / 232 About the Contributors / 233
About the Members of the Economic Freedom Network / 235
Economic2010_260S_innen.indd 5 30.08.2010 12:34:17 Uhr
Executive Summary
Economic Freedom of the World
The index published in Economic Freedom of the World measures the degree to which the policies and institutions of countries are supportive of economic freedom. The cornerstones of economic freedom are personal choice, voluntary exchange, freedom to compete, and security of privately owned property. Forty-two data points are used to construct a summary index and to measure the degree of economic freedom in five broad areas:
Size of Government: Expenditures, Taxes, and Enterprises;
Legal Structure and Security of Property Rights;
Access to Sound Money;
Freedom to Trade Internationally;
Regulation of Credit, Labor, and Business.
Economic freedom has suffered its first setback in decades
t ͳFDIBJOMJOLFETVNNBSZJOEFY FYIJCJU˞ˡQFSNJUTDPNQBSJTPOTPWFSUJNFͳFBWFSBHFFDPOPNJD freedom score rose from . (out of ) in to . in , but fell back to . in , the most recent year for which data are available. This is the first retreat for global economic freedom in decades.
(See chapter for a discussion.)
t *OUIJTZFBSTJOEFY)POH,POHSFUBJOTUIFIJHIFTUSBUJOHGPSFDPOPNJDGSFFEPN˦˝ˢPVUPG˞˝ͳF other top nations are: Singapore (.), New Zealand (.), Switzerland (.), Chile (.), United 4UBUFT ˤ˦ˣ$BOBEB ˤ˦ˢ"VTUSBMJB ˤ˦˝.BVSJUJVT ˤ˥˟BOEUIF6OJUFE,JOHEPN ˤ˥˞
t ͳFSBOLJOHT BOETDPSFTPGPUIFSMBSHFFDPOPNJFTBSF(FSNBOZ˟ˡ ˤˡˣ+BQBO˟ˡ ˤˡˣ'SBODFˠˢ ˤˠ˟
Italy (.), Mexico (.), Russia (.), China (.), India (.), and Brazil (.).
t ͳFCPUUPNUFOOBUJPOTBSF;JNCBCXF ˠˢˤ.ZBONBS ˠ˥˞"OHPMB ˠ˥˦7FOF[VFMB ˡˠˠ$POHP Republic of (.), Congo, Democratic Republic (.), Central African Republic (.), Guinea-Bissau (.), Burundi (.), and Algeria (.).
Nations that are economically free out-perform non-free nations in indicators of well-being
t /BUJPOTJOUIFUPQRVBSUJMFPGFDPOPNJDGSFFEPNIBEBOBWFSBHFQFSDBQJUB(%1PGˠ˟ˤˡˡJO˟˝˝ˤDPN- QBSFEUPˠ˥ˢ˥GPSUIPTFOBUJPOTJOUIFCPUUPNRVBSUJMFJODPOTUBOU˟˝˝ˢJOUFSOBUJPOBMEPMMBST FYI˞ˣ t *OUIFNPTUGSFFRVBSUJMFUIFBWFSBHFJODPNFPGUIFQPPSFTU˞˝PGUIFQPQVMBUJPOXBT˥ˡˤˡDPN-
QBSFEUP˦˞˝GPSUIPTFJOUIFMFBTUGSFFRVBSUJMFJODPOTUBOU˟˝˝ˢJOUFSOBUJPOBMEPMMBST FYI˞˦
*OUFSFTUJOHMZUIFBWFSBHFJODPNFPGUIFQPPSFTU˞˝JOUIFNPTUFDPOPNJDBMMZGSFFOBUJPOTJTNPSF than double the overall average income in the least free nations.
Economic2010_260S_innen.indd 7 30.08.2010 12:34:18 Uhr
t -JGFFYQFDUBODZJTˤ˦ˠZFBSTJOUIFNPTUGSFFRVBSUJMFCVUˢ˦˦ZFBSTJOUIFMFBTUGSFFRVBSUJMF FYI˞˞˝
t 1FPQMFJOOBUJPOTJOUIFNPTUGSFFRVBSUJMFSFQPSUBMJGFTBUJTGBDUJPOPGˤˢPVUPG˞˝XIJMFUIPTFJOUIF least-free quartile report a life satisfaction of . (exh. .).
t /BUJPOTJOUIFNPTUGSFFRVBSUJMFIBWFBOBWFSBHFTDPSFPGˤˡGPSDPSSVQUJPOPOBTDBMFPG˞˝XIJMF those in the lest-free quartile have an average score of . (exh. .).
t /BUJPOTJOUIFUPQRVBSUJMFIBWFBOBWFSBHFTDPSFPG˞ˣGPSQPMJUJDBMSJHIUTBOEDJWJMGSFFEPNTPOBTDBMF of to , where marks the highest level, while those in the bottom quartile have an average score of
. (exh. .).
Chapter 1: Economic Freedom of the World, 2008
The principal authors of the report, James Gwartney (Florida State University), Robert Lawson (Auburn University), and Joshua Hall (Beloit College), review the causes of the financial crisis and the recession. They also discuss the policy responses and the political processes out of which those responses grew, and how these processes may favor govern- ment intervention and a reduction in economic freedom, which perversely is likely to extend the recession. They warn that this path over the longer term would lead to loss of economic growth and vibrancy. This highlights the importance of an objective economic freedom measure to bring accountability to the debate. The authors also review the history of the economic freedom project and describe the construction of the index.
Chapter 2: Country Data Tables
Detailed historical information is provided for each of the countries and territories in the index.
Chapter 3: How Are Institutions Related?
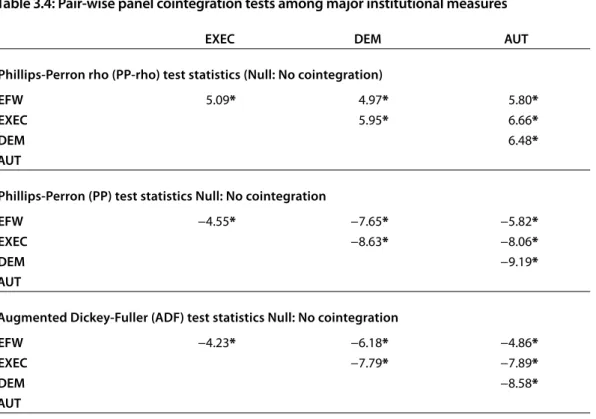
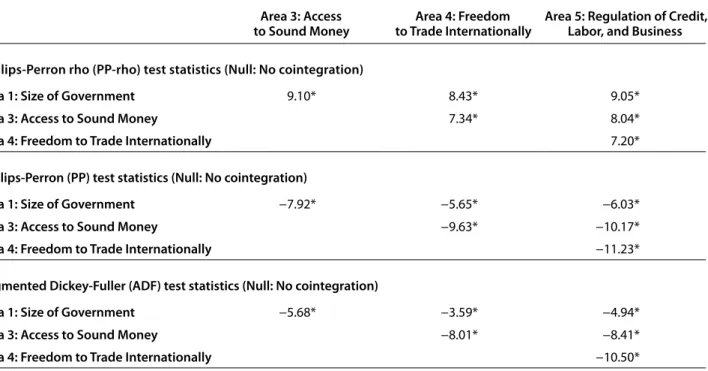
Christopher Coyne (George Mason University) and Russell Sobel (West Virginia University) analyze the nature of in- stitutional reform using data on different measures of each country’s many economic and political institutions. They ask both whether some institutions are easier to permanently change than others, and whether sets of institutions must be reformed simultaneously for the changes to become permanent. The main results are: () that most formal, economic institutions (e.g., tax and regulatory structures) can be permanently reformed but that legal and rights- based informal institutions (e.g., civil rights or Area : Legal Structure and Security of Property Rights) tend to resist permanent change; and () that economic institutions are cointegrated and therefore must move together to obtain permanent change—some institutions simply cannot be changed in isolation. In terms of policy, this implies that over the long term, reforms to one set of institutions are more likely to become permanent if reforms to other institutions are also undertaken. To achieve meaningful advances in economic freedom, countries must undertake simultaneous reform to the different areas of the index, rather than trying to change one at a time. Changes to one area in isolation tend to decay back to prior levels unless accompanied by changes in other areas.
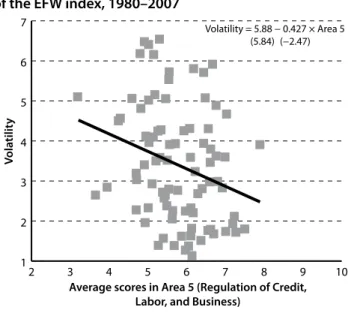
Chapter 4: Macroeconomic Volatility and Economic Freedom: A Preliminary Analysis
John Dawson (Appalachian State University) examines the empirical relationship between business-cycle volatility and economic freedom across countries. In a diverse sample of countries, the results suggest a significantly nega- tive relationship between volatility and a broad measure of freedom—even after controlling for other determinants of cross-country volatility and using an instrumental variables procedure to account for the likely endogeneity of economic
Economic2010_260S_innen.indd 8 30.08.2010 12:34:18 Uhr
freedom. Among the underlying components of the freedom index, all but the size of government also have a signifi- cantly negative relationship with volatility; that is, in these areas, economic freedom reduces volatility. Size of govern- ment is found to have a significantly positive relationship with volatility. Measures of changes in freedom and the vola- tility of freedom are found to be statistically insignificant, suggesting that freedom is not among the shocks that cause business cycles. Rather, freedom appears to allow economies to better adjust to those shocks that drive business cycles.
Chapter 5: Economic Freedom and Unemployment
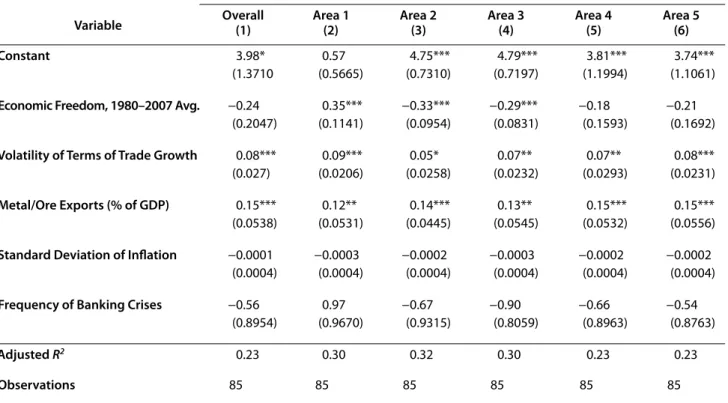
Horst Feldmann (University of Bath) examines the relationship between economic freedom and unemployment.
According to his regression results, more economic freedom appears to reduce unemployment. The magnitude of the effect seems to be substantial, especially among young people. Given the large costs of unemployment and the enormous number of jobless people worldwide, particularly in the wake of the current financial and economic crisis, governments should consider increasing economic freedom as a means of reducing unemployment. To illustrate the magnitude of the effects, Feldmann compares the United States and Italy and finds that, if Italy had enjoyed the same degree of economic freedom as the United States, its unemployment rate might have been . percentage points lower among the total labor force and between . and . percentage points lower among youth, other factors being equal.
Chapter 6: The Relationship between Economic Freedom and Homicide
Edward Peter Stringham (Fayetteville State University) and John Levendis (Loyola University New Orleans) consider the question: Does economic freedom lead to more or less conflict? Numerous authors argue that markets create conflict, whereas many advocates of economic freedom from Adam Smith to Milton Friedman argued the opposite.
Stringham and Levendis examine the various ideas about why economic freedom may reduce conflict and why gov- ernment intervention might increase it. Then,d they look at cross-national data to determine whether measures of markets and homicides are correlated and find that, in a cross section of countries, measures of economic freedom are significantly and negatively correlated with homicide rates. These results hold under various tests for robustness.
Increases in economic freedom do appear to be associated with decreases in homicide rates.
Data available to researchers
The full data set, including all of the data published in this report as well as data omitted due to limited space, can be downloaded for free at <http://www.freetheworld.com/release.html> . The data file available there contains the most up- to-date and accurate data for the Economic Freedom of the World index. Some variable names and data sources have evolved over the years since the first publication in ; users should consult earlier editions of the Economic Freedom of the World annual reports for details regarding sources and descriptions for those years. All editions of the report are available in PDF and can be downloaded for free at <http://www.freetheworld.com> . However, users are always strongly encouraged to use the data from this most recent data file as updates and corrections, even to earlier years’ data, do occur. Users doing long-term or longitudinal studies are encouraged to use the chain-linked index as it is the most consistent through time. If you have problems downloading the data, please contact Jean-François Minardi via e-mail to <freetheworld@fraserinstitute.org> or via telephone +... ext. . If you have technical questions about the data itself, please contact Robert Lawson (e-mail: <rlawson@auburn.edu> ; telephone: +...) or Joshua Hall (e-mail: <joshua.c.hall@gmail.com> ; telephone: +...). Please cite the data set as:
Authors: James D. Gwartney, Joshua C. Hall, and Robert Lawson
Title: Economic Freedom Dataset, published in Economic Freedom of the World: Annual Report Publisher: Fraser Institute
Year:
URL: <http://www.freetheworld.com/release.html>
Economic2010_260S_innen.indd 9 30.08.2010 12:34:18 Uhr
It has been nearly a quarter of a century since Milton Friedman and Michael Walker hosted the initial meet- ing of a series of conferences that eventually led to the index published in Economic Freedom of the World (EFW). These conferences, held from to , had a single objective: the development of a clearly defined measure of economic freedom for a large set of countries.
Moreover, conference participants wanted the measure to be as objective and transparent as possible. The goals of this project have been unchanged during the years of its existence.
There was considerable debate about the nature of economic freedom at those early conferences but a consensus emerged that the core concepts of economic freedom were self-ownership, non-interference, and the protection of people and their property from invasions by others. Self-ownership and non-interference imply that individuals have a right to choose for themselves—to decide how they will use their time, talents, and resources.
On the other hand, they do not have a right to the time, talents, and resources of others. Put another way, indi- viduals do not have a right to take things from others or demand that others provide things for them. Economic freedom is present when adults are free to produce, con- sume, and trade with others as long as their actions do not harm the person or property of others. Use of violence, theft, fraud, and physical invasions are not permissible but, otherwise, individuals who are economically free are free to choose and compete as they see fit.
The index published in Economic Freedom of the World (EFW) is designed to measure the consistency of a nation’s institutions and policies with this concept of self- ownership. The four cornerstones of economic freedom are t QFSTPOBMDIPJDF
t WPMVOUBSZFYDIBOHFDPPSEJOBUFECZNBSLFUT t GSFFEPNUPFOUFSBOEDPNQFUFJONBSLFUT
t QSPUFDUJPO PG QFSTPOT BOE UIFJS QSPQFSUZ GSPN aggression by others.
These four underpin the EFW index. Put simply, insti- tutions and policies are consistent with economic free- dom when they permit individuals to choose for them- selves, enter into voluntary agreements with others, and protect individuals and their property from aggres- sors. In order to achieve a high EFW rating, a coun- try must provide secure protection of privately owned property, evenhanded enforcement of contracts, and a stable monetary environment. It also must keep taxes low, refrain from creating barriers to both domestic and international trade, and rely more fully on mar- kets rather than the political process to allocate goods and resources.
From to , there was a gradual but steady movement toward economic freedom. Numerous stud- ies have shown that countries with more economic free- dom grow more rapidly and achieve higher levels of per capita income than those that are less free. Similarly, there is a positive relationship between changes in eco- nomic freedom and the growth of per-capita income.
Moreover, as per-capita income has grown, the world’s poverty rate has declined and most of this progress has occurred in countries that have made substantial moves toward higher levels of economic freedom. Economic growth is primarily the result of gains from trade, capi- tal investment, and the discovery of improved prod- ucts, lower-cost production methods, and better ways of doing things. Given these sources of growth and prosperity, it is not surprising that increases in eco- nomic freedom and improvements in quality of life are closely related.
As the world confronted financial instability and economic decline in , the mean economic freedom rating fell for the first time in several decades. As we mentioned in last year’s report, the world now faces a situation similar to that of the Great Depression. During the s, perverse economic policies transformed a normal cyclical downturn into a decade-long era of hard- ship and suffering. The length and severity of the Great
Chapter 1: Economic Freedom of the World, 2008
Economic2010_260S_innen.indd 11 30.08.2010 12:34:19 Uhr
Depression were the result of a sharp monetary con- traction, imposition of trade restrictions, higher taxes, increases in government spending financed with debt, price controls, and uncertainty created by constant pol- icy changes that were supposed to hasten the end of the crisis. Even though it was caused by perverse policies, the Great Depression led to more government regula- tion, growth of government spending, and reductions in economic freedom.
While the current economic downturn is far less severe than that of the Great Depression, both the fun- damental cause and the policy responses are similar. In the United States, perverse credit expansion and regula- tory policies were the primary cause of the current crisis.
Seeking to promote more affordable housing, politicians expanded the availability of credit, and imposed regula- tions that contaminated the quality of mortgages (e.g., loans with little or no down payment, excessively large loans relative to income, and loans to unqualified borrow- ers with a poor credit history). The result: an unsustain- able housing price boom followed by the bust, and eventu- ally increases in the default and foreclosure rates as heavily indebted borrowers were unable to make the payments on the loans the regulators arranged for them. The downturn in the housing industry soon spread to other sectors and the contaminated mortgage-backed securities were mar- keted throughout the world, leading to a financial crisis.
The policy response to the crisis has also been similar to that of the Great Depression: more regulation, growth of government spending financed by debt, and constant pol- icy changes that have created uncertainty and undermine private-sector activity.
Will the perverse policies that caused the current crisis lead to still more government intervention and regu- lation just as it did during the Great Depression? We are now in the midst of a great debate on this issue. The out- come of this debate is highly important because there is a dramatic difference in the incentive for productive action between a market economy and one that is managed and directed by the political process. With markets, profits and losses will direct people toward productive actions and away from unproductive and counterproductive ones.
If a business is going to be successful in a market economy, it must bid resources away from others and use them to supply goods that people value enough to pay prices suf- ficient to cover their costs. Profits and losses also provide people with a strong incentive to innovate, and discover production methods with lower costs and new products that people value highly relative to cost. This incentive
to use resources productively and discover better ways of doing things is the driving force underlying economic growth and progress.
The incentive structure of the political process is vastly different. There is nothing comparable to profits and losses that will consistently direct resources into pro- ductive projects and away from those that are counter- productive. Politicians will allocate resources toward the politically powerful—those who can provide them with the most votes, campaign funds, high paying jobs for political allies and, yes, even bribes. There is no reason to expect that this incentive structure will channel resources into productive, and away from counterproductive, proj- ects. Innovators and entrepreneurs will be disadvantaged by this system because it will not be enough to produce products that consumers value highly relative to cost;
one will also have to compete for political favoritism and cater to the views of the political class. The result: more resources will be used to obtain political favors—econo- mists refer to this as rent-seeking—and fewer channeled into productive activities.
As this debate unfolds, it is important to distin- guish between market entrepreneurs and crony capital- ists. Market entrepreneurs succeed by providing cus- tomers with better products, more reliable service, and lower prices than are available elsewhere. They succeed by creating wealth: by producing goods and services that are worth more than the value of the resources required for their production. Crony capitalists are different: they get ahead through subsidies, special tax breaks, regula- tory favors, and other forms of political favoritism. Rather than providing consumers with better products at attrac- tive prices, crony capitalists form an alliance with politi- cians. The crony capitalists provide the politicians with contributions, other political resources, and, in some cases, bribes in exchange for subsidies and regulations that give them an advantage relative to other firms. Rather than create wealth, crony capitalists form a coalition with political officials to plunder wealth from taxpayers and other citizens.
The Great Debate between the proponents of lim- ited government and open markets on the one hand and those favoring collectivism and political direction of the economy on the other highlights the importance of an accurate and objective measure of economic freedom. The index published in Economic Freedom of the World pro- vides a measure that will help one track the direction of this debate, which is sure to affect the prosperity of the world in the years immediately ahead.
Economic2010_260S_innen.indd 12 30.08.2010 12:34:19 Uhr
The Economic Freedom of the World index, 2008
The construction of the index published in Economic Freedom of the World (EFW index) is based on three important methodological principles. First, objective components are always preferred to those that involve surveys or value judgments. Given the multidimen- sional nature of economic freedom and the importance of legal and regulatory elements it is sometimes neces- sary to use data based on surveys, expert panels, and generic case studies. To the fullest extent possible, how- ever, the index uses objective components. Second, the data used to construct the index ratings are from external sources such as the International Monetary Fund, World Bank, and World Economic Forum that provide data for a large number of countries. Data provided directly from a source within a country are rarely used, and only when the data are unavailable from international sources.
Importantly, the value judgments of the authors or others in the Economic Freedom Network are never used to alter the raw data or the rating of any country. Third, transpar- ency is present throughout. The report provides infor- mation about the data sources, the methodology used to transform raw data into component ratings, and how the component ratings are used to construct both the area and summary ratings. Complete methodological details can be found in Appendix: Explanatory Notes and Data Sources (page ). The entire data set used in the con- struction of the index is freely available to researchers at www.freetheworld.com.
Exhibit . indicates the structure of the EFW index.
The index measures the degree of economic freedom pres- ent in five major areas: [] Size of Government: Expenditures, and Taxes, Enterprises; [] Legal Structure and Security of Property Rights; [] Access to Sound Money; [] Freedom to Trade Internationally; [] Regulation of Credit, Labor, and Business.
Within the five major areas, there are compo- nents in this year’s index. Many of those components are themselves made up of several sub-components. In total, the index comprises distinct variables. Each compo- nent and sub-component is placed on a scale from to
that reflects the distribution of the underlying data. The sub-component ratings are averaged to determine each component. The component ratings within each area are then averaged to derive ratings for each of the five areas. In turn, the five area ratings are averaged to derive the sum- mary rating for each country. Following is an overview of the five major areas.
Area 1: Size of Government: Expenditures, Taxes, and Enterprises
The four components of Area indicate the extent to which countries rely on the political process to allocate resources and goods and services. When government spending increases relative to spending by individuals, households and businesses, government decision-making is substituted for personal choice and economic freedom is reduced. The first two components address this issue.
Government consumption as a share of total consumption (A) and transfers and subsidies as a share of GDP (B) are indicators of the size of government. When govern- ment consumption is a larger share of the total, political choice is substituted for personal choice. Similarly, when governments tax some people in order to provide trans- fers to others, they reduce the freedom of individuals to keep what they earn.
The third component (C) in this area measures the extent to which countries use private rather than government enterprises to produce goods and services.
Government firms play by rules that are different from those to which private enterprises are subject. They are not dependent on consumers for their revenue or on investors for capital. They often operate in protected mar- kets. Thus, economic freedom is reduced as government enterprises produce a larger share of total output.
The fourth component (D) is based on (Di) the top marginal income tax rate and (Dii) the top mar- ginal income and payroll tax rate and the income thresh- old at which these rates begin to apply. These two sub- components are averaged to calculate the top marginal tax rate (D). High marginal tax rates that apply at relatively low income levels are also indicative of reliance upon gov- ernment. Such rates deny individuals the fruits of their labor. Thus, countries with high marginal tax rates and low income thresholds are rated lower.
Taken together, the four components of Area measure the degree to which a country relies on personal choice and markets rather than government budgets and political decision-making. Therefore, countries with low levels of government spending as a share of the total, a smaller government enterprise sector, and lower marginal tax rates earn the highest ratings in this area.
Area 2: Legal Structure and Security of Property Rights Protection of persons and their rightfully acquired prop- erty is a central element of economic freedom and a civil society. Indeed, it is the most important function of gov- ernment. Area focuses on this issue. The key ingredients
Economic2010_260S_innen.indd 13 30.08.2010 12:34:20 Uhr
Exhibit 1.1: The Areas, Components, and Sub-Components of the EFW Index
1 Size of Government: Expenditures, Taxes, and Enterprises
A General government consumption spending as a percentage of total consumption B Transfers and subsidies as a percentage of GDP C Government enterprises and investment D Top marginal tax rate
i Top marginal income tax rate
ii Top marginal income and payroll tax rates 2 Legal Structure and Security of Property Rights
A Judicial independence (GCR) B Impartial courts (GCR)
C Protection of property rights (GCR) D Military interference in rule of law and
the political process (ICRG) E Integrity of the legal system (ICRG) F Legal enforcement of contracts (DB)
G Regulatory restrictions on the sale of real property (DB)
3 Access to Sound Money A Money growth
B Standard deviation of inflation C Inflation: Most recent year
D Freedom to own foreign currency bank accounts
4 Freedom to Trade Internationally A Taxes on international trade
i Revenues from trade taxes (% of trade sector)
ii Mean tariff rate
iii Standard deviation of tariff rates
B Regulatory trade barriers i Non-tariff trade barriers (GCR)
ii Compliance cost of importing & exporting (DB) C Size of trade sector relative to expected
D Black-market exchange rates E International capital market controls
i Foreign ownership / investment restrictions (GCR) ii Capital controls
5 Regulation of Credit, Labor, and Business A Credit market regulations
i Ownership of banks ii Foreign bank competition iii Private sector credit
iv Interest rate controls / negative real interest rates B Labor market regulations
i Hiring regulations and minimum wage (DB) ii Hiring and firing regulations (GCR) iii Centralized collective bargaining (GCR) iv Hours regulations (DB)
v Mandated cost of worker dismissal (DB) vi Conscription
C Business regulations i Price controls
ii Administrative requirements (GCR) iii Bureaucracy costs (GCR)
iv Starting a business (DB) v Extra payments / bribes (GCR) vi Licensing restrictions (DB) vii Cost of tax compliance (DB)
GCR = Global Competitiveness Report; ICRG = International Country Risk Guide; DB = Doing Business (see Appendix 1 for bibliographical information).
Economic2010_260S_innen.indd 14 30.08.2010 12:34:20 Uhr
of a legal system consistent with economic freedom are rule of law, security of property rights, an independent judiciary, and an impartial court system. Components indicating how well the protective function of govern- ment is performed were assembled from three primary sources: the International Country Risk Guide, the Global Competitiveness Report, and the World Bank’s Doing Business project.
Security of property rights, protected by the rule of law, provides the foundation for both economic free- dom and the efficient operation of markets. Freedom to exchange, for example, is meaningless if individuals do not have secure rights to property, including the fruits of their labor. When individuals and businesses lack confi- dence that contracts will be enforced and the fruits of their productive efforts protected, their incentive to engage in productive activity is eroded. Perhaps more than any other area, this area is essential for the efficient allocation of resources. Countries with major deficiencies in this area are unlikely to prosper regardless of their policies in the other four areas.
Area 3: Access to Sound Money
Money oils the wheels of exchange. An absence of sound money undermines gains from trade. As Milton Friedman informed us long ago, inflation is a monetary phenom- enon, caused by too much money chasing too few goods.
High rates of monetary growth invariably lead to inflation.
Similarly, when the rate of inflation increases, it also tends to become more volatile. High and volatile rates of infla- tion distort relative prices, alter the fundamental terms of long-term contracts, and make it virtually impossible for individuals and businesses to plan sensibly for the future.
Sound money is essential to protect property rights and, thus, economic freedom. Inflation erodes the value of property held in monetary instruments. When govern- ments finance their expenditures by creating money, in effect, they are expropriating the property and violating the economic freedom of their citizens.
The important thing is that individuals have access to sound money: who provides it makes little difference.
Thus, in addition to data on a country’s inflation and its government’s monetary policy, it is important to consider how difficult it is to use alternative, more credible, cur- rencies. If bankers can offer saving and checking accounts in other currencies or if citizens can open foreign bank accounts, then access to sound money is increased and economic freedom expanded.
There are four components to the EFW index in Area . All of them are objective and relatively easy to
obtain and all have been included in the earlier editions of the index. The first three are designed to measure the consistency of monetary policy (or institutions) with long- term price stability. Component D is designed to mea- sure the ease with which other currencies can be used via domestic and foreign bank accounts. In order to earn a high rating in this area, a country must follow policies and adopt institutions that lead to low (and stable) rates of inflation and avoid regulations that limit the ability to use alternative currencies.
Area 4: Freedom to Trade Internationally
In our modern world of high technology and low costs for communication and transportation, freedom of exchange across national boundaries is a key ingredient of economic freedom. Many goods and services are now either pro- duced abroad or contain resources supplied from abroad.
Voluntary exchange is a positive-sum activity: both trad- ing partners gain and the pursuit of the gain provides the motivation for the exchange. Thus, freedom to trade inter- nationally also contributes substantially to our modern living standards.
In response to protectionist critics and spe- cial-interest politics, virtually all countries adopt trade restrictions of various types. Tariffs and quotas are obvi- ous examples of roadblocks that limit international trade.
Because they reduce the convertibility of currencies, controls on the exchange rate also hinder international trade. The volume of trade is also reduced if the passage of goods through customs is onerous and time consum- ing. Sometimes these delays are the result of administra- tive inefficiency while in other instances they reflect the actions of corrupt officials seeking to extract bribes. In both cases, economic freedom is reduced.
The components in this area are designed to mea- sure a wide variety of restraints that affect international exchange: tariffs, quotas, hidden administrative restraints, and exchange rate and capital controls. In order to get a high rating in this area, a country must have low tariffs, a trade sector that is larger than expected, easy clearance and efficient administration of customs, a freely convert- ible currency, and few controls on the movement of capital.
Area 5: Regulation of Credit, Labor, and Business When regulations restrict entry into markets and inter- fere with the freedom to engage in voluntary exchange, they reduce economic freedom. The fifth area of the index focuses on regulatory restraints that limit the freedom of exchange in credit, labor, and product markets. The first component (A) reflects conditions in the domestic credit
Economic2010_260S_innen.indd 15 30.08.2010 12:34:21 Uhr
market. The first two sub-components provide evidence on the extent to which the banking industry is dominated by private firms and whether foreign banks are permitted to compete in the market. The final two sub-components indicate the extent to which credit is supplied to the pri- vate sector and whether controls on interest rates inter- fere with the market in credit. Countries that use a private banking system to allocate credit to private parties and refrain from controlling interest rates receive higher rat- ings for this regulatory component.
Many types of labor-market regulations infringe on the economic freedom of employees and employers.
Among the more prominent are minimum wages, dis- missal regulations, centralized wage setting, extension of union contracts to nonparticipating parties, and con- scription. The labor-market component (B) is designed to measure the extent to which these restraints upon eco- nomic freedom are present. In order to earn high marks in the component rating regulation of the labor market, a country must allow market forces to determine wages and establish the conditions of hiring and firing, and refrain from the use of conscription.
Like the regulation of credit and labor markets, the regulation of business activities (component C) inhibits economic freedom. The sub-components of C are designed to identify the extent to which regulations and bureaucratic procedures restrain entry and reduce competition. In order to score high in this portion of the index, countries must allow markets to determine prices and refrain from regulatory activities that retard entry into business and increase the cost of producing prod- ucts. They also must refrain from “playing favorites,” that is, from using their power to extract financial payments and reward some businesses at the expense of others.
Construction of Area and Summary ratings
Theory provides us with direction regarding elements that should be included in the five areas and the summary index, but it does not indicate what weights should be attached to the components within the areas or among the areas in the construction of the summary index. It would be nice if these factors were independent of each other and a weight could be attached to each of them. During the past several years, we have investigated several methods of weighting the various components, including principle component analysis and a survey of economists. We have also invited others to use their own weighting structure if they believe that it is preferable. In the final analysis, the
summary index is not very sensitive to substantial varia- tions in the weights.
Furthermore, there is reason to question whether the areas (and components) are independent or work together like a team. Put another way, they may be linked more like the wheels, motor, transmission, drive shaft, and frame of a car. Just as it is the bundle of these factors that underlies the mobility of an auto, it may be a bun- dle of factors that underlies the composition of economic freedom. With regard to an automobile, which is more important for mobility: the motor, wheels, or transmis- sion? The question cannot be easily answered because the parts work together. If any of these key parts break down, the car is immobile. Institutional quality may be much the same. If any of the key parts are absent, the overall effec- tiveness is undermined.
As the result of these two considerations, we orga- nize the elements of the index in a manner that seems sensible to us but we make no attempt to weight the com- ponents in any special way when deriving either area or summary ratings. Of course, the component and sub- component data are available to researchers who would like to consider alternative weighting schemes and we encourage them to do so.
Summary Economic Freedom Ratings, 2008
Exhibit . presents summary economic freedom ratings, sorted from highest to lowest. These ratings are for the year , the most recent year for which comprehen- TJWFEBUBBSFBWBJMBCMF)POH,POHBOE4JOHBQPSFPODF again, occupy the top two positions. The other nations in the top are New Zealand, Switzerland, Chile, United States, Canada, Australia, Mauritius, and the United ,JOHEPNͳFSBOLJOHTPGPUIFSNBKPSDPVOUSJFTJODMVEF German (), Japan (), France (,PSFBϰ ˠˤ), Spain (), Italy (), Mexico (), China (ⁿ), Russia (), India (), and Brazil (ⁿ). The ten lowest-rated countries are Algeria, Democratic Republic of Congo, Burundi, Guinea-Bissau, Central African Republic, Republic of Congo, Venezuela, Angola, Myanmar and, again in last place, Zimbabwe.
The EFW index is calculated back to as the availability of data allows; see the Country Data Tables in chapter or our website, <http://www.freetheworld.com> , for information from past years. Because some data for earlier years may have been updated or corrected, researchers are always encouraged to use the data from the most recent annual report to assure the best-quality data.
Economic2010_260S_innen.indd 16 30.08.2010 12:34:21 Uhr
0 2 4 6 8 10
Namibia 71 Papua New Guinea 70 Mexico 69Poland 66 Montenegro 66 Italy 66 Nicaragua 65Uruguay 62 Kyrgyz Republic 62Belize 62 Slovenia 61Greece 60 Thailand 58 Kazakhstan 58Mongolia 55Uganda 57 Latvia 55 Botswana 54 Trinidad & Tobago 51Guatemala 51Portugal 51 Armenia 50Zambia 48Albania 48 Jamaica 46 Czech Republic 46Bahamas 45 Oman 43 Belgium 43 Jordan 42Spain 39 Iceland 39 Honduras 39Sweden 37 Korea, South 37 Bulgaria 36France 35Malta 33 Lithuania 33Peru 32 Norway 31 Panama 30 Hungary 28 El Salvador 28Costa Rica 27Kuwait 24 Japan 24 Germany 24 Georgia 23Taiwan 22 Netherlands 21 Cyprus 20 Finland 19 Bahrain 18 Slovak Republic 16Luxembourg 16Austria 15 Denmark 14 United Arab Emirates 12 Estonia 12Ireland 11 United Kingdom 10 Mauritius 9Australia 8Canada 7 United States 6Switzerland 4Chile 5 New Zealand 3Singapore 2 Hong Kong 1
0 2 4 6 8 10
Zimbabwe 141Myanmar 140 Angola 139 Venezuela 138 Congo, Republic of 137 Central African Republic 136Guinea-Bissau 135Burundi 134 Congo, Democratic Republic 133Algeria 132Chad 131 Ethiopia 130Niger 129Syria 128 Ukraine 127 Sierra Leone 125Nepal 125 Senegal 124 Côte d’Ivoire 123Togo 121 Mozambique 121Cameroon 119Gabon 119 Pakistan 118Benin 117 Burkina Faso 116 Tanzania 115 Argentina 114 Bangladesh 113Sri Lanka 111 Bosnia and Herzegovina 111 Nigeria 110 Ecuador 109Mali 107 Iran 107 Malawi 106 Vietnam 105 Bolivia 104 Madagascar 102Brazil 102 Colombia 101Morocco 100Guyana 99 Serbia 97 Dominican Republic 97Lesotho 96 Mauritania 95Barbados 94 Azerbaijan 93 Tunisia 90 Rwanda 90 Indonesia 90 Moldova 87Croatia 87India 87 Paraguay 86Romania 85 Russia 84 South Africa 82China 82 Israel 81 Egypt 80Fiji 79 Haiti 78 Malaysia 77 Philippines 76 Kenya 75 Turkey 74 Macedonia 72 Ghana 72 9.05
8.70 8.27 8.08 8.03 7.96 7.95 7.90 7.82 7.81 7.74 7.73 7.73 7.69 7.61 7.60 7.60 7.58 7.55 7.54 7.53 7.48 7.47 7.46 7.46 7.46 7.45 7.44 7.44 7.43 7.40 7.39 7.34 7.34 7.32 7.31 7.28 7.28 7.26 7.26 7.26 7.24 7.22 7.22 7.21 7.19 7.19 7.18 7.18 7.12 7.10 7.10 7.10 7.09 7.08 7.08 7.07 7.06 7.06 6.95 6.94 6.93 6.93 6.93 6.91 6.90 6.90 6.90 6.89 6.87 6.85
6.83 6.83 6.82 6.81 6.77 6.72 6.70 6.69 6.68 6.67 6.65 6.65 6.62 6.58 6.55 6.51 6.51 6.51 6.44 6.44 6.44 6.36 6.35 6.34 6.33 6.31 6.31 6.25 6.20 6.19 6.18 6.18 6.16 6.15 6.12 6.10 6.10 6.07 6.06 6.03 6.03 6.01 5.99 5.98 5.94 5.91 5.84 5.83 5.83 5.74 5.74 5.66 5.62 5.54 5.54 5.53 5.41 5.33 5.19 5.05 5.00 4.93 4.91 4.82 4.77 4.75 4.33 3.89 3.81 3.57
Exhibit 1.2: Summary Economic Freedom Ratings, 2008
Economic2010_260S_innen.indd 17 30.08.2010 12:34:22 Uhr
Area Economic Freedom Ratings (and Rankings), 2008
Exhibit . presents the ratings (and, in parentheses, the rankings) for each of the five areas of the index and for com- ponents A, B, and C. A number of interesting patterns emerge from an analysis of these data. High-income indus- trial economies generally rank quite high for Legal Structure and Security of Property Rights (Area ), Access to Sound Money (Area ), and Freedom to Trade Internationally (Area ). Their ratings were lower, however, for Size of Government: Expenditures, Taxes, and Enterprises (Area
) and Regulation of Credit, Labor, and Business (Area ).
This was particularly true for western European countries.
On the other hand, a number of developing nations show the opposite pattern. Albania makes an interesting case study. It shows that reasonably sized government alone is not enough to reap the benefits of economic free- dom. The institutions of economic freedom, such as the rule of law and property rights, as well as sound money, trade openness, and sensible regulation are required.
Albania ranked quite high at in Size of Government:
Expenditures, Taxes, and Enterprises (Area ) and in
Sound Money (Area ). However, Albania scored poorly in all the other categories: in Legal Structure and Security of Property Rights (Area ), in Freedom to Trade Internationally (Area ), and in Regulation (Area ). Despite relatively high rankings in a couple of areas, Albania’s overall ranking was only .
Weakness in the rule of law and property rights is particularly pronounced in sub-Saharan Africa, among Islamic nations, and for several nations that were part of the former Soviet bloc, though some of these nations have made strides toward improvement. Many Latin American and Southeast Asian nations also score poorly for rule of law and property rights. The nations that rank poorly in this category also tend to score poorly in the trade and regulation categories, even though several have reason- ably sized governments and sound money.
The economies most open to foreign trade are Hong ,POH4JOHBQPSFBOE$IJMFXIJMFUIFNPTUDMPTFEFDPOP- mies were Myanmar and Venezuela. The least regulated countries—those at the top in Regulation of Credit, Labor, and Business (Area )—were a diverse lot: Bahamas, Hong ,POH#FMJ[F/FX;FBMBOE'JKJ4JOHBQPSF#BISBJO$BOBEB Australia, and Iceland.
AREAS COMPONENTS OF AREA 5
1 Size of Government
2 Legal System &
Property Rights 3
Sound Money 4
Freedom to Trade Internationally
5
Regulation 5A
Credit Market Regulation
5b Labor Market
Regulation
5C Business Regulations
Rating (Rank) Rating (Rank) Rating (Rank) Rating (Rank) Rating (Rank) Rating (Rank) Rating (Rank) Rating (Rank)
Albania
8.24 (8) 5.30 (83) 9.40 (26) 6.29 (99) 6.67 (86) 8.12 (86) 5.79 (86) 6.10 (58)Algeria
3.14 (140) 4.46 (107) 6.36 (118) 5.82 (111) 5.20 (131) 5.32 (135) 4.93 (115) 5.35 (100)Angola
0.00 (141) 3.34 (129) 5.03 (136) 6.00 (108) 5.10 (134) 6.45 (126) 2.98 (139) 5.86 (77)Argentina
6.37 (72) 4.45 (108) 6.90 (101) 6.38 (98) 5.86 (119) 7.94 (95) 5.18 (104) 4.44 (131)Armenia
7.87 (18) 5.49 (77) 8.88 (45) 6.61 (85) 6.78 (78) 8.95 (60) 6.12 (78) 5.25 (107)Australia
6.80 (54) 8.31 (11) 9.43 (22) 6.72 (77) 8.24 (9) 9.50 (14) 8.48 (12) 6.74 (24)Austria
5.14 (119) 8.41 (8) 9.54 (8) 7.56 (29) 7.39 (42) 9.44 (25) 5.92 (84) 6.81 (21)Azerbaijan
5.76 (98) 6.40 (44) 6.09 (126) 6.66 (82) 6.87 (71) 7.50 (113) 6.89 (57) 6.21 (49)Bahamas
8.24 (9) 7.13 (27) 6.82 (104) 5.01 (133) 8.85 (1) 9.75 (7) 9.40 (1) 7.40 (9)Bahrain
6.27 (78) 6.60 (37) 9.09 (37) 7.56 (30) 8.37 (7) 9.50 (14) 8.64 (10) 6.96 (18)Bangladesh
8.13 (11) 3.07 (134) 6.39 (117) 5.81 (113) 6.67 (85) 8.19 (84) 6.37 (66) 5.45 (93)Barbados
5.68 (101) 7.83 (18) 6.10 (125) 5.09 (131) 7.06 (60) 8.52 (79) 6.97 (54) 5.69 (89)Belgium
4.20 (133) 6.92 (30) 9.48 (15) 7.98 (12) 7.54 (35) 9.38 (28) 6.90 (56) 6.35 (41)Belize
6.56 (64) 5.71 (69) 8.18 (68) 5.45 (123) 8.77 (3) 9.37 (30) 8.89 (7) 8.06 (1)Benin
7.39 (35) 4.44 (110) 6.11 (123) 5.12 (129) 6.49 (92) 9.33 (31) 5.48 (94) 4.67 (127)Bolivia
6.36 (73) 3.77 (121) 7.97 (73) 7.17 (51) 5.52 (127) 8.00 (90) 3.62 (134) 4.93 (117)Bosnia & Herzeg.
5.56 (107) 3.51 (126) 7.98 (72) 6.17 (103) 6.93 (66) 8.87 (65) 6.71 (62) 5.23 (110)Exhibit 1.3: Area Economic Freedom Ratings (Ranks), 2008
Economic2010_260S_innen.indd 18 30.08.2010 12:34:22 Uhr
AREAS COMPONENTS OF AREA 5 1
Size of Government
2 Legal System &
Property Rights 3
Sound Money 4
Freedom to Trade Internationally
5
Regulation 5A
Credit Market Regulation
5b Labor Market
Regulation
5C Business Regulations
Rating (Rank) Rating (Rank) Rating (Rank) Rating (Rank) Rating (Rank) Rating (Rank) Rating (Rank) Rating (Rank)
Botswana
5.29 (115) 6.83 (32) 8.70 (53) 7.00 (64) 7.64 (28) 9.25 (35) 7.01 (50) 6.66 (28)Brazil
6.39 (71) 5.25 (84) 7.87 (77) 6.39 (96) 5.01 (135) 7.07 (123) 3.91 (130) 4.04 (134)Bulgaria
7.46 (31) 5.21 (85) 8.74 (52) 7.62 (23) 7.54 (36) 9.50 (14) 7.75 (22) 5.38 (96)Burkina Faso
6.24 (82) 4.34 (113) 6.64 (110) 5.23 (127) 7.24 (54) 8.57 (76) 7.17 (45) 5.98 (66)Burundi
3.88 (137) 3.21 (131) 7.29 (95) 4.13 (138) 6.04 (111) 5.81 (132) 7.31 (40) 4.99 (116)Cameroon
6.67 (61) 3.54 (124) 6.74 (106) 5.81 (112) 6.38 (98) 8.00 (90) 7.41 (37) 3.74 (136)Canada
6.54 (65) 8.28 (12) 9.54 (9) 7.10 (58) 8.30 (8) 9.48 (24) 8.33 (15) 7.08 (14)Central Afr. Rep.
6.28 (77) 2.17 (140) 6.63 (111) 3.59 (139) 5.18 (132) 7.10 (122) 4.47 (122) 3.98 (135)Chad
5.73 (99) 2.18 (139) 5.90 (130) 5.71 (117) 5.71 (121) 6.03 (129) 5.94 (82) 5.17 (112)Chile
7.79 (23) 7.10 (28) 8.82 (47) 8.61 (3) 7.83 (22) 9.25 (35) 7.26 (44) 6.99 (16)China
4.51 (131) 6.38 (46) 9.38 (27) 7.38 (37) 5.62 (125) 7.18 (120) 4.82 (118) 4.86 (121)Colombia
6.18 (85) 4.39 (112) 7.87 (76) 5.69 (118) 6.80 (76) 8.73 (70) 5.48 (95) 6.21 (50)Congo, Dem. Rep.
5.11 (120) 2.14 (141) 7.63 (86) 5.43 (124) 4.35 (140) 4.78 (138) 4.56 (121) 3.72 (137)Congo, Rep. of
4.77 (127) 2.85 (136) 4.93 (137) 5.45 (122) 5.75 (120) 6.33 (127) 6.29 (73) 4.62 (129)Costa Rica
7.66 (27) 6.57 (40) 8.66 (54) 7.55 (31) 6.84 (74) 7.87 (101) 6.36 (67) 6.28 (42)Côte d’Ivoire
6.34 (74) 3.11 (133) 6.40 (116) 6.39 (95) 6.06 (109) 7.93 (96) 5.11 (109) 5.14 (113)Croatia
5.32 (113) 5.65 (72) 8.09 (69) 6.55 (88) 6.91 (68) 9.37 (29) 6.31 (69) 5.07 (114)Cyprus
7.53 (29) 6.84 (31) 9.30 (30) 7.09 (59) 6.94 (65) 9.50 (14) 5.25 (103) 6.08 (59)Czech Republic
5.02 (124) 6.43 (43) 9.14 (35) 7.84 (15) 7.53 (37) 9.33 (32) 7.67 (25) 5.60 (91)Denmark
4.50 (132) 8.74 (3) 9.37 (29) 7.72 (17) 8.13 (11) 9.50 (14) 7.47 (35) 7.42 (8)Dominican Rep.
7.58 (28) 4.79 (93) 5.91 (129) 6.76 (73) 6.53 (89) 7.45 (117) 6.32 (68) 5.83 (79)Ecuador
8.03 (13) 4.04 (117) 6.10 (124) 6.49 (92) 5.67 (122) 7.95 (94) 3.74 (132) 5.31 (102)Egypt
7.21 (38) 5.44 (78) 8.26 (64) 6.88 (67) 5.63 (124) 6.33 (128) 4.96 (112) 5.61 (90)El Salvador
8.96 (3) 4.60 (102) 9.27 (31) 7.27 (44) 7.08 (59) 9.75 (8) 4.95 (113) 6.54 (33)Estonia
6.79 (55) 7.21 (25) 9.08 (39) 7.95 (13) 7.62 (30) 10.00 (1) 5.56 (93) 7.28 (11)Ethiopia
5.86 (95) 5.01 (90) 3.87 (140) 5.22 (128) 5.97 (113) 4.43 (139) 7.12 (47) 6.36 (40)Fiji
6.98 (48) 5.99 (57) 6.42 (115) 5.33 (125) 8.76 (5) 9.75 (8) 9.22 (3) 7.30 (10)Finland
5.03 (123) 8.66 (4) 9.47 (19) 7.37 (40) 7.23 (55) 9.75 (8) 5.06 (110) 6.88 (19)France
5.43 (110) 7.31 (24) 9.54 (7) 7.30 (43) 7.01 (62) 9.22 (44) 5.62 (90) 6.19 (53)Gabon
6.18 (86) 4.31 (114) 6.08 (127) 5.68 (119) 6.90 (69) 7.56 (109) 7.08 (48) 6.06 (60)Georgia
7.68 (26) 5.07 (88) 9.08 (38) 7.73 (16) 7.81 (23) 8.67 (75) 7.31 (41) 7.46 (6)Germany
5.64 (103) 8.17 (14) 9.51 (13) 7.70 (18) 6.25 (105) 8.22 (83) 3.94 (129) 6.61 (29)Ghana
6.12 (89) 5.41 (81) 8.47 (59) 7.58 (24) 6.57 (87) 7.69 (105) 6.15 (77) 5.88 (75)Greece
6.70 (59) 6.14 (52) 9.60 (4) 6.39 (97) 5.91 (116) 7.57 (108) 4.43 (123) 5.74 (83)Guatemala
7.99 (14) 4.88 (92) 8.93 (43) 7.36 (41) 6.36 (99) 8.97 (56) 4.17 (126) 5.94 (73)Guinea-Bissau
3.74 (138) 3.27 (130) 5.74 (132) 5.50 (120) 5.86 (118) 8.95 (61) 3.88 (131) 4.75 (124)Guyana
4.19 (134) 4.66 (99) 7.75 (79) 7.42 (35) 7.20 (57) 8.08 (87) 7.34 (39) 6.20 (51)Haiti
8.60 (6) 2.70 (137) 8.22 (67) 6.64 (84) 7.33 (46) 8.56 (78) 8.83 (8) 4.59 (130)Honduras
8.74 (5) 4.51 (105) 8.88 (46) 7.45 (33) 6.71 (82) 8.72 (71) 4.96 (111) 6.45 (36)Hong Kong
9.29 (1) 8.10 (16) 9.54 (10) 9.55 (1) 8.78 (2) 9.28 (33) 9.31 (2) 7.76 (4)Hungary
6.29 (76) 6.28 (49) 9.25 (32) 8.06 (9) 7.30 (47) 8.84 (67) 7.08 (49) 5.98 (65)Iceland
6.25 (81) 8.43 (7) 7.68 (81) 5.74 (115) 8.21 (10) 9.25 (35) 7.65 (27) 7.72 (5)India
6.84 (51) 5.93 (63) 6.69 (108) 6.79 (72) 6.31 (101) 6.89 (124) 7.29 (42) 4.75 (123)Exhibit 1.3 (continued): Area Economic Freedom Ratings (Ranks), 2008
Economic2010_260S_innen.indd 19 30.08.2010 12:34:24 Uhr
AREAS COMPONENTS OF AREA 5 1
Size of Government
2 Legal System &
Property Rights 3
Sound Money 4
Freedom to Trade Internationally
5
Regulation 5A
Credit Market Regulation
5b Labor Market
Regulation
5C Business Regulations
Rating (Rank) Rating (Rank) Rating (Rank) Rating (Rank) Rating (Rank) Rating (Rank) Rating (Rank) Rating (Rank)
Indonesia
7.11 (45) 4.44 (109) 7.55 (89) 7.04 (62) 6.08 (107) 7.84 (102) 5.11 (108) 5.29 (104)Iran
6.27 (79) 6.12 (53) 7.73 (80) 4.99 (135) 5.38 (130) 5.67 (133) 4.78 (119) 5.70 (88)Ireland
5.28 (116) 7.92 (17) 9.48 (14) 8.22 (6) 7.81 (24) 9.00 (47) 7.58 (29) 6.86 (20)Israel
4.83 (125) 5.90 (64) 9.07 (40) 7.26 (45) 6.27 (103) 7.50 (112) 4.83 (117) 6.48 (35)Italy
5.71 (100) 5.67 (71) 9.48 (16) 7.11 (57) 6.54 (88) 7.91 (98) 6.30 (70) 5.40 (95)Jamaica
8.82 (4) 5.52 (75) 7.66 (84) 6.65 (83) 7.28 (49) 8.77 (68) 7.53 (32) 5.55 (92)Japan
6.18 (84) 7.49 (22) 9.77 (1) 6.10 (105) 7.73 (26) 8.91 (62) 8.19 (16) 6.10 (57)Jordan
5.83 (97) 6.56 (41) 8.35 (63) 7.67 (20) 7.80 (25) 8.57 (77) 8.38 (13) 6.45 (38)Kazakhstan
6.83 (52) 6.03 (54) 8.48 (57) 6.51 (90) 7.48 (39) 9.50 (14) 6.87 (58) 6.05 (62)Kenya
7.80 (22) 4.57 (103) 7.68 (82) 6.73 (76) 7.29 (48) 8.47 (80) 7.67 (26) 5.72 (86)Korea, South
6.61 (62) 6.76 (34) 9.47 (18) 7.13 (55) 6.44 (93) 9.25 (35) 4.02 (128) 6.06 (61)Kuwait
6.72 (58) 7.01 (29) 8.80 (49) 6.72 (78) 8.03 (12) 10.00 (1) 7.57 (30) 6.53 (34)Kyrgyz Republic
7.90 (17) 4.70 (97) 7.40 (93) 7.39 (36) 7.27 (51) 9.24 (41) 6.18 (75) 6.39 (39)Latvia
5.10 (121) 6.59 (38) 8.90 (44) 7.32 (42) 7.49 (38) 9.20 (45) 7.13 (46) 6.14 (55)Lesotho
6.11 (90) 4.55 (104) 7.40 (91) 6.23 (100) 7.37 (43) 9.75 (8) 6.93 (55) 5.44 (94)Lithuania
7.00 (47) 6.58 (39) 8.81 (48) 7.46 (32) 6.85 (73) 9.23 (42) 5.59 (91) 5.72 (87)Luxembourg
4.79 (126) 8.35 (10) 9.43 (21) 8.12 (8) 7.27 (50) 9.50 (14) 5.29 (102) 7.04 (15)Macedonia
6.88 (50) 5.08 (87) 7.56 (88) 6.75 (75) 7.88 (19) 9.13 (46) 7.95 (19) 6.55 (32)Madagascar
7.84 (19) 3.40 (127) 7.67 (83) 6.60 (86) 5.39 (129) 5.61 (134) 4.61 (120) 5.95 (69)Malawi
6.15 (87) 5.42 (80) 6.89 (102) 5.30 (126) 6.86 (72) 7.67 (106) 6.74 (61) 6.17 (54)Malaysia
5.95 (92) 6.24 (51) 6.58 (113) 7.26 (46) 7.55 (33) 8.96 (59) 7.57 (31) 6.13 (56)Mali
7.31 (36) 4.47 (106) 6.28 (120) 6.00 (107) 6.42 (96) 8.00 (92) 5.47 (96) 5.80 (80)Malta
5.58 (106) 7.55 (20) 9.46 (20) 7.13 (56) 7.01 (61) 9.40 (27) 7.01 (51) 4.62 (128)Mauritania
6.47 (69) 4.65 (100) 6.59 (112) 6.80 (70) 7.20 (58) 9.22 (43) 6.99 (53) 5.38 (97)Mauritius
8.37 (7) 6.36 (47) 9.00 (42) 7.38 (38) 7.98 (14) 9.50 (14) 7.70 (24) 6.73 (25)Mexico
7.17 (41) 5.42 (79) 7.98 (71) 6.89 (66) 6.98 (63) 9.86 (6) 5.81 (85) 5.28 (105)Moldova
5.87 (94) 6.38 (45) 7.22 (97) 6.82 (69) 6.26 (104) 8.46 (81) 4.95 (114) 5.37 (99)Mongolia
7.71 (25) 5.71 (70) 7.45 (90) 7.16 (52) 7.37 (44) 9.00 (47) 6.86 (59) 6.26 (45)Montenegro
5.84 (96) 5.94 (60) 7.91 (74) 7.19 (50) 7.61 (31) 9.59 (13) 7.91 (20) 5.33 (101)Morocco
6.73 (57) 5.97 (58) 6.72 (107) 6.17 (102) 5.42 (128) 6.75 (125) 3.65 (133) 5.87 (76)Mozambique
4.66 (128) 4.02 (119) 7.63 (85) 6.44 (93) 5.95 (115) 8.91 (63) 3.19 (137) 5.74 (84)Myanmar
6.33 (75) 3.19 (132) 4.46 (139) 1.34 (141) 3.73 (141) 3.91 (140)Namibia
6.53 (66) 7.58 (19) 6.12 (122) 6.11 (104) 7.88 (18) 10.00 (1) 7.45 (36) 6.20 (52)Nepal
6.20 (83) 3.96 (120) 6.36 (119) 5.11 (130) 6.07 (108) 7.23 (119) 5.77 (87) 5.20 (111)Netherlands
4.09 (136) 8.22 (13) 9.53 (12) 8.25 (5) 7.55 (34) 9.50 (14) 6.70 (63) 6.45 (37)New Zealand
6.14 (88) 8.98 (1) 9.58 (5) 7.91 (14) 8.76 (4) 10.00 (1) 8.48 (11) 7.79 (3)Nicaragua
7.50 (30) 4.42 (111) 8.03 (70) 7.21 (49) 7.37 (45) 9.25 (35) 7.00 (52) 5.86 (78)Niger
6.78 (56) 4.18 (116) 6.20 (121) 4.36 (137) 5.15 (133) 7.70 (104) 2.86 (140) 4.88 (120)Nigeria
5.89 (93) 4.20 (115) 6.04 (128) 6.95 (65) 7.21 (56) 8.97 (57) 8.33 (14) 4.34 (132)Norway
5.55 (108) 8.80 (2) 9.21 (34) 6.54 (89) 6.92 (67) 9.25 (35) 4.93 (116) 6.60 (31)Oman
5.63 (104) 7.36 (23) 7.88 (75) 7.38 (39) 7.86 (20) 8.69 (73) 8.12 (17) 6.75 (23)Pakistan
7.71 (24) 4.04 (118) 5.42 (133) 5.73 (116) 6.29 (102) 8.06 (89) 5.58 (92) 5.24 (109)Panama
8.05 (12) 5.39 (82) 8.74 (51) 8.18 (7) 6.78 (77) 9.00 (47) 5.39 (98) 5.94 (72)Exhibit 1.3 (continued): Area Economic Freedom Ratings (Ranks), 2008
Economic2010_260S_innen.indd 20 30.08.2010 12:34:25 Uhr
AREAS COMPONENTS OF AREA 5 1
Size of Government
2 Legal System &
Property Rights 3
Sound Money 4
Freedom to Trade Internationally
5
Regulation 5A
Credit Market Regulation
5b Labor Market
Regulation
5C Business Regulations
Rating (Rank) Rating (Rank) Rating (Rank) Rating (Rank) Rating (Rank) Rating (Rank) Rating (Rank) Rating (Rank)
Papua New Guinea
7.14 (42) 4.71 (96) 6.65 (109) 7.99 (11) 7.84 (21) 7.93 (97) 8.82 (9) 6.76 (22)Paraguay
7.45 (32) 3.53 (125) 8.58 (55) 7.57 (25) 5.62 (126) 7.52 (111) 3.59 (135) 5.73 (85)Peru
7.90 (16) 5.49 (76) 9.02 (41) 7.64 (21) 6.88 (70) 7.50 (113) 7.37 (38) 5.76 (82)Philippines
7.98 (15) 4.64 (101) 7.83 (78) 6.70 (80) 6.69 (84) 8.91 (64) 5.93 (83) 5.24 (108)Poland
5.59 (105) 5.94 (62) 9.21 (33) 7.05 (61) 6.72 (81) 8.75 (69) 6.52 (65) 4.89 (119)Portugal
5.67 (102) 6.81 (33) 9.55 (6) 7.23 (48) 6.24 (106) 7.60 (107) 5.18 (105) 5.93 (74)Romania
4.64 (129) 5.86 (66) 8.24 (66) 7.43 (34) 6.72 (80) 7.53 (110) 6.69 (64) 5.95 (70)Russia
7.27 (37) 5.73 (68) 8.43 (61) 5.77 (114) 5.91 (117) 7.50 (113) 6.07 (80) 4.14 (133)Rwanda
6.69 (60) 5.78 (67) 7.29 (96) 5.03 (132) 7.43 (40) 6.01 (130) 9.12 (5) 7.17 (12)Senegal
5.32 (114) 3.76 (122) 6.83 (103) 6.22 (101) 5.97 (114) 8.84 (66) 4.16 (127) 4.91 (118)Serbia
6.40 (70) 4.74 (94) 7.34 (94) 6.68 (81) 6.40 (97) 8.68 (74) 5.72 (88) 4.80 (122)Sierra Leone
6.52 (67) 3.35 (128) 7.19 (98) 5.00 (134) 5.66 (123) 5.31 (136) 5.68 (89) 6.00 (64)Singapore
8.17 (10) 8.38 (9) 9.10 (36) 9.34 (2) 8.50 (6) 9.75 (8) 7.74 (23) 8.01 (2)Slovak Republic
6.57 (63) 6.24 (50) 9.48 (17) 8.05 (10) 7.65 (27) 10.00 (1) 7.65 (28) 5.31 (103)Slovenia
5.20 (118) 6.02 (55) 9.42 (23) 7.25 (47) 6.81 (75) 8.98 (55) 5.43 (97) 6.01 (63)South Africa
5.33 (112) 6.33 (48) 7.60 (87) 6.76 (74) 7.25 (52) 9.44 (26) 6.09 (79) 6.23 (46)Spain
6.48 (68) 6.56 (42) 9.53 (11) 7.02 (63) 6.73 (79) 9.25 (34) 5.14 (106) 5.79 (81)Sri Lanka
6.81 (53) 5.02 (89) 5.85 (131) 5.97 (110) 6.50 (91) 7.29 (118) 6.82 (60) 5.37 (98)Sweden
3.61 (139) 8.47 (5) 9.37 (28) 7.69 (19) 7.24 (53) 9.50 (14) 5.13 (107) 7.10 (13)Switzerland
7.81 (21) 8.44 (6) 9.40 (25) 6.79 (71) 7.95 (15) 9.00 (47) 7.88 (21) 6.97 (17)Syria
5.43 (111) 4.72 (95) 6.93 (100) 5.48 (121) 4.47 (138) 3.01 (141) 5.37 (99) 5.01 (115)Taiwan
6.96 (49) 6.69 (35) 9.65 (3) 7.57 (27) 6.53 (90) 9.00 (47) 4.36 (125) 6.23 (47)Tanzania
4.10 (135) 5.97 (59) 7.40 (92) 6.00 (109) 6.42 (95) 7.96 (93) 6.04 (81) 5.27 (106)Thailand
7.42 (34) 5.94 (61) 6.98 (99) 7.57 (28) 7.41 (41) 9.00 (47) 7.28 (43) 5.95 (71)Togo
9.28 (2) 2.61 (138) 6.42 (114) 6.01 (106) 4.36 (139) 4.80 (137) 3.59 (136) 4.70 (125)Trinidad & Tobago
7.18 (40) 5.19 (86) 8.48 (58) 7.05 (60) 7.58 (32) 9.00 (47) 7.48 (34) 6.26 (44)Tunisia
5.26 (117) 6.64 (36) 6.77 (105) 6.57 (87) 6.98 (64) 8.17 (85) 6.17 (76) 6.60 (30)Turkey
7.44 (33) 5.61 (73) 8.57 (56) 6.41 (94) 6.05 (110) 7.47 (116) 4.38 (124) 6.28 (43)Uganda
7.20 (39) 4.68 (98) 8.77 (50) 6.71 (79) 8.00 (13) 8.70 (72) 9.09 (6) 6.22 (48)Ukraine
5.50 (109) 5.00 (91) 4.61 (138) 6.51 (91) 6.02 (112) 8.07 (88) 6.30 (71) 3.70 (138)Unit. Arab Emirates
7.12 (44) 7.19 (26) 8.25 (65) 8.47 (4) 7.63 (29) 7.90 (99) 7.53 (33) 7.45 (7)United Kingdom
6.02 (91) 8.11 (15) 9.41 (24) 7.63 (22) 7.89 (17) 8.96 (58) 7.98 (18) 6.71 (27)United States
7.13 (43) 7.50 (21) 9.69 (2) 7.57 (26) 7.89 (16) 7.74 (103) 9.20 (4) 6.73 (26)Uruguay
7.06 (46) 5.59 (74) 8.45 (60) 7.14 (54) 6.43 (94) 7.13 (121) 6.18 (74) 5.98 (67)Venezuela
5.09 (122) 2.91 (135) 5.30 (134) 3.52 (140) 4.82 (137) 8.25 (82) 3.14 (138) 3.07 (140)Vietnam
6.27 (80) 6.01 (56) 5.25 (135) 6.87 (68) 6.34 (100) 8.99 (54) 5.35 (100) 4.68 (126)Zambia
7.81 (20) 5.88 (65) 8.37 (62) 7.14 (53) 6.71 (83) 7.88 (100) 6.30 (72) 5.96 (68)Zimbabwe
4.56 (130) 3.72 (123) 0.00 (141) 4.72 (136) 4.85 (136) 5.84 (131) 5.31 (101) 3.40 (139)Exhibit 1.3 (continued): Area Economic Freedom Ratings (Ranks), 2008
Economic2010_260S_innen.indd 21 30.08.2010 12:34:26 Uhr
The Chain-Linked Summary Index, 1970–2008
The EFW data are available for many countries back to
. Through time, the index has become more com- prehensive and the available data more complete. As a result, the number and composition of the components for many countries will vary across time. This presents a problem similar to that confronted when calculating GDP or a price index over time when we know that the under- lying goods and services are changing from one year to another. In order to correct for this problem and assure comparability across time, we have done the same thing that statisticians analyzing national income do: we have chain-linked the data.
The base year for the chain-link index is , and as a result the chain-link index is not available for any countries added since that year. Changes in a coun- try’s chain-linked index through time are based only on changes in components that were present in adjoining years. For example, the chain-linked rating is based on the rating but is adjusted based on the changes in the underlying data between and for those components that were present in both years. If the com- mon components for a country in were the same as in , then no adjustment was made to the country’s
summary rating. However, if the components were lower than those for for the components pres- ent in both years, then the country’s summary rating was adjusted downward proportionally to reflect this fact.
Correspondingly, in cases where the ratings for the common components were higher in than for ,
the country’s summary rating was adjusted upward proportionally. The chain-linked ratings were constructed by repeating this procedure backward in time to and forward in time to . The chain-linked methodology means that a country’s rating will change across time peri- ods only when there is a change in ratings for components present during adjacent years. This is precisely what one would want when making comparisons across time periods.
Exhibit . shows the average chain-linked eco- nomic freedom index rating for the countries with ratings since . The average level of economic free- dom, as measured by the chain-linked EFW index, has increased to . in from . in ; however, the average rating fell marginally in the last year (from
to ). Much of the long-term increase was driven by reductions in marginal income-tax rates, if not aggregate taxation; improvements in monetary policy; and global trade liberalization.
The Chain-Linked Summary ratings for all years are found in Exhibit .. Researchers using the data for long- term studies should use these chain-linked data. These longitudinal data make it possible to follow the changes in economic freedom and analyze their impact over a lengthy period of time.
The chain-link methodology was also used to derive area ratings. The ratings (and rankings) for the chain- linked summary and area ratings are presented in the country tables. The country tables also present the unad- justed summary and area ratings, but when tracking rat- ings across time, the chain-link ratings will present a more accurate picture.
Exhibit 1.4: Average Chain-linked EFW Rating for the 102 countries with ratings since 1980
0 1 2 3 4 5 6 7 8 9 10
2008 2007
2006 2005
2000 1995
1990 1985
1980
5.53Av er age C hain-link ed EFW r ating
5.56 5.87 6.25 6.58 6.69 6.73 6.74 6.67
Economic2010_260S_innen.indd 22 30.08.2010 12:34:26 Uhr