2nd Quartile 3rd Quartile Least Free
Economic Freedom of the World
2011 Annual Report
James Gwartney Joshua Hall Robert Lawson
LIBERAL2EPORT
Economic Freedom of the World
2011 Annual Report
James Gwartney Robert Lawson Jos hua Hall
Florida State University Southern Methodist University Beloit College
with
Jean-Pierre Chauffour Michael D. Stroup
World Bank Stephen F. Austin State University
2011
Copyright © by the Fraser Institute. All rights reserved. No part of this book may be reproduced in any manner whatsoever without written permission except in the case of brief quotations embodied in critical articles and reviews.
The authors of this book have worked independently and opinions expressed by them are, therefore, their own and do not necessarily reflect the opinions of the supporters, trustees, or staff of the Fraser Institute. This publication in no way implies that the Fraser Institute, its trustees, or staff are in favor of, or oppose the passage of, any bill; or that they support or oppose any particular political party or candidate.
Published in cooperation with the Economic Freedom Network Editing, design, and typesetting by Lindsey Thomas Martin Cover design by Bill Ray
Printed and bound in Canada
Data available to researchers
The full data set, including all of the data published in this report as well as data omitted due to limited space, can be downloaded for free at <http://www.freetheworld.com>. The data file available there contains the most up-to-date and accurate data for the Economic Freedom of the World index. Some variable names and data sources have evolved over the years since the first publication in ; users should consult earlier editions of the Economic Freedom of the World annual reports for details regarding sources and descriptions for those years. All editions of the report are available in PDF and can be downloaded for free from <http://www.freetheworld.com/datasets_efw.html>. However, users are always strongly encouraged to use the data from this most recent data file as updates and corrections, even to earlier years’ data, do occur. Users doing long-term or longitudinal studies are encouraged to use the chain-linked index as it is the most consistent through time. If you have problems downloading the data, please contact Jean-François Minardi via e-mail to
<freetheworld@fraserinstitute.org> or via telephone +... ext. . If you have technical questions about the data itself, please contact Robert Lawson via e-mail to <rlawson@smu.edu>. Please cite the data set as:
Authors: James Gwartney, Robert Lawson, and Joshua Hall
Title: Economic Freedom Dataset, published in Economic Freedom of the World: Annual Report Publisher: Fraser Institute
Year:
URL: <http://www.freetheworld.com/datasets_efw.html>
Cite this publication
Authors: James Gwartney, Robert Lawson, and Joshua Hall Title: Economic Freedom of the World: Annual Report Publisher: Fraser Institute
Date of publication:
Digital copy available from <www.fraserinstitute.org> and <www.freetheworld.com>
Cataloguing Information Gwartney, James D.
Economic freedom of the world … annual report / James D. Gwartney.
Annual.
Description based on:
issue by James Gwartney, Robert Lawson, and Joshua Hall, with Jean-Pierre Chauffour and Michael D. Stroup.
Issued also online.
ISSN -X; ISBN ---- ( edition).
. Economic history--- --Periodicals. . Economic indicators--Periodicals.
I. Fraser Institute (Vancouver, B.C.) II. Title
Table of Contents
Executive Summary / v
Chapter 1 Economic Freedom of the World, 2009 / 1 Chapter 2 Country Data Tables / 25
Chapter 3 What Matters for Development—Freedom or Entitlement? / 167 by Jean-Pierre Chauffour
Chapter 4 Does Economic Freedom Promote Women’s Well-being? / 179 by Michael D. Stroup
Appendix Explanatory Notes and Data Sources / 191
About the Authors / 203 About the Contributors / 204 Acknowledgments / 205
About the Members of the Economic Freedom Network / 206
Production by COMDOK GmbH, Berlin.
Published by The Liberal Institute of the Friedrich-Naumann-Stiftung für die Freiheit,
Truman House, Potsdam Babelsberg.
Executive Summary
Economic Freedom of the World
The index published in Economic Freedom of the World measures the degree to which the policies and institutions of countries are supportive of economic freedom. The cornerstones of economic freedom are personal choice, voluntary exchange, freedom to compete, and security of privately owned property. Forty-two data points are used to construct a summary index and to measure the degree of economic freedom in five broad areas:
Size of Government: Expenditures, Taxes, and Enterprises;
Legal Structure and Security of Property Rights;
Access to Sound Money;
Freedom to Trade Internationally;
Regulation of Credit, Labor, and Business.
Economic freedom has suffered another setback
t ͳFDIBJOMJOLFETVNNBSZJOEFY FYIJCJU˞ˡQFSNJUTDPNQBSJTPOTPWFSUJNFͳFBWFSBHFFDPOPNJDGSFFEPN score rose from . (out of ) in to . in , but fell back to . in , and to . in , the most recent year for which data are available. (See chapter for a discussion.)
t *OUIJTZFBSTJOEFY)POH,POHSFUBJOTUIFIJHIFTUSBUJOHGPSFDPOPNJDGSFFEPN˦˝˞PVUPG˞˝ͳFPUIFSOB- tions among the top are: Singapore (.); New Zealand (.); Switzerland (.); Australia (.); Canada ˤ˥˞$IJMF ˤˤˤ6OJUFE,JOHEPN ˤˤ˞.BVSJUJVT ˤˣˤBOEUIF6OJUFE4UBUFT ˤˣ˝
t ͳFSBOLJOHT BOETDPSFTPGPUIFSMBSHFFDPOPNJFTBSF(FSNBOZ˟˞ ˤˡˢ+BQBO˟˟ ˤˡˡ'SBODFˡ˟ ˤ˞ˣ Italy, (.); Mexico, (.); Russia, (.); China, (.); India, (.); and Brazil, (.).
t ͳFCPUUPN˞˝OBUJPOTBSF;JNCBCXF ˡ˝˥.ZBONBS ˡ˞ˣ7FOF[VFMB ˡ˟˥"OHPMB ˡˤˣ%FNPDSBUJD Republic of Congo (.); Central African Republic (.); Guinea-Bissau (.); Republic of Congo (.);
Burundi (.); and Chad (.).
The world’s largest economy, the United States, has suffered one of the largest declines in economic freedom over the last years, pushing it into tenth place. Much of this decline is a result of higher government spending and borrowing and lower scores for the legal structure and property rights components. Over the longer term, the summary chain- linked ratings of Venezuela, Zimbabwe, United States, and Malaysia fell by eight-tenths of a point or more between
and , causing their rankings to slip.
The chain-linked summary ratings of Uganda, Zambia, Nicaragua, Albania, and Peru have increased by three
or more points since . The summary ratings of eight other countries—Bulgaria, Poland, El Salvador, Romania,
Ghana, Nigeria, Hungary, and Guinea-Bissau—increased by between two and three points during this same period.
Nations that are economically free out-perform non-free nations in indicators of well-being
t /BUJPOTJOUIFUPQRVBSUJMFPGFDPOPNJDGSFFEPNIBEBOBWFSBHFQFSDBQJUB(%1PGˠ˞ˢ˝˞JO˟˝˝˦DPNQBSFE UPˡˢˡˢGPSUIPTFOBUJPOTJOUIFCPUUPNRVBSUJMFJODPOTUBOU˟˝˝ˢJOUFSOBUJPOBMEPMMBST FYIJCJU˞˦
t /BUJPOTJOUIFUPQRVBSUJMFPGFDPOPNJDGSFFEPNIBEBOBWFSBHFHSPXUIJOQFSDBQJUB(%1CFUXFFO˞˦˦˝BOE
of .%, compared to .% for those nations in the bottom quartile, in constant international dollars (exhibit .).
t *OUIFUPQRVBSUJMFUIFBWFSBHFJODPNFPGUIFQPPSFTU˞˝PGUIFQPQVMBUJPOXBT˥ˤˠˢDPNQBSFEUP˞˝ˣ˞
for those in the bottom quartile, in constant international dollars (exhibit .). Interestingly, the aver- age income of the poorest % in the top quartile is almost double the overall income per capita in the bot- UPNRVBSUJMF ˡˢˡˢFYIJCJU˞˦UIFQPPSFTUQFPQMFJOUIFNPTUFDPOPNJDBMMZGSFFDPVOUSJFTBSFOFBSMZUXJDF as rich as the average people in the least free countries.
t -JGFFYQFDUBODZJTˤ˦ˡZFBSTJOUIFUPQRVBSUJMFDPNQBSFEUPˣ˝ˤZFBSTJOUIFCPUUPNRVBSUJMF FYIJCJU˞˞ˠ t ͳF˞˟ˢQFSEBZQPWFSUZSBUFJT˟ˤJOUIFUPQRVBSUJMFDPNQBSFEUPˡ˞ˢJOUIFCPUUPNRVBSUJMF FYIJCJU˞˞ˤ
Chapter 1: Economic Freedom of the World
The principal authors of the report, James Gwartney (Florida State University), Robert Lawson (Southern Methodist University), and Joshua Hall (Beloit College), provide an overview of the report and discuss why economic freedom is important.
Chapter 2: Country Data Tables
Detailed historical data is provided for each of the countries and territories in the index. For many countries, this covers years , , , , , , , and .
Chapter 3: What Matters for Development: Freedom or Entitlement?
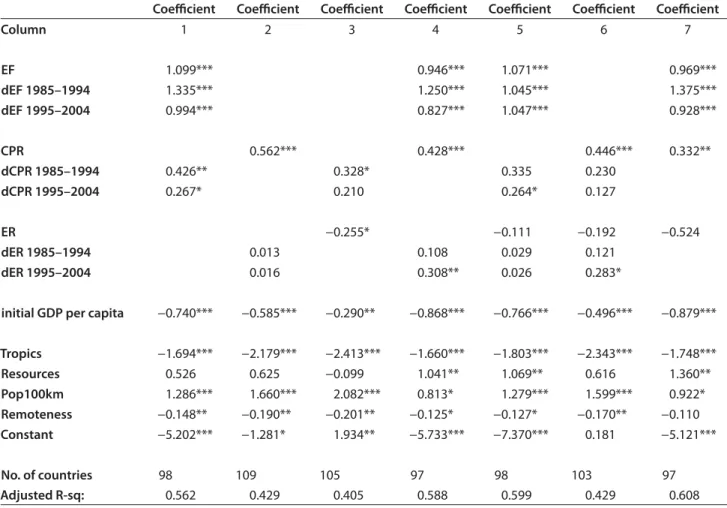
Jean-Pierre Chauffour, Lead Economist, Middle East and North Africa Region, World Bank, examines policies that promote “freedom” compared to “entitlement” in relation to economic development. He notes that, depending on the balance between free choices and more coerced decisions, individual opportunities to learn, own, work, save, invest, trade, protect, and so forth could vary greatly across countries and over time. Chauffour’s empirical findings suggest that fundamental freedoms are paramount in explaining long-term economic growth. For a given set of exogenous conditions, countries that favor free choice—economic freedom and civil and political liberties—over entitlement rights are likely to achieve higher sustainable economic growth and to achieve many of the distinctive proximate characteristics of success identified by the Commission on Growth and Development (World Bank, ). In contrast, pursuing entitlement rights through greater coercion by the state is likely to be self-defeating in the long run.
These findings provide potentially important policy lessons for all countries. For developed countries, they sug- gest that prioritizing economic freedom over social entitlements could be an effective way to reform the welfare state and make it more sustainable and equitable in the long run. For middle-income countries (such as countries in the midst of the Arab Spring and countries in Asia and Latin America), they indicate that the quest for civil and political rights and for economic freedom could create the conditions for new social contracts. For low-income countries, they provide an opportunity to reflect on the achievements under the Millennium Development Goals (MDG) and the potential role that economic freedom and other fundamental freedoms that could play in a post- MDG development agenda.
Chapter 4: Does Economic Freedom Promote Women’s Wellbeing?
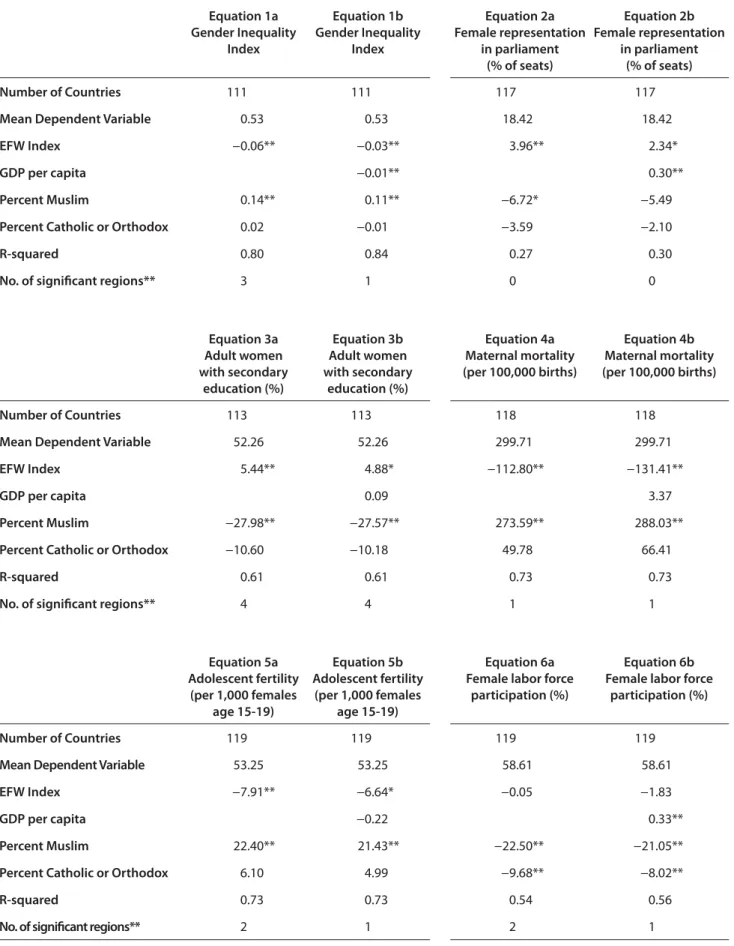
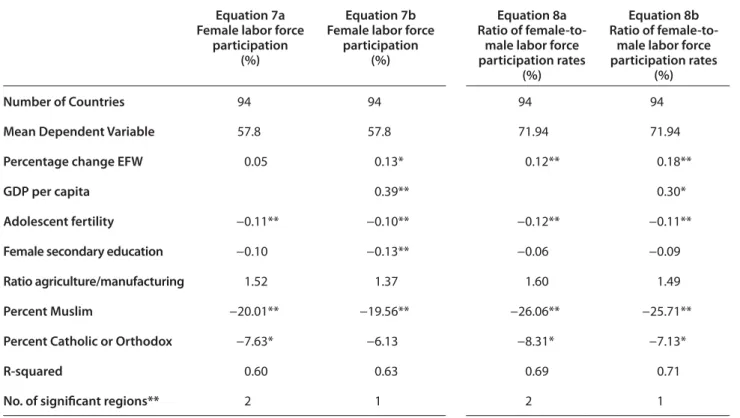
Michael D. Stroup, Stephen F. Austin State University, examined the impact of economic freedom on women’s well- being based on a recent United Nations Development Project (UNDP) report. He finds that a one-point increase in the average EFW index, controlling for other relevant factors, was found to be associated with:
5 R5 a decline in the UNDP Gender Inequality (GI) index of . with the sample average at .;
5 R5 a decline in the maternal death rate by women per , births with the sample average at ;
5 R5 a reduction of over six births per , births to females age – when the sample average is ;
5 R5 an increase of almost five percentage points in the percentage of women with a secondary education when the sample average is %;
5 R5 an increase of two percentage points in the number of women holding seats in parliament in the legislative branch of a national government when the sample average is %.
Data available to researchers
The full data set, including all of the data published in this report as well as data omitted due to limited space, can be downloaded for free at <http://www.freetheworld.com> . The data file available there contains the most up-to-date and accurate data for the Economic Freedom of the World index. Some variable names and data sources have evolved over the years since the first publication in ; users should consult earlier editions of the Economic Freedom of the World annual reports for details regarding sources and descriptions for those years. All editions of the report are available in PDF and can be downloaded for free from <http://www.freetheworld.com/datasets_efw.html> . However, users are always strongly encouraged to use the data from this most recent data file as updates and corrections, even to earlier years’
data, do occur. Users doing long-term or longitudinal studies are encouraged to use the chain-linked index as it is the most consistent through time. If you have problems downloading the data, please contact Jean-François Minardi via e-mail to <freetheworld@fraserinstitute.org> or via telephone +... ext. . If you have technical questions about the data itself, please contact Robert Lawson via e-mail to <rlawson@smu.edu> . Please cite the data set as:
Authors: James Gwartney, Robert Lawson, and Joshua Hall
Title: Economic Freedom Dataset, published in Economic Freedom of the World: Annual Report Publisher: Fraser Institute
Year:
URL: <http://www.freetheworld.com/datasets_efw.html>
This year’s Economic Freedom of the World reflects a quarter of a century of research and development in the measurement of economic freedom. Numerous scholars, including Nobel Prize winners Milton Friedman, Douglass North, and Gary Becker, have contributed to this project.
The EFW measure now covers countries and provides reliable data for approximately of them back to .
The concept of economic freedom
The key ingredients of economic freedom are:
t QFSTPOBMDIPJDF
t WPMVOUBSZFYDIBOHFDPPSEJOBUFECZNBSLFUT t GSFFEPNUPFOUFSBOEDPNQFUFJONBSLFUTBOE t QSPUFDUJPOPGQFSTPOTBOEUIFJSQSPQFSUZGSPN
aggression by others.
These four cornerstones imply that economic freedom is present when individuals are permitted to choose for themselves and engage in voluntary transactions as long as they do not harm the person or property of others.
Individuals have a right to decide how they will use their time, talents, and resources, but they do not have a right to the time, talents, and resources of others. Put another way, individuals do not have a right to take things from others or demand that others provide things for them. Use of vio- lence, theft, fraud, and physical invasions are not permis- sible but, otherwise, individuals are free to choose, trade, and cooperate with others, and compete as they see fit.
In an economically free society, the primary role of government is to protect individuals and their property from aggression by others. The EFW index is designed to measure the extent to which the institutions and policies of a nation are consistent with this protective function. In order to achieve a high EFW rating, a country must pro- vide secure protection of privately owned property, even- handed enforcement of contracts, and a stable monetary environment. It also must keep taxes low, refrain from creating barriers to both domestic and international trade, and rely more fully on markets rather than the political process to allocate goods and resources.
Why economic freedom is important
Numerous scholarly articles have used the EFW data to examine the relationship between economic freedom and various measures of economic and social performance.
This research indicates why economic freedom is vitally important to a society. We will mention just four areas of research below. Exhibt . provides a list of selected schol- arly articles in each of these areas.
1 Economic freedom and investment, income, and growth Economic freedom leads to more investment, higher per- capita incomes, and growth rates. Dozens of studies have investigated the relationship between economic freedom on the one hand and investment, economic growth, and per person income on the other. These studies typically control for geographic, locational, political, educational, and numerous other factors. Most of them have found that higher levels of economic freedom, or certain components of economic freedom, exert an independent positive impact on investment, economic growth, and income per capita.
2 Economic freedom, reductions in poverty, and improvements in human welfare
Economic freedom leads to less poverty and improvements in the general living conditions of a society. Critics some- times charge that economic freedom and market allocation often result in the poor being left behind but research in this area is inconsistent with this view. As seen in exhibit
. at the end of this chapter, countries with persistently high levels of economic freedom have lower poverty rates.
Moreover, those that move toward more economic freedom enjoy better living standards across multiple dimensions.
3 Economic freedom, cooperation, tolerance, and peaceful relations Economic freedom encourages cooperation, tolerance, and peaceful relations. Voluntary exchange is the cen- terpiece of economically free economies. Both parties to an exchange gain and therefore buyers and sellers are encouraged to interact with those who give them the best deal, regardless of their racial, religious, ethnic, gender, or
Chapter 1
Economic Freedom of the World, 2009
tribal characteristics. Markets reward those who serve others, including those they do not necessarily like. When markets thrive, people with vastly different characteris- tics often interact peacefully with each other. In turn, the peaceful interaction among diverse groups encourages tol- erance and promotes understanding. In contrast, political allocation promotes divisiveness and polarization. When resources are allocated politically, individuals and groups get ahead by taking from others or imposing regulations that provide them with an advantage relative to others.
This encourages various groups to bind together in order to gain advantages relative to other groups. Thus, politi- cal allocation leads to polarization and bitterness toward groups favored by the political process. In cases where a racial, religious, ethnic, or tribal group forms a majority, the political process is often used to oppress the minority. The empirical studies are consistent with this view. Countries with higher levels of economic freedom are less likely to experience both internal and external use of violence.
4 Economic freedom, entrepreneurship, and honesty in government Economic freedom leads to entrepreneurial business activity; political allocation leads to crony capitalism and political corruption. When the function of government
is limited to protection of people and their property and even-handed enforcement of contracts and settlement of disputes, entrepreneurs will get ahead by discovering highly valued products and lower-cost methods of produc- tion. Profits will direct resources toward productive proj- ects—those that increase the value of resources. Similarly, losses will channel resources away from wasteful projects that reduce the value of resources. When resources are allocated by political decision-making, a system of crony capitalism will emerge. Predictably, politicians will allo- cate resources toward the politically powerful—those who can provide them with the most votes, campaign funds, high-paying jobs for political allies and, yes, even bribes.
Unlike true entrepreneurs, crony capitalists do not create wealth; instead they form a coalition with political offi- cials to plunder wealth from taxpayers and other citizens.
Will goods and resources be directed by markets or political officials? This is the great debate of our time.
This debate highlights the importance of an accurate and objective measure of economic freedom. The index pub- lished in Economic Freedom of the World provides a mea- sure that will help one track the direction of this debate, which is sure to affect the prosperity of the world in the years immediately ahead.
Exhibit 1.1: Selected scholarly articles on the importance of economic freedom
1 Economic freedom and investment, income, and growth
Aixala, J., and G. Fabro (2009). Economic Freedom, Civil Liberties, Political Rights and Growth: A Causality Analysis. Spanish Economic Review 11, 3: 165–178.
Azman-Saini, W.N.W., A.Z. Baharumshah, and S.H. Law (2010). Foreign Direct Investment, Economic Freedom and Economic Growth: International Evidence. Economic Modelling 27, 5: 1079–1089.
Berggren, Niclas (2003). The Benefits of Economic Freedom: A Survey. Public Choice 8, 2: 193–211.
Bergh, A., and M. Karlsson (2010). Government Size and Growth: Accounting for Economic Freedom and Globalization.
Public Choice 142, 1-2: 195–213.
Carlsson, F., and S. Lundstrom (2002). Economic Freedom and Growth: Decomposing the Effects. Public Choice 112, 3-4:
335–344.
Cole, Julio H. (2003). The Contribution of Economic Freedom to World Economic Growth. Cato Journal 23, 2: 189–198.
Dawson, J.W. (1998). Institutions, Investment, and Growth: New Cross-Country and Panel Data Evidence. Economic Inquiry 36, 4: 603–619.
de Haan, J., S. Lundstrom, and J.-E. Sturm (2006). Market-Oriented Institutions and Policies and Economic Growth: A Critical Survey. Journal of Economic Surveys 20, 2: 157–191.
de Hann, J., and J.-E. Sturm (2000). On the Relationship between Economic Freedom and Growth. European Journal of Political Economy 16, 2: 215–241.
Djankov, S., T. Ganser, C. McLiesh, R. Ramalho, and A. Shleifer (2010). The Effect of Corporate Taxes on Investment and Entrepreneurship. American Economic Journal-Macroeconomics 2, 3: 31–64.
Fabro, G., and J. Aixala (2009). Economic Growth and Institutional Quality: Global and Income-Level Analyses. Journal of Economic Issues 43, 4: 997–1023.
Faria, H.J., and H.M. Montesinos (2009). Does Economic Freedom Cause Prosperity? An IV Approach. Public Choice 141, 1-2: 103–127.
Gwartney, J.D., R.G. Holcombe, and R.A. Lawson (2006). Institutions and the Impact of Investment on Growth. Kyklos 59, 2: 255–273.
Gwartney, J.D., R.A. Lawson, and R.G. Holcombe (1999). Economic Freedom and the Environment for Economic Growth.
Journal of Institutional and Theoretical Economics—Zeitschrift fur die Gesamte Staatswissenschaft 155, 4: 643–663.
Hall, J.C., R.S. Sobel, and G.R. Crowley (2010). Institutions, Capital, and Growth. Southern Economic Journal 77, 2: 385–405.
Harms, P., and H.W. Ursprung (2002). Do Civil and Political Repression Really Boost Foreign Direct Investments? Economic Inquiry 40, 4: 651–663.
Heckelman, J.C., and S. Knack (2009). Aid, Economic Freedom, and Growth. Contemporary Economic Policy 27, 1: 46–53.
Heckelman, J.C., and M.D. Stroup (2000). Which Economic Freedoms Contribute to Growth? Kyklos 53, 4: 527–544.
Justesen, M.K. (2008). The Effect of Economic Freedom on Growth Revisited: New Evidence on Causality from a Panel of Countries 1970–1999. European Journal of Political Economy 24, 3: 642–660.
Lothian, J.R. (2006). Institutions, Capital Flows and Financial Integration. Journal of International Money and Finance 25, 3:
358–369.
N’Da, K., A. Robin, and T. Tribunella (2009). Economic Freedom and the Impact of Technology on Productivity. Journal of Global Information Management 17, 3: 42–58.
Scully, G.W. (2002). Economic Freedom, Government Policy and the Trade-Off between Equity and Economic Growth. Public Choice 113, 1-2: 77–96.
2 Economic freedom, reductions in poverty, and improvements in human welfare
Ashby, N.J. (2010). Freedom and International Migration. Southern Economic Journal 77, 1: 49–62.
Bjornskov, C., A. Dreher, and J.V.A. Fischer (2008). Cross-Country Determinants of Life Satisfaction: Exploring Different Determinants across Groups in Society. Social Choice and Welfare 30, 1: 119–173.
Bjornskov, C., A. Dreher, and J.V.A. Fischer (2010). Formal Institutions and Subjective Well-Being: Revisiting the Cross- Country Evidence. European Journal of Political Economy 26, 4: 419–430.
Connors, Joseph (2011). Global Poverty: The Role of Economic Freedom, Democracy, and Foreign Aid. Ph.D. dissertation, Department of Economics, Florida State University.
Connors, Joseph, and James D. Gwartney (2010). Economic Freedom and Global Poverty. In Mark D. White, ed., Accepting the Invisible Hand (Palgrave Macmillan): 43–68.
de Soysa, I., and E. Neumayer (2005). False Prophet, or Genuine Savior? Assessing the Effects of Economic Openness on Sustainable Development, 1980–99. International Organization 59, 3: 731–772.
Leeson, P. (2010). Two cheers for capitalism? Society 47, 3: 227–233.
Ott, J. (2010). Greater Happiness for a Greater Number: Some Non-Controversial Options for Governments. Journal of Happiness Studies 11, 5: 631–647.
Ott, J.C. (2010). Good Governance and Happiness in Nations: Technical Quality Precedes Democracy and Quality Beats Size.
Journal of Happiness Studies 11, 3: 353–368.
Shleifer, A. (2009). The Age of Milton Friedman. Journal of Economic Literature 47, 1: 123–135.
Stroup, M.D. (2007). Economic Freedom, Democracy, and the Quality of Life. World Development 35, 1: 52–66.
Stroup, M.D. (2008). Separating the Influence of Capitalism and Democracy on Women's Well-Being. Journal of Economic Behavior & Organization 67, 3-4: 560–572.
3 Economic freedom, cooperation, tolerance, and peaceful relations
Burkhart, R.E. (2002). The Capitalist Political Economy and Human Rights: Cross-National Evidence. Social Science Journal 39, 2: 155–170.
de Soysa, I., and H. Fjelde (2010). Is the Hidden Hand an Iron Fist? Capitalism and Civil Peace, 1970–2005. Journal of Peace Research 47, 3: 287–298.
Eriksen, S., and I. de Soysa (2009). A Fate Worse than Debt? International Financial Institutions and Human Rights, 1981–2003.
Journal of Peace Research 46, 4: 485–503.
Gartzke, E. (2007). The Capitalist Peace. American Journal of Political Science 51, 1: 166–191.
The Economic Freedom of the World index, 2009
The construction of the index published in Economic Freedom of the World is based on three important method- ological principles. First, objective components are always preferred to those that involve surveys or value judgments.
Given the multi-dimensional nature of economic freedom and the importance of legal and regulatory elements it is sometimes necessary to use data based on surveys, expert panels, and generic case studies. To the fullest extent possible, however, the index uses objective components.
Second, the data used to construct the index ratings are from external sources such as the International Monetary Fund, World Bank, and World Economic Forum that pro- vide data for a large number of countries. Data provided directly from a source within a country are rarely used, and only when the data are unavailable from international sources. Importantly, the value judgments of the authors or others in the Economic Freedom Network are never used to alter the raw data or the rating of any country.
Third, transparency is present throughout. The report pro- vides information about the data sources, the methodol- ogy used to transform raw data into component ratings, and how the component ratings are used to construct both the area and summary ratings. Complete methodological
details can be found in the Appendix: Explanatory Notes and Data Sources (pp. ). The entire data set used in the construction of the index is freely available to researchers at <www.freetheworld.com> .
Exhibit . indicates the structure of the EFW index.
The index measures the degree of economic freedom pres- ent in five major areas: [] Size of Government: Expenditures, and Taxes, Enterprises; [] Legal Structure and Security of Property Rights; [] Access to Sound Money; [] Freedom to Trade Internationally; [] Regulation of Credit, Labor, and Business.
Within the five major areas, there are compo- nents in this year’s index. Many of those components are themselves made up of several sub-components. In total, the index comprises distinct variables. Each compo- nent and sub-component is placed on a scale from to
that reflects the distribution of the underlying data. The sub-component ratings are averaged to determine each component. The component ratings within each area are then averaged to derive ratings for each of the five areas.
In turn, the five area ratings are averaged to derive the summary rating for each country. The following section provides an overview of the five major areas.
Strong, M. (2009). Peace through Access to Entrepreneurial Capitalism for All. Journal of Business Ethics 89: 529–538.
Kurrild-Klitgaard, P., M.K. Justesen, and R. Klemmensen (2006). The Political Economy of Freedom, Democracy and Transnational Terrorism. Public Choice 128, 1-2: 289–315.
Steinberg, D.A., and S.M. Saideman (2008). Laissez Fear: Assessing the Impact of Government Involvement in the Economy on Ethnic Violence. International Studies Quarterly 52, 2: 235–259.
4 Economic freedom, entrepreneurship, and honesty in government
Bjornskov, C., and N.J. Foss (2008). Economic Freedom and Entrepreneurial Activity: Some Cross-Country Evidence. Public Choice 134, 3-4: 307–328.
Carden, A., and L. Verdon (2010). When Is Corruption a Substitute for Economic Freedom? Law and Development Review 3, 1:
41–62.
Dreher, A., C. Kotsogiannis, and S. McCorriston (2007). Corruption around the World: Evidence from a Structural Model.
Journal of Comparative Economics 35, 3: 443–466.
Freytag, A., and R. Thurik (2007). Entrepreneurship and Its Determinants in a Cross-Country Setting. Journal of Evolutionary Economics 17, 2: 117–131.
Heckleman, J., and B. Powell (2010). Corruption and the Environment for Growth. Comparative Economic Studies 52, 3:
351–378.
Swaleheen, M., and D. Stansel (2007). Economic Freedom, Corruption, and Growth. Cato Journal 27, 3: 343–358.
Nystrom, K. (2008). The Institutions of Economic Freedom and Ewntrepreneurship: Evidence from Panel Data. Public Choice 136, 3-4: 269–282.
Quinn, J.J. (2008). The Effects of Majority State Ownership of Significant Economic Sectors on Corruption: A Cross-Regional Comparison. International Interactions 34, 1: 84–128.
Exhibit 1.2: The Areas, Components, and Sub-Components of the EFW Index
GCR = Global Competitiveness Report; ICRG = International Country Risk Guide; DB = Doing Business.
See Appendix: Explanatory Notes and Data Sources (page 191) for bibliographical information.
1 Size of Government: Expenditures, Taxes, and Enterprises
A General government consumption spending as a percentage of total consumption
B Transfers and subsidies as a percentage of GDP C Government enterprises and investment D Top marginal tax rate
i Top marginal income tax rate
ii Top marginal income and payroll tax rates
2 Legal Structure and Security of Property Rights A Judicial independence (GCR)
B Impartial courts (GCR)
C Protection of property rights (GCR) D Military interference in rule of law and
the political process (ICRG) E Integrity of the legal system (ICRG) F Legal enforcement of contracts (DB)
G Regulatory restrictions on the sale of real property (DB)
3 Access to Sound Money A Money growth
B Standard deviation of inflation C Inflation: Most recent year
D Freedom to own foreign currency bank accounts
4 Freedom to Trade Internationally A Taxes on international trade
i Revenues from trade taxes (% of trade sector) ii Mean tariff rate
iii Standard deviation of tariff rates
B Regulatory trade barriers i Non-tariff trade barriers (GCR)
ii Compliance cost of importing & exporting (DB) C Size of trade sector relative to expected
D Black-market exchange rates E International capital market controls
i Foreign ownership / investment restrictions (GCR) ii Capital controls
5 Regulation of Credit, Labor, and Business A Credit market regulations
i Ownership of banks ii Foreign bank competition iii Private sector credit
iv Interest rate controls / negative real interest rates B Labor market regulations
i Hiring regulations and minimum wage (DB) ii Hiring and firing regulations (GCR)
iii Centralized collective bargaining (GCR) iv Hours regulations (DB)
v Mandated cost of worker dismissal (DB) vi Conscription
C Business regulations i Price controls
ii Administrative requirements (GCR) iii Bureaucracy costs (GCR)
iv Starting a business (DB)
v Extra payments / bribes / favoritism (GCR) vi Licensing restrictions (DB)
vii Cost of tax compliance (DB)
Area 1: Size of Government: Expenditures, Taxes, and Enterprises
The four components of Area indicate the extent to which countries rely on the political process to allocate resources and goods and services. When government spending increases relative to spending by individuals, households, and businesses, government decision-making is substituted for personal choice and economic freedom is reduced. The first two components address this issue. Government con- sumption as a share of total consumption ( 1A ) and trans- fers and subsidies as a share of GDP (1B) are indicators of the size of government. When government consumption is a larger share of the total, political choice is substituted for personal choice. Similarly, when governments tax some people in order to provide transfers to others, they reduce the freedom of individuals to keep what they earn.
The third component (1C) in this area measures the extent to which countries use private rather than government enterprises to produce goods and services.
Government firms play by rules that are different from those to which private enterprises are subject. They are not dependent on consumers for their revenue or on investors for capital. They often operate in protected mar- kets. Thus, economic freedom is reduced as government enterprises produce a larger share of total output.
The fourth component (1D) is based on (1Di) the top marginal income tax rate and (1Dii) the top marginal income and payroll tax rate and the income threshold at which these rates begin to apply. These two sub-components are averaged to calculate the top marginal tax rate (1D). High marginal tax rates that apply at relatively low income levels are also indicative of reliance upon government. Such rates deny individuals the fruits of their labor. Thus, countries with high marginal tax rates and low income thresholds are rated lower.
Taken together, the four components of Area measure the degree to which a country relies on personal choice and markets rather than government budgets and political decision-making. Therefore, countries with low levels of government spending as a share of the total, a smaller government enterprise sector, and lower marginal tax rates earn the highest ratings in this area.
Area 2: Legal Structure and Security of Property Rights Protection of persons and their rightfully acquired property is a central element of economic freedom and a civil society.
Indeed, it is the most important function of government.
Area focuses on this issue. The key ingredients of a legal system consistent with economic freedom are rule of law, security of property rights, an independent judiciary, and
an impartial court system. Components indicating how well the protective function of government is performed were assembled from three primary sources: the International Country Risk Guide, the Global Competitiveness Report, and the World Bank’s Doing Business project.
Security of property rights, protected by the rule of law, provides the foundation for both economic free- dom and the efficient operation of markets. Freedom to exchange, for example, is meaningless if individuals do not have secure rights to property, including the fruits of their labor. When individuals and businesses lack confidence that contracts will be enforced and the fruits of their pro- ductive efforts protected, their incentive to engage in pro- ductive activity is eroded. Perhaps more than any other area, this area is essential for the efficient allocation of resources.
Countries with major deficiencies in this area are unlikely to prosper regardless of their policies in the other four areas.
Area 3: Access to Sound Money
Money oils the wheels of exchange. An absence of sound money undermines gains from trade. As Milton Friedman informed us long ago, inflation is a monetary phenom- enon, caused by too much money chasing too few goods.
High rates of monetary growth invariably lead to inflation.
Similarly, when the rate of inflation increases, it also tends to become more volatile. High and volatile rates of infla- tion distort relative prices, alter the fundamental terms of long-term contracts, and make it virtually impossible for individuals and businesses to plan sensibly for the future.
Sound money is essential to protect property rights and, thus, economic freedom. Inflation erodes the value of property held in monetary instruments. When govern- ments finance their expenditures by creating money, in effect, they are expropriating the property and violating the economic freedom of their citizens.
The important thing is that individuals have access to sound money: who provides it makes little difference.
Thus, in addition to data on a country’s inflation and its government’s monetary policy, it is important to consider how difficult it is to use alternative, more credible, cur- rencies. If bankers can offer saving and checking accounts in other currencies or if citizens can open foreign bank accounts, then access to sound money is increased and economic freedom expanded.
There are four components in Area of the EFW index. All of them are objective and relatively easy to obtain and all have been included in the earlier editions of the index. The first three are designed to measure the consistency of monetary policy (or institutions) with long-term price stability. Component 3D is designed to
measure the ease with which other currencies can be used via domestic and foreign bank accounts. In order to earn a high rating in this area, a country must follow policies and adopt institutions that lead to low (and stable) rates of inflation and avoid regulations that limit the ability to use alternative currencies.
Area 4: Freedom to Trade Internationally
In our modern world of high technology and low costs for communication and transportation, freedom of exchange across national boundaries is a key ingredient of economic freedom. Many goods and services are now either pro- duced abroad or contain resources supplied from abroad.
Voluntary exchange is a positive-sum activity: both trad- ing partners gain and the pursuit of the gain provides the motivation for the exchange. Thus, freedom to trade inter- nationally also contributes substantially to our modern living standards.
In response to protectionist critics and special- interest politics, virtually all countries adopt trade restric- tions of various types. Tariffs and quotas are obvious exam- ples of roadblocks that limit international trade. Because they reduce the convertibility of currencies, controls on the exchange rate also hinder international trade. The vol- ume of trade is also reduced if the passage of goods through customs is onerous and time consuming. Sometimes these delays are the result of administrative inefficiency while in other instances they reflect the actions of corrupt officials seeking to extract bribes. In both cases, economic free- dom is reduced.
The components in this area are designed to mea- sure a wide variety of restraints that affect international exchange: tariffs, quotas, hidden administrative restraints, and exchange rate and capital controls. In order to get a high rating in this area, a country must have low tariffs, a trade sector larger than expected, easy clearance and efficient administration of customs, a freely convertible currency, and few controls on the movement of capital.
Area 5: Regulation of Credit, Labor, and Business When regulations restrict entry into markets and inter-
fere with the freedom to engage in voluntary exchange, they reduce economic freedom. The fifth area of the index focuses on regulatory restraints that limit the freedom of exchange in credit, labor, and product markets. The first component (5A) reflects conditions in the domestic credit market. The first two sub-components provide evidence on the extent to which the banking industry is dominated by private firms and whether foreign banks are permitted to compete in the market. The final two sub-components
indicate the extent to which credit is supplied to the pri- vate sector and whether controls on interest rates inter- fere with the market in credit. Countries that use a private banking system to allocate credit to private parties and refrain from controlling interest rates receive higher rat- ings for this regulatory component.
Many types of labor-market regulations infringe on the economic freedom of employees and employ- ers. Among the more prominent are minimum wages, dismissal regulations, setting of wages by a centralized agency, extension of union contracts to non-participating parties, and military conscription. The labor-market com- ponent (5B) is designed to measure the extent to which these restraints upon economic freedom are present. In order to earn high marks in the component rating regu- lation of the labor market, a country must allow market forces to determine wages and establish the conditions of hiring and firing, and refrain from the use of conscription.
Like the regulation of credit and labor markets, the regulation of business activities (5C) inhibits economic freedom. The sub-components of 5C are designed to iden- tify the extent to which regulations and bureaucratic pro- cedures restrain entry and reduce competition. In order to earn a high score in this portion of the index, countries must allow markets to determine prices and refrain from regulatory activities that retard entry into business and increase the cost of producing products. They also must refrain from “playing favorites,” that is, from using their power to extract financial payments and reward some businesses at the expense of others.
Construction of Summary and Area ratings
Theory provides us with direction regarding elements that should be included in the five areas and the summary index, but it does not indicate what weights should be attached to the components within the areas or among the areas in the construction of the summary index. It would be nice if these factors were independent of each other and a weight could be attached to each of them. During the past several years, we have investigated several methods of weighting the various components, including principle component analysis and a survey of economists. We have also invited others to use their own weighting structure if they believe that it is preferable. In the final analysis, the summary index is not very sensitive to substantial variations in the weights.
Furthermore, there is reason to question whether
the areas (and components) are independent or work
together as a team. Put another way, they may be linked
more like the wheels, motor, transmission, drive shaft, and
frame of a car. Just as it is the bundle of these factors that
underlies the mobility of an auto, it may be a bundle of fac- tors that underlies the composition of economic freedom.
With regard to an automobile, which is more important for mobility: the motor, wheels, or transmission? The question cannot be easily answered because the parts work together.
If any of these key parts break down, the car is immobile.
Institutional quality may be much the same. If any of the key parts are absent, the overall effectiveness is undermined.
As the result of these two considerations, we orga- nize the elements of the index in a manner that seems sen- sible to us but we make no attempt to weight the compo- nents in any special way when deriving either area or sum- mary ratings. Of course, the data for the components and sub-components are available to researchers who would like to consider alternative weighting schemes and we encourage them to do so.
Summary Economic Freedom Ratings, 2009
Exhibit . presents summary economic freedom ratings, sorted from highest to lowest. These ratings are for the year , the most recent year for which comprehensive EBUBBSFBWBJMBCMF)POH,POHBOE4JOHBQPSFPODFBHBJO occupy the top two positions. The other nations in the top are New Zealand, Switzerland, Australia, Canada,
$IJMF 6OJUFE ,JOHEPN .BVSJUJVT BOE UIF 6OJUFE States. The rankings of other major countries include Germany (st), Japan (ⁿd,PSFB ˠ˝t), France (ⁿd), Spain (t), Italy (t), Mexico (t), Russia (st), China (
nd), India (t), and Brazil (ⁿd). The ten lowest-rated
countries are Chad, Burundi, Republic of Congo, Guinea- Bissau, Central African Republic, Democratic Republic of Congo, Angola, Venezuela, Myanmar, and, again in last place, Zimbabwe.
The EFW index is calculated back to as the availability of data allows; see the Country Data Tables in chapter or our website, <http://www.freetheworld.com> , for information from past years. Because some data for earlier years may have been updated or corrected, researchers are always encouraged to use the data from the most recent annual report to assure the best-quality data.
Area Economic Freedom Ratings (and Rankings), 2009
Exhibit . presents the ratings (and, in parentheses, the rankings) for each of the five areas of the index and for components 5A, 5B, and 5C. A number of interesting patterns emerge from an analysis of these datas. High- income industrial economies generally rank quite high for Legal Structure and Security of Property Rights (Area 2), Access to Sound Money (Area 3), and Freedom to Trade Internationally (Area 4). Their ratings were lower, how- ever, for Size of Government: Expenditures, Taxes, and Enterprises (Area 1) and Regulation of Credit, Labor, and Business (Area 5). This was particularly true for western European countries.
On the other hand, a number of developing nations have a small fiscal size of government, but rate poorly in other areas. Madagascar and Togo illustrate this point.
Madagascar ranks fourth and Togo second for size of government (Area 1). However, Madagascar ranks ⁿd in Area , t in Area , t in Area , and its sum- mary rating places it t. In a similar fashion, Togo ranks
t in Area , t in Area , t in Area , and its overall summary ranking is rd. Clearly, a small size
of government is insufficient for the provision of eco- nomic freedom. The institutions of economic freedom, such as the rule of law and property rights, as well as sound money, trade openness, and sensible regulation are also required.
Weakness in the rule of law and property rights is particularly pronounced in sub-Saharan Africa, among Islamic nations, and for several nations that were part of the former Soviet bloc, though some of these nations have made strides toward improvement. Many Latin American and Southeast Asian nations also score poorly for rule of law and property rights. The nations that rank poorly in this category also tend to score poorly in the trade and reg- ulation areas, even though several have reasonably sized governments and sound money.
The economies most open to foreign trade are Hong ,POHBOE4JOHBQPSFXIJMFUIFNPTUDMPTFEFDPOPNJFT are Myanmar and Venezuela. The least regulated coun- tries—those at the top in Regulation of Credit, Labor, and Business (Area 5)—are a diverse lot: Belize, Bahamas, )POH,POH'JKJ/FX;FBMBOEBOE4JOHBQPSF
0 2 4 6 8 10
Iceland 70 Ghana 70 Nicaragua 69 Botswana 68 Haiti 67 Namibia 66 Thailand 65 Macedonia 64 Uruguay 62 Jordan 62 Papua New Guinea 61 Latvia 60 Portugal 59 Belize 58 Kenya 56 Kazakhstan 56 Trinidad & Tobago 54 Spain 54 Poland 53 Uganda 52 Honduras 51 Jamaica 49 Guatemala 49 Romania 48 Kuwait 47 Czech Republic 46 El Salvador 43 Belgium 43 Armenia 43 France 42 Costa Rica 41 Bahamas 40 Sweden 39 Zambia 38 Montenegro 37 Mongolia 36 Norway 35 Peru 33 Malta 33 Netherlands 30 Korea, South 30 Albania 30 Oman 28 Bulgaria 28 Georgia 27 Taiwan 26 Ireland 25 Lithuania 24 Panama 23 Japan 22 Germany 21 Luxembourg 20 Austria 19 Cyprus 18 Hungary 15 Estonia 15 Denmark 15 United Arab Emirates 14 Slovak Republic 13 Finland 11 Bahrain 11 United States 10 Mauritius 9 United Kingdom 8 Chile 7 Canada 6 Australia 5 Switzerland 4 New Zealand 3 Singapore 2 Hong Kong 1
0 2 4 6 8 10
Zimbabwe 141 Myanmar 140 Venezuela 139 Angola 138 Congo, Dem. Rep. of 137 Central African Rep. 136 Guinea-Bissau 135 Congo, Republic of 134 Burundi 133 Chad 132 Algeria 131 Niger 130 Nepal 129 Mozambique 128 Sierra Leone 126 Ethiopia 126 Ukraine 125 Senegal 124 Togo 123 Gabon 122 Syria 121 Côte d’Ivoire 120 Argentina 119 Burkina Faso 118 Benin 117 Cameroon 115 Mali 115 Pakistan 114 Tanzania 112 Ecuador 112 Mauritania 111 Guyana 110 Lesotho 109 Sri Lanka 107 Nigeria 107 Morocco 105 Iran 105 Malawi 103 Bangladesh 103 Brazil 102 Colombia 101 Bosnia & Herzegovina 100 Bolivia 99 Rwanda 96 Moldova 96 Madagascar 96 Tunisia 94 India 94 Egypt 93 China 92 Serbia 91 Philippines 89 Croatia 89 Vietnam 88 South Africa 87 Indonesia 84 Barbados 84 Azerbaijan 84 Israel 83 Russia 81 Greece 81 Paraguay 80 Malaysia 78 Dominican Republic 78 Fiji 77 Turkey 75 Mexico 75 Slovenia 74 Kyrgyz Republic 70 Italy 70 9.01
8.68 8.20 8.03 7.98 7.81 7.77 7.71 7.67 7.60 7.59 7.59 7.56 7.54 7.52 7.52 7.52 7.51 7.50 7.49 7.45 7.44 7.41 7.40 7.38 7.37 7.36 7.34 7.34 7.32 7.32 7.32 7.31 7.31 7.30 7.29 7.27 7.26 7.24 7.22 7.17 7.16 7.15 7.15 7.15 7.13 7.10 7.08 7.07 7.07 7.06 7.01 7.00 6.99 6.99 6.97 6.97 6.95 6.93 6.92 6.91 6.90 6.90 6.88 6.87 6.86 6.84 6.83 6.82 6.81 6.81
6.81 6.81 6.78 6.74 6.74 6.71 6.68 6.68 6.57 6.55 6.55 6.53 6.50 6.50 6.50 6.49 6.48 6.46 6.46 6.44 6.43 6.42 6.40 6.40 6.29 6.29 6.29 6.27 6.23 6.21 6.19 6.17 6.17 6.16 6.16 6.12 6.12 6.11 6.10 6.05 6.04 6.04 6.03 5.98 5.97 5.96 5.94 5.90 5.86 5.83 5.82 5.74 5.73 5.70 5.62 5.62 5.53 5.50 5.44 5.36 5.32 5.12 5.04 5.03 4.88 4.84 4.76 4.28 4.16 4.08
Exhibit 1.3: Summary Economic Freedom Ratings, 2009
AREAS COMPONENTS OF AREA 5 1
Size of Government
2 Legal System &
Property Rights 3 Sound Money
4 Freedom to Trade
Internationally 5 Regulation
5A Credit Market
Regulation
5B Labor Market
Regulations
5C Business Regulations
Rating (Rank) Rating (Rank) Rating (Rank) Rating (Rank) Rating (Rank) Rating (Rank) Rating (Rank) Rating (Rank)
Albania
8.2 (8) 5.4 (79) 9.6 (6) 6.6 (72) 6.7 (83) 8.1 (78) 5.9 (86) 6.1 (55)Algeria
3.6 (138) 4.6 (100) 7.0 (105) 6.3 (94) 5.4 (131) 5.5 (136) 5.3 (111) 5.3 (105)Angola
3.5 (139) 3.3 (130) 5.2 (139) 6.4 (85) 5.4 (133) 7.2 (114) 3.9 (136) 5.0 (118)Argentina
6.2 (77) 4.5 (105) 7.0 (102) 5.8 (112) 6.0 (116) 8.2 (75) 5.3 (108) 4.4 (130)Armenia
7.7 (21) 5.5 (78) 9.4 (30) 6.5 (79) 6.7 (86) 8.1 (83) 6.2 (77) 5.7 (88)Australia
6.7 (58) 8.2 (11) 9.6 (9) 7.1 (38) 8.2 (9) 9.5 (14) 8.4 (16) 6.8 (25)Austria
4.8 (119) 8.3 (9) 9.6 (14) 7.3 (26) 7.4 (34) 9.2 (33) 6.2 (79) 6.8 (20)Azerbaijan
5.4 (106) 6.0 (54) 7.8 (87) 6.4 (80) 6.9 (66) 7.8 (96) 6.8 (60) 6.2 (51)Bahamas
8.3 (7) 7.0 (28) 7.2 (98) 4.8 (135) 8.9 (2) 9.8 (8) 9.4 (3) 7.4 (8)Bahrain
6.6 (62) 6.6 (37) 9.0 (50) 7.5 (21) 8.3 (7) 9.3 (28) 8.7 (8) 7.0 (16)Bangladesh
8.1 (12) 3.6 (128) 6.7 (114) 5.7 (118) 6.8 (78) 8.1 (77) 6.5 (68) 5.7 (89)Barbados
5.6 (96) 7.8 (18) 6.7 (117) 5.1 (128) 7.3 (44) 8.5 (62) 7.6 (35) 5.9 (77)Belgium
4.1 (135) 6.8 (31) 9.6 (5) 7.7 (15) 7.5 (30) 8.9 (46) 7.4 (45) 6.3 (45)Belize
6.6 (61) 5.5 (75) 8.3 (68) 5.4 (123) 8.9 (1) 9.4 (23) 9.3 (4) 8.1 (1)Benin
7.0 (39) 4.4 (106) 6.7 (115) 5.0 (133) 6.6 (88) 9.2 (32) 5.8 (91) 4.8 (123)Bolivia
6.3 (75) 3.8 (125) 8.7 (57) 6.8 (59) 5.7 (123) 8.0 (85) 4.6 (124) 4.5 (129)Bosnia & Herzeg.
5.5 (103) 3.9 (121) 8.3 (69) 6.5 (77) 6.9 (65) 8.7 (58) 6.6 (66) 5.4 (99)Botswana
4.4 (132) 6.9 (30) 8.4 (66) 6.7 (63) 7.8 (18) 9.5 (14) 7.2 (51) 6.6 (32)Brazil
6.7 (59) 5.3 (82) 7.9 (84) 6.0 (105) 5.1 (136) 6.6 (124) 4.4 (130) 4.2 (132)Bulgaria
7.3 (31) 5.1 (85) 9.4 (29) 7.2 (36) 7.7 (23) 9.7 (12) 7.8 (28) 5.5 (97)Burkina Faso
6.4 (71) 4.1 (117) 6.7 (113) 5.2 (127) 7.3 (51) 8.5 (63) 7.2 (50) 6.0 (64)Burundi
4.6 (124) 3.2 (133) 6.8 (110) 4.4 (138) 6.6 (90) 6.6 (125) 8.2 (20) 5.1 (115)Cameroon
6.8 (51) 3.6 (126) 6.6 (120) 6.0 (103) 6.8 (79) 8.0 (85) 7.6 (38) 4.7 (126)Canada
6.1 (80) 8.1 (15) 9.6 (19) 6.9 (51) 8.3 (8) 9.2 (31) 8.5 (12) 7.1 (12)Central African Rep.
6.3 (73) 2.0 (141) 7.0 (100) 3.9 (139) 5.0 (137) 7.3 (110) 3.8 (138) 4.1 (133)Chad
6.9 (43) 2.7 (136) 5.7 (134) 6.0 (104) 5.3 (135) 6.1 (128) 6.0 (83) 3.7 (139)Chile
7.7 (23) 7.2 (25) 9.0 (51) 7.8 (9) 7.2 (55) 8.7 (56) 5.8 (93) 7.1 (13)China
4.5 (128) 6.4 (45) 8.0 (79) 7.2 (30) 6.0 (115) 7.4 (106) 5.5 (103) 5.0 (119)Colombia
6.0 (84) 4.4 (108) 8.1 (76) 5.7 (120) 6.9 (72) 8.5 (67) 5.9 (89) 6.2 (49)Congo, Dem. Rep.
5.2 (110) 2.7 (137) 7.0 (107) 4.6 (136) 4.8 (139) 4.8 (139) 5.7 (98) 4.0 (134)Congo, Rep. of
5.0 (115) 4.2 (115) 4.7 (140) 5.7 (119) 5.6 (127) 6.3 (127) 6.4 (73) 4.0 (135)Costa Rica
7.4 (30) 6.5 (39) 7.9 (86) 7.3 (27) 6.9 (70) 7.6 (99) 6.7 (64) 6.4 (43)Côte d’Ivoire
7.0 (40) 3.2 (135) 6.6 (119) 6.2 (97) 6.3 (106) 8.0 (85) 5.7 (97) 5.2 (107)Croatia
5.1 (111) 5.6 (74) 8.5 (64) 6.3 (91) 6.8 (75) 8.9 (48) 6.4 (72) 5.1 (114)Cyprus
7.3 (32) 6.8 (32) 9.4 (31) 6.7 (67) 7.3 (49) 9.5 (14) 6.3 (74) 6.1 (58)Czech Republic
4.9 (118) 6.4 (44) 9.5 (27) 7.6 (18) 7.3 (46) 8.7 (54) 7.6 (36) 5.6 (92)Exhibit 1.4: Area Economic Freedom Ratings (Ranks), 2009
AREAS COMPONENTS OF AREA 5
1 Size of Government
2 Legal System &
Property Rights 3 Sound Money
4 Freedom to Trade
Internationally
5 Regulation
5A Credit Market
Regulation
5B Labor Market
Regulations
5C Business Regulations
Rating (Rank) Rating (Rank) Rating (Rank) Rating (Rank) Rating (Rank) Rating (Rank) Rating (Rank) Rating (Rank)