1
Cruise Report FK LITTORINA LIT/1914
(21 th -25 th October 2019)
Institute of Geosciences, Christian-Albrechts- University Kiel, Germany (IFG)
GEOMAR-Helmholtz Centre for Ocean Research, Kiel, Germany
in cooperation with
Department of Biology, University of Southern Denmark, Denmark (SDU)
Dr. Jan Scholten (University Kiel)
2
Introduction
The research cruise LIT/1914 was conducted in the frame of the two BONUS research projects SEAMOUNT (New Surveillance Tools for Remote Sea Monitoring and their Application on Submarine Groundwater Discharge and Seabed Surveys) and INTEGRAL (Integrated carbon and Trace Gas monitoring for the Baltic sea).
One objective of the SEAMOUNT project is to identify locations of submarine groundwater discharge (SGD) in the Western Baltic Sea, i.e. the subsurface flow of groundwater to the coastal ocean. Locations of SGD in relatively deep waters (> 10m) have been observed previously in the Eckernförde Bay, but occurrences outside this area are so far unknown.
Identification of SGD mostly relies on tracers like the natural radionuclides radium and radon, which are enriched in groundwater but not in seawater (Burnett et al., 2006). Therefore, concentration anomalies of these radionuclides close to the shore or near the seafloor may be a first indication of SGD. In deep waters at Boknis Eck (Eckernförde Bay) we observed high radium. This deep water mainly consists of saline North Sea water advected via the Boknis Channel to Boknis Eck. Therefore, there is the possibility that high radium in deep waters of Boknis Eck is an indication of SGD occurring outside the Eckernförde Bay.
The objective of the INTEGRAL project is to use measurements of trace gases (e.g. methane (CH4), nitrous oxide (N2O)) from all available platforms to estimate trace gas emissions from the Baltic Sea. Methane emissions from coastal areas contribute significantly to the oceanic emissions of CH4, however, oceanic CH4 emissions, on the global scale, play only a minor role for the atmospheric CH4 budget. In the Baltic Sea, CH4 is mainly produced during the sedimentary decay of organic material (methylotrophic methanogenesis) and the fraction of CH4 transferred from the sediment through the water column into the atmosphere is strongly governed by anaerobic CH4 oxidation in the upper sediment as well as in the water column.
Apart from sedimentary release of biogenic CH4, groundwater seepage can be a significant source of dissolved CH4 in the water column of the Baltic Sea. Oceanic areas are a major source of atmospheric nitrous oxide (N2O) and its emissions from coastal areas contribute significantly to the overall oceanic emissions. The major production process of dissolved N2O in open and coastal regions of the Baltic Sea is nitrification in the water column, whereas its production during denitrification in sediments seems to be of minor importance.
N2O can occur in very high concentrations in groundwater, however, the effect of SGD on the N2O water column distribution in the Baltic Sea has not been determined yet. Literature data also indicate that there may be an association of methane and SGD (e.g., Bussmann and Suess, 1998; Santos et al., 2009). Thus, the joint research activity of the two BONUS projects INTEGRAL and SEAMOUNT may lead to a better understanding of the relations between SGD and trace gases occurrence in the Western Baltic Sea.
Oxygen availability has a huge influence on the structure of the ecosystem as well as a significant impact on fauna. The availability of oxygen could affect some species directly or indirectly through removing some of the higher trophic levels that impact phytoplankton structure during periods of hypoxia/anoxia. The impact of variable oxygen concentration on algae and cyanobacteria has been little studied. The variable oxygen content of water masses in the western Baltic Sea allows us to study how the phytoplankton composition changes and/or is affected by variable seawater oxygen contents.
3
2. Objectives of the cruise
The objective of the cruise was to sample the water column at selected stations along the flow paths of saline North Sea deep waters through the Fehmarn Strait, Little Belt, Great Belt, Flensburg Firth and Kiel Bay.
More specifically the objectives were:
• To measure the distribution of radium, nutrients, CH4 and N2O in the water column.
• To investigate the role of submarine groundwater discharge (SGD) as a potential source for dissolved CH4 and N2O in the water column.
• To examine changes of bacteria, DNA and particulate matter composition in relation to the oxygen content.
• To determine water current velocities at sampling location using Acoustic Doppler CurrentProfiler (ADCP).
Figure 1. Map of the Western Baltic Sea with sampling stations. Map created with GeoMapApp (http://geomapapp.org), based on Global Multi-Resolution Topography (GMRT) synthesis (Ryan et al., 2009).
3. Cruise narrative
21.10.2019 08:00 11:45
Rigg-up of ADCP
Departure of FK Littorina from Kiel harbor 14:34
15:26 14:10
Start ADCP survey Arrival at station 1 End ADCP survey 16:50
17:45
Arrival at station 2
Arrival at Bagenkop harbor 22.10.2019 06:30 Departure Bagenkop harbor
08:16 Start ADCP survey 09:03
10:33
Arrival at station 3 End ADCP survey
4 12:01
12:40 13:25 14:30 16:20 17:00
Start ADCP survey Arrival at station 4 Arrival at station 5 Arrival at station 6 End ADCP survey Arrival at station 7
18:40 Arrival at Bagenkop harbor 23.10.2019 06:39 Departure Bagenkop harbor
07:20 Start ADCP survey 07:55
10:09 11:15 12:05 13:32
Arrival at station 8 Arrival at station 9 End ADCP survey Arrival at station 10 Arrival at station 11 14:47
16:10 18:30
Arrival at station 12 Arrival at station 13 Arrival at Olpenitz harbor 24.10.2019 06:30 Departure Olpenitz harbor
07:38 Start ADCP survey 08:10
10:25 12:00 13:12 14:53 15:45 16:34 18:12 18:19
Arrival at Station 14 End ADCP survey Arrival at Station 15 Start ADCP survey Arrival at station 16 Arrival at station 17 Arrival at station 18 End ADCP survey Arrival at station 19 23:30 Arrival at Kiel harbor 25.10.2019 08:00 Unloading equipment
4. Methods and Sampling
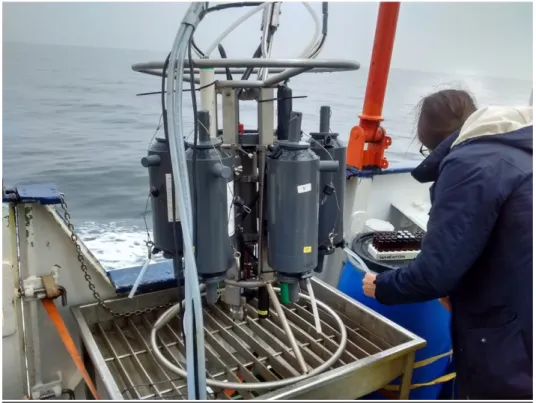
Conductivity-Temperature-Depth probe (CTD) and water sampling rosette (GEOMAR) At all stations a HydroBios MWS410 CTD probe with attached water sampling rosette was deployed to investigate the physical properties (salinity, temperature, oxygen) of the water column. Temperature, conductivity and oxygen saturation data was used to identify suitable water depths for water sampling. In general, water samples were obtained between 25m water depth and the surface in ~ 5m depth spacings.
Nutrients and dissolved trace gases (GEOMAR)
Sampling for methane and N2O (each in triplicate) was immediately conducted after the CTD bottles were on deck to minimize any equilibration with air. Glass bottles (20ml) were filled
5 from the bottom to top using Nalgene PVC tubing which was flushed to remove possible air bubbles. Glass bottles were flushed three times their volume to remove any bubbles and to ensure that the water was not exposed to air. The tubing was carefully pulled out of the bottles, and a rubber stopper was inserted and secured using an aluminum crimp.
Figure 2. Water sampling for methane and N2O analyses
N2O and CH4 samples taken in the period from 21 to 23 October were poisoned with HgCl2(aq) on 23 October. The N2O/CH4 samples from 24 October were poisoned immediately after sampling. Samples for nutrient analyses were filled in pre-rinsed 50 ml PE bottles and stored in a freezer. Samples will be analyzed at GEOMAR by applying state-of-the-art methods (autoanalyzer for nutrients, GC-FID/ECD for trace gases).
Sampling for bacterial analyses, DNA, organic matter and pigments (SDU)
For the analyses of bacteria by means of flow cytometry, about 1.9 ml of water was filled in 2 ml vials (in triplicate) and 20 µl of paraformaldehyde was added, shaken, and incubated for 4 -12 h in the fridge. Thereafter the samples were frozen at -20 °C. For DNA analyses 0.3 – 0.5 l of water was filtered over membrane filters; the filters were folded, placed in a vial and stored in a freezer. For the determination of particulate organic matter and pigments 0.3 – 0.5 l of water was poured over pre-combusted glass microfiber filters; and the filters were stored in the
6 freezer. During the cruise in total 39 samples for DNA analyses, 153 samples for flow cytometry and 126 samples for the analyses of particulate organic matter were obtained.
Sampling for radium analyses (IFG)
Water sampling for Ra isotope analyses was performed using two WASP-P5 submersible pumps, which allow water sampling from up to 30 m water depth. The pumps were attached to the CTD and the water hose was fixed to the cable of the CTD. At all stations (Tab. 2) two samples, one from the upper mixed layer (~ 5m water depth) and one close to the sea floor (~
2 m above bottom) were obtained. At selected stations (stations 3, 5, 14, 18) the water column was sampled in higher resolution.
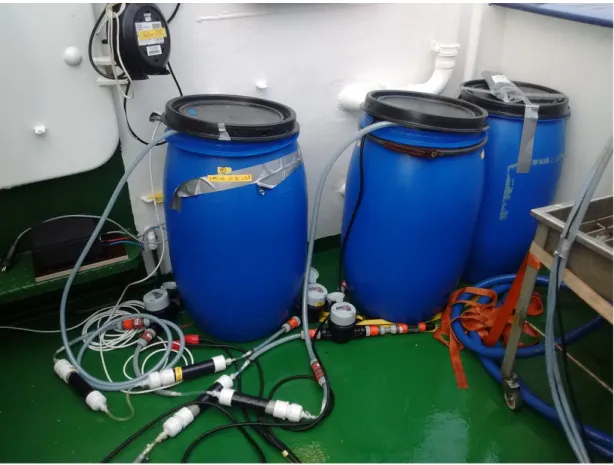
For each sample approx. 120 l of seawater was filled in barrels and subsequently filtered over manganese impregnated acrylic fibers with a flow rate <1 l/min (Figure 3). On-board the ship the Mn-fibers were analyzed for 223Ra and 224Ra using Scientific Computer Instruments RaDeCC radium delayed coincidence counters. Seawater salinity and temperature of each water sample were determined using a hand-held MTW Cond3310 salinity and temperature probe.
Figure 3. Radium sampling: Seawater in the blue barrels is filtered over Mn-impregnated fibers which adsorb radium; the volume of filtered water is measured using water meters.
7 ADCP (IFG)
About 2.5 nm before arriving at selected stations (stations 1, 3, 4, 8, 9, 14, 16-18) the ADCP (TRDI ADCP, 1200 kHz) was deployed. Additional ADPC profiles were run across the Little Belt, Great Belt and Flensburg Firth.
Table 2: List of stations and depths of water sampling
Station Date Time
(CET) Latitude
N Longitude
E Water
Depth (m)
Sampling Depths Gases & Nutrients
(m)
Sampling Depths Radium (m) 1 21.10.2019 15:26 54° 36.862 10° 41.185 24.7 0, 5, 10, 15, 20 5, 20 2 21.10.2019 16:50 54° 41.654 10° 36.575 21.5 0, 5, 10, 15, 20 5, 20 3 22.10.2019 09:03 54° 36.154 11° 00.287 41 0, 5, 10, 15, 20, 25 5, 15, 20, 25 4 22.10.2019 12:40 54° 50.114 10° 49.157 21 0, 5, 10, 15, 18 5, 18 5 22.10.2019 13:25 54° 49.920 10° 50.575 22.3 0, 5, 10, 15, 20 5, 15, 20 6 22.10.2019 14:30 54° 49.981 10° 51.501 20 0, 5, 10, 15, 19 5, 19 7 22.10.2019 17:00 54° 45.214 10° 46.641 32 5, 10, 15, 20, 25 5, 25 8 23.10.2019 07:55 54° 47.297 10° 25.264 28 0, 5, 10, 15, 20, 25 5, 25 9 23.10.2019 10:05 54° 41.234 10° 25.069 30.5 0, 5, 10, 15, 20, 25 5, 25 10 23.10.2019 12:05 54° 49.270 10° 15.350 29 0, 5, 10, 15, 20, 25 5, 25 11 23.10.2019 13.37 54° 44.880 10° 05.335 27 0, 5, 10, 15, 20, 25 5, 25 12 23.10.2019 14:49 54° 41.218 10° 09.495 31.5 0, 5, 10, 15, 20, 25 5, 25 13 23.10.2019 16:15 54° 36.767 10° 06.684 25 0, 5, 10, 15, 20, 23 5, 23 14 24.10.2019 08:10 54° 48.839 9° 56.637 26 0, 5, 10, 15, 20, 24 5, 15, 20, 24 15 24.10.2019 12:00 54° 53.729 10° 09.926 32 0, 5, 10, 15, 20, 25 5, 25 16 24.10.2019 14:53 54° 58.666 10° 02.995 35 0, 5, 10, 15, 20, 25 25 17 24.10.2019 15:50 54° 58.617 10° 05.527 36 0, 5, 10, 15, 20, 25 25 18 24.10.2019 16:39 54° 59.541 10° 07.954 38 0, 5, 10, 15, 20, 25 5, 15, 20, 25 19 24.10.2019 18:28 54° 58.633 10° 10.329 34 0, 5, 10, 15, 20, 25 25
5. Preliminary results
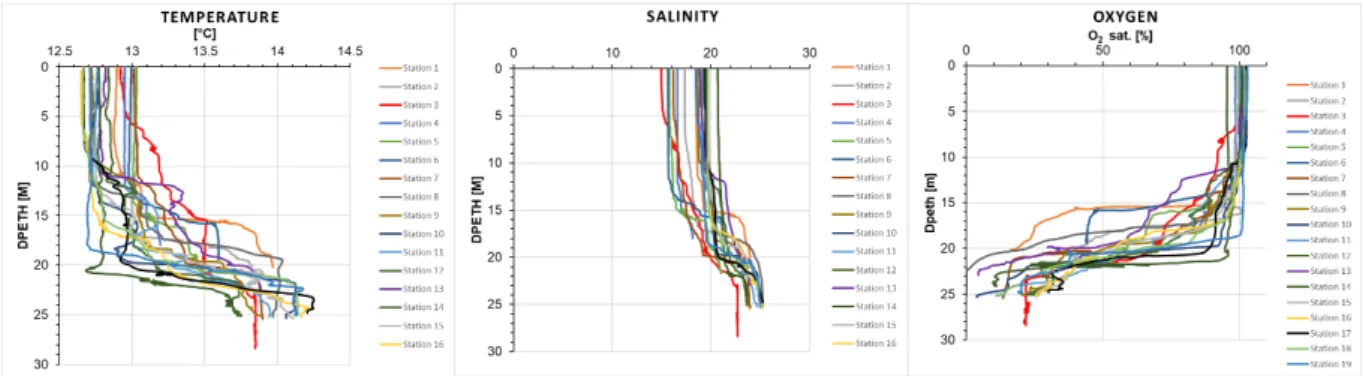
Initial results of the CTD profiles indicate a relatively well-mixed upper water column and more saline waters below ~ 15 m water depth (Figures 4, 5). Temperature and salinity range between 12.6 °C and 14.3 °C and between 14.960 and 25.295, respectively. Oxygen saturation in saline deep waters is generally low (~ <50 %).
8 Figure 4.: Profiles of temperature, salinity and O2 saturation at investigated locations during Litt/1914 cruise.
Figure 5: N-S transect of temperature, salinity and oxygen saturation compiled from CTD measurements in the western Baltic Sea. (OceanDataView 4.8 (Schlitzer, 2018)).
9
6. Scientific crew
Name Function Institution
Jan Scholten Chief scientist IFG Annike-Sofie Schlaubke Student IFG Friederike Zadow Master student GEOMAR Hans Frederik Hansen Ph.D student SDU Odense
IFG: Institute of Geosciences, Christian-Albrechts-University of Kiel, Germany GEOMAR: GEOMAR Helmholtz Centre for Ocean Research Kiel, Germany
SDU Odense: Department of Biology, University of Southern Denmark, Odense, Denmark
Acknowledgements
We are grateful for the excellent support of the captain and the crew of RV Littorina. The cruise was part of the BONUS SEAMOUNT and INTEGRAL programs. The BONUS INTEGRAL project receives funding from BONUS (Art 185), funded jointly by the EU, the German Federal Ministry of Education and Research (BMFT, grant no. 03F0773B), the Swedish Research Council Formas, the Academy of Finland, the Polish National Centre for Research and Development, and the Estonian Research Council. The BONUS SEAMOUNT project receives funding from BONUS (Art 185), funded jointly by the EU, the German Federal Ministry of Education and Research (BMFT, grant no. 03F0771B), the Academy of Finland, the Polish National Centre for Research and Development, and the Innovation Fund Denmark.
7. References
Burnett, W.C., Aggarwal, P.K., Aureli, A., Bokuniewicz, H., Cable, J.E., Charette, M.A., Kontar, E., Krupa, S., Kulkarni, K.M., Loveless, A., Moore, W.S., Oberdorfer, J.A., Oliveira, J., Ozyurt, N., Povinec, P., Privitera, A.M.G., Rajar, R., Ramessur, R.T., Scholten, J., Stieglitz, T., Taniguchi, M. and Turner, J.V. (2006) Quantifying submarine groundwater discharge in the coastal zone via multiple methods Science of the Total Environment 367, 498-543.
Bussmann, I. and Suess, E. (1998) Groundwater seepage in Eckernförde Bay (Western Baltic Sea): Effect on methane and salinity distribution of the water column. Continental Shelf Research 18, 1795-1806.
Ryan, W. B. F., Carbotte, S. M., Coplan, J. O., O’Hara, S., Melkonian, A., Arko, R, … Zemsky, R. (2009). Global Multi-Resolution Topography Synthesis. Geochemistry, Geophysics, Geosystems, 10, Q03014. doi: 10.1029/2008GC002332.
Schlitzer, R. (2018). Ocean Data View. http://odv.awi.deSantos, I.R., Dimova, N., Peterson, R.N., Mwashote, B., Chanton, J. and Burnett, W.C. (2009) Extended time series measurements of submarine groundwater discharge tracers (222Rn and CH4) at a coastal site in Florida. Marine Chemistry 113, 137.