Towards a Hierarchical Approach for Outlier Detection in Industrial Production Settings
Burkhard Hoppenstedt
Ulm University Ulm, Germany
burkhard.hoppenstedt@uni-ulm.de
Manfred Reichert
Ulm University Ulm, Germany manfred.reichert@uni-ulm.de
Klaus Kammerer
Ulm University Ulm, Germany klaus.kammerer@uni-ulm.de
Myra Spiliopoulou
Otto-von-Guericke-University Magdeburg, Germany
myra@ovgu.de
Rüdiger Pryss
Ulm University Ulm, Germany ruediger.pryss@uni-ulm.de
ABSTRACT
In the context of Industry 4.0, the degree of cross-linking be- tween machines, sensors, and production lines increases rapidly.
However, this trend also offers the potential for the improve- ment of outlier scores, especially by combining outlier detection information between different production levels. The latter, in turn, offer various other useful aspects like different time series resolutions or context variables. When utilizing these aspects, valuable outlier information can be extracted, which can be then used for condition-based monitoring, alert management, or pre- dictive maintenance. In this work, we compare different types of outlier detection methods and scores in the light of the afore- mentioned production levels with the goal to develop a model for outlier detection that incorporates these production levels.
The proposed model, in turn, is basically inspired by a use case from the field of additive manufacturing, which is also known as industrial 3D-printing. Altogether, our model shall improve the detection of outliers by the use of a hierarchical structure that utilizes production levels in industrial scenarios.
KEYWORDS
Outlier Detection, Production Level, Outlierness
1 INTRODUCTION
In general, outlier detection can be used in the context of pro- duction control to provideCondition Monitoring, generateAlerts, discoverConcept Shifts, or serve as an indicator forPredictive Maintenance. In the context of the latter, the degree of deviation from an expected value represents the urgency to maintain a system. In this work, we focus on the detection of anomalies in temporal data. In general, outliers can be seen aschanges, sequences, ortemporal patterns[12]. Furthermore, there exist various anomaly types (see Fig. 1, [9]). In this context, the most common techniques that are used for an outlier detection con- stituteclassificationandclustering. Moreover, the field of outlier detection is related toforecasting, as deviations from expected values might indicate an unexpected change in the behavior of a machine. Nowadays, industrial production generates data in var- ious resolutions and formats. Usually, the obtained sensor values have a very high resolution. In this context, data is assigned by
First International Workshop on Data Science for Industry 4.0.
Copyright ©2019 for the individual papers by the papers’ authors. Copying permit- ted for private and academic purposes. This volume is published and copyrighted by its editors.
acomputer-aided quality assurance(CAQ) to a higher hierarchy level if it has a lower resolution and vice versa. Therefore, out- liers can be detected and utilized coming from different hierarchy levels, while these levels, in turn, have their different require- ments towards the used algorithms, e.g., in terms of data types, calculation speed, and dimensionality. In this work, we provide a short overview of outlier detection methods and their purpose.
Furthermore, we suggest a data structure for outlier detection that is based on the following idea: Machines are often equipped with redundant sensors, e.g., to measure the temperature of the same machine at different places. However, sensors measuring the same information allow for the calculation of asupport value for outliers. Hereby, an outlier is more valuable if it is also found in the supporting sensor at the same time. Based on this idea, the suggested data structure shall be able to represent the supporting as well as the hierarchy value for an outlier.
The remainder of this paper is structured as follows. In Section 2, we briefly illustrate the hierarchical structure. Section 3 presents the categories of outliers that can be found in the literature, while Section 4 sketches an algorithm which incorporates the hierarchy.
Related work is discussed in Section 5. Finally, a summary and an outlook are provided in Section 6.
2 HIERARCHICAL STRUCTURE
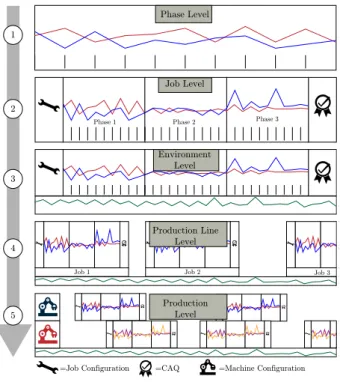
The production layers used in this work (see Fig. 2) contain different types of data and therefore a framework is introduced that can handle several types of outlier detection approaches as well as can combine their advantages with respect to specific data types. The first introduced layer is denoted asphase level 1 . The production process is usually split into several phases, e.g., preparation,warm-up, andcalibration. In the proposed model, this layer provides the most detailed view on the production.
It comprises multi-dimensional, high-resolution sensor values that deliver either time series data or discrete value sequences during the corresponding phase. Time series data corresponds to numeric data over time, while discrete sequences are made of labels. In thejob level 2 , a whole production process is displayed.
A job may consist of several phases and it starts with a setup and ends with a computer-aided quality (CAQ) check. The setup and quality tests are not time series, but provide nevertheless
Additive Outlier Innovative Outlier Temporary Change Level Shift
Figure 1: Outlier Types
Published in the Workshop Proceedings of the EDBT/ICDT 2019 Joint Conference (March 26, 2019, Lisbon, Portugal) on CEUR-WS.org.
Phase - Level
=CAQ Phase Level
Phase 1 Phase 2 Phase 3 Job - Level
Job 1 Job 2 Job 3
Environment - Level
1
2
3
4
5
=Job Configuration =Machine Configuration Job Level
Environment Level
Production Line Level
Production Level
Figure 2: Outlier Types
high-dimensional data. During the setup, parameters are selected and the job is prepared. When considering theenvironment-level 3 , a new time series is introduced, which does not correspond directly to the production process, but is measured in the same period. An example of such a time series would be the room temperature. If jobs over time are investigated 4 , the high- dimensional setup provides also a time series. This layer, in turn, is denoted asproduction line level. Finally, the production level 5 includes data from different machines and represents therefore the most complex scenario. The aim of future work will be to combine outlier information from the different levels in a valuable manner.
3 CATEGORIZATION OF LITERATURE ON OUTLIERS
Due to the various scenarios in a production environment, dif- ferent outlier detection algorithms should be kept in mind (see Table 1). In general, production levels with high resolution values should use sequences to represent the outliers as points since they are vulnerable to measurement errors. In contrast, for aggre- gated values, points can be used to represent outliers. In general, anomalies in time series can be extracted by a straightforward computation or by using overlapping fixed size windows, which, in turn, are aggregated. The first introduced technique in this con- text is called discriminative approach (DA). Thereby, asimilarity functioncompares sequences and clusters, while the distance of a time series to the centroid of the nearest clusters denotes the anomaly score. Inunsupervised parametric approaches(UPA), an anomaly is discovered if a sequence is unlikely to be generated from a specified summary model. In case of multidimensional data, an Online Analytical Processing (OLAP) cube can be ana- lyzed, using an unsupervised approach (UOA) with each cell as a measure. When labeled training data is available, supervised
Table 1: Categorization of Literature on Outliers
Technique Type PTS SSQ TSS
Match Count Sequence Similarity [16] DA ✓
Longest Common Subsequence [2] DA ✓
Vibration Signature [28] DA ✓ ✓
Expectation-Maximization [30] DA ✓ ✓ ✓
Phasedk-Means [36] DA ✓
Dynamic Clustering [37] DA ✓ ✓
Single-linkage clustering [32] DA ✓ ✓ ✓
Principal Component Space [13] DA ✓
Support Vector Machine [6] DA ✓ ✓ ✓
Self-Organizing Map [11] DA ✓ ✓ ✓
Finite State Automata [25] UPA ✓ ✓
Hidden Markov Models [7] UPA ✓ ✓
Online Analytical Processing Cube [20] UOA ✓ ✓
Rule Learning [18] SA ✓ ✓
Neural Networks [10] SA ✓ ✓ ✓
Rule Based Classifier [19] SA ✓
Window Sequence [17] NPD ✓
Anomaly Dictionary [3] NMD ✓
Symbolic Representation [22] OS ✓ ✓
Autoregressive Model [15] PM ✓ ✓
Histogram Representation [27] ITM ✓
DA=Discriminative Approach, UPA=Unsupervised Parametric Approach, UOA=Unsupervised Online Approach, SA=Supervised Approach, NPD=Normal Pattern Database, NMD=Negative and Mixed Pattern Database,
OS=Outlier Subsequence, PM=Predictive Model, ITM= Information-Theoretic Model, PTS=Points, SSQ=Sequences,TSS=Time Series
approaches (SA) can be applied.Window-based detectionis an- other type of outlier detection. Furthermore, outlier scores are calculated for overlapping windows with fixed length as parame- ters. This class of outlier detection suits well for detecting exact positions of anomalies. Thenormal pattern database(NPD), in turn, is a representative of a window-based approach. Regarding the latter, the frequencies of overlapping windows are stored in a database. If a new subsequence has many mismatches, it is considered as an anomaly. This procedure can be extended by not including only exact matches, but rather compute soft mismatch scores. In contrast to a NPD approach, thenegative and mixed pattern database(NMD) is based on anomaly dictionaries.
Here, test sequences are classified as anomalies if they match a sequence from the database. Next, to findoutlier subsequences (OS), patterns are compared to their expected frequency in the database. The main problem is to preserve computational effi- ciency as the calculation of a match score and its permutations is very costly.Prediction models(PM) define the outlier score based on the delta value to the predicted value. In addition, prediction models are suitable for multi-variate time series. Another way to detect outliers is to compare a normal profile with new time points. This procedure is denoted asprofile similarity(PS). More- over, ainformation-theoretic model(ITM) detects outlier points by removing points from a sequel and measuring the improve- ment in a histogram-based representation. In this context, outlier points are denoted asdeviants.
Note that different type of outliers must be identified for each hierarchy in order to distinguish between outliers for finding points(pts),sub-sequences(ssq), ortime-series(tss).
4 ALGORITHM
The work at hand proposes an algorithm (see Algorithm 1) for the utilization of outliers in a hierarchical production system. The result of the algorithm is represented by the tripleglobal score, outlierness, andsupport(i.e., the data structure). First, the global score denotes in which of the five proposed levels the outlier was noticed. For example, if it was only recognized in the phase level, the global score value is low. Consequently, the higher a global score is, the more obvious was the outlier. Note that if outliers
are identified in a high production level, it is assumed that these outliers can be also identified in a lower level as well. Adversely, if no outlier can be found at a lower level, but in a higher level, a measurement error must be assumed. Second, theoutlierness constitutes the significance of the outlier as computed by the actually used algorithm. Third, thesupportvalue can be increased if the outlier can be found in the same level for corresponding sensors, e.g., when the room temperature measurement supports another sensor measurement. In general, support values reduce the probability of finding a measurement error.
FindHierarchicalOutlierT S,LV
inputs :startLevel(LV) and timeSeries(TS) output :<global score, outlierness, support>
algorithm:=ChooseAlgorithm(startLevel);
List<Sensors> correspondingSensors;
List<Outlier> outlierList := CalculateOutlier(algorithm, startLevel,TS);
foreachoutlier∈outlier Listdo
foreachsensor∈cor r espondinдSensor sdo ifsensor supports outlierthen
support++;
end end end
support/=Number of Corresponding Sensors;
outlierness:=CalcOutlierness(algorithm);
globalScore:= CalcGlobalScore(level++,true);
CalcGlobalScore(level–,false);
CalcGlobalScorelevel,up algorithm =ChooseAlgorithm(level);
CalculateOutlier(algorithm, level);
ifupthen
ifOutlier Detected in Levelthen
globalScore++; CalcGlobalScore(level++,true);
end end else
ifNo Outlier Detected in Levelthen Warning for Wrong Measurement;
end else
CalcGlobalScore(level–,false);
end end
Algorithm 1:Outlier Hierarchical Algorithm
5 RELATED WORK
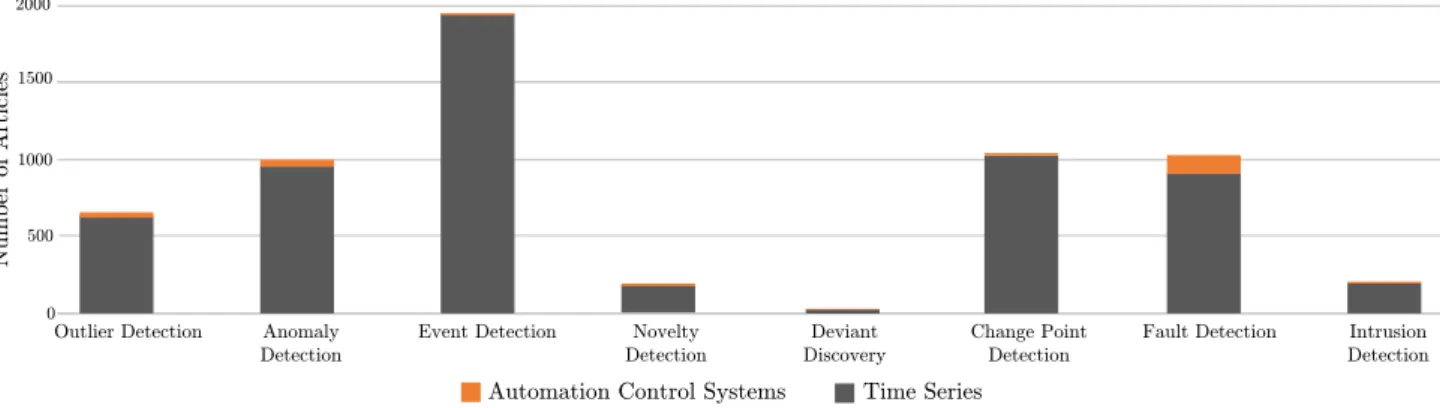
Outlier detection is also known asanomaly detection,event detec- tion,novelty detection,deviant discovery,change point detection, fault detection, orintrusion detection. Based on an extensive lit- erature study, Fig. 3 shows corresponding numbers of papers from each of these categories extracted from the search engine Web of Science. Note that each term was filtered with the word time seriesand afterwards limited to those items that are con- nected to the categoryautomation control systems. In general, methods for outlier detection have been presented as general frameworks [39] as well as features forprocess control systems (PCS) [38]. Moreover, another challenge for outlier detection is related to the calculation speed. To tackle the latter, the authors of [4] used the MapReduce pattern to speed up the calculation for distance-based outliers. A further challenge in the field of outlier detection is the complexity of time series. Hereby, an approach for multivariate time series is introduced by [5]. To tackle the problem of large, noisy features, [31] used an outlier thresholding function for outlier selection, whose results are further on used as target feature. Another approach to deal with high dimensions constitutes the combination of outlier detection and dimension
reduction. In this context, [29] used theprincipal component anal- ysis(PCA) and thelocal outlier factor(LOC) for a robust detection of noisy variables. In contrast, [26] extended the PCA with a fac- tor leverage, which measures the influence of each data point of the PCA. A further way to reduce the dimension constitutes the use ofintrinsic dimensions(ID). In [35], for example, the PCA is combined with a randomized approach for subspace recovery.
Again, the dimension reduction method is combined with a local outlier score [41]. Due to the strong connection of outlier detec- tion and the nearest neighbor method (knn), the effect ofhubness needs to be considered (e.g., [34]). Note that hubness is denoted as the tendency of high-dimensional data to contain points from otherknnlists. To summarize, all presented approaches help to tackle complex and large production data.
Another important part of related work can be referred tooutlier- ness scores. For the production scenario used in this paper, flexible and adaptive outlier scores are needed, which can be expressed by the degree of outlierness. These scores allow for a ranking of outliers, which cannot be done using a binary outlier score, as the latter reveals only a decision for true/false decisions. In [14], for example, an interval-based approach is presented, in which the outlierness score is defined as the resulting distance after the clustering process. Hereby, it is possible to define a pattern as the ground truth prototype and all outlierness scores are relative to this selected pattern. A similar definition of outlierness score is presented by [23], in which it is denoted as the distance between a normal and the outlier class. The distance, in turn, is measured by aSupport Vector Machine. Next, [21] enriches the outlierness score by including different context levels. For the levelslocal, global, andensemble, an expected behavior is modeled and the outlierness refers to the difference between the expected and the measured value. Another approach uses the impact of outliers on the clustering objective, where the sensitivity denotes the worst- case impact of a point of the clustering solution [24]. Moreover, outlierness scores can be combined to outlier vectors, as, for ex- ample, pursued by [8]. This is especially helpful in the context of online outlier detection. Another way of expressing the degree of outlierness constitutes the evaluation of all distances to elements in the neighbor and by the use of the percentage of distances higher than the mean distance [33]. This concept is designed to work for dependent elements, as they can be found in graphs.
The last presented outlierness approach [1] uses the imbalance between densities of all objects. Finally, sensors can be simulated using software, which is denoted assoft sensor modeling. A fusion of outlier detection and soft sensor modeling, for example, is presented by [40].
In the light of the presented approach, to the best of our knowl- edge, none of the evaluated related works deal with outlier de- tection in different hierarchy levels in an industrial production setting as we do.
6 SUMMARY AND OUTLOOK
We proposed a novel algorithm that includes three characteristics of outliers in a production environment, namely the global score, the outlierness, and the support. These values are calculated using different algorithms, whereby the algorithm should be selected with respect to the resolution best fitting to a production layer. This representation of outliers helps then to represent the importance of an outlier and classify the outliers by several criteria for a more transparent production. The review of various outlier methods has shown possible algorithm candidates that can
2000
1500
1000
500
0
Anomaly Detection
Outlier Detection Event Detection Novelty
Detection
Deviant Discovery
Change Point Detection
Fault Detection Intrusion Detection Time Series
Automation Control Systems
Number of Articles
Figure 3: Research Fields of Outlier Detection
be used for the corresponding layers. Some of these algorithms fit better on time series, some of them on sequences, while others on outlier points. In future work, the approach will be evaluated based on real-life data of a company that produces machines in an industrial large-scale production setting.
REFERENCES
[1] Fabrizio Angiulli and Clara Pizzuti. 2002. Fast Outlier Detection in High Dimensional Spaces. InPrinciples of Data Mining and Knowledge Discovery.
Lecture Notes in Computer Science, Lecture Notes in Artificial Intelligence, Vol. 2431. Springer, Berlin and Heidelberg, 15–27.
[2] Suratna Budalakoti, Ashok N Srivastava, Ram Akella, and Eugene Turkov.
2006. Anomaly detection in large sets of high-dimensional symbol sequences.
(2006).
[3] João B. D. Cabrera, Lundy Lewis, and Raman K. Mehra. 2001. Detection and classification of intrusions and faults using sequences of system calls.ACM SIGMOD Record30, 4 (2001), 25–34.
[4] Sorin N. Ciolofan et al. 2016. Rapid Parallel Detection of Distance-based Outliers in Time Series using MapReduce.Journal of Control Engineering and Applied Informatics18, 3 (2016), 63–71.
[5] Domenico Cucina et al. 2014. Outliers detection in multivariate time series using genetic algorithms.Chemometrics and Intelligent Laboratory Systems 132 (2014), 103–110.
[6] Eleazar Eskin et al. 2002. A Geometric Framework for Unsupervised Anomaly Detection. InApplications of Data Mining in Computer Security. Advances in Information Security, Vol. 6. Springer, Boston, MA, 77–101.
[7] German Florez-Larrahondo et al. 2005. Efficient modeling of discrete events for anomaly detection using hidden markov models. InInternational Conference on Information Security. Springer, 506–514.
[8] Pedro A Forero, Scott Shafer, and Josh Harguess. 2016. Online robust dictionary learning with density-based outlier weighing. InOCEANS 2016 MTS/IEEE Monterey. IEEE, 1–5.
[9] A. J. Fox. 1972. Outliers in Time Series.Journal of the Royal Statistical Society.
Series B (Methodological)34, 3 (1972), 350–363.
[10] Anup K Ghosh, Aaron Schwartzbard, and Michael Schatz. 1999. Learning Program Behavior Profiles for Intrusion Detection.. InWorkshop on Intrusion Detection and Network Monitoring, Vol. 51462. 1–13.
[11] Fabio A. González and Dipankar Dasgupta. 2003. Anomaly Detection Using Real-Valued Negative Selection.Genetic Programming and Evolvable Machines 4, 4 (2003), 383–403.
[12] Manish Gupta et al. 2014. Outlier Detection for Temporal Data: A Survey.
IEEE Transactions on Knowledge and Data Engineering26, 9 (2014), 2250–2267.
[13] Manish Gupta and Abhishek Singh. 2013. Context-Aware Time Series Anomaly Detection for Complex Systems, In Proc. of the SDM Workshop on Data Mining for Service and Maintenance.
[14] Marwan Hassani, Yifeng Lu, and Thomas Seidl. 2016. Towards an Efficient Ranking of Interval-Based Patterns.. InEDBT. 688–689.
[15] David J. Hill and Barbara S. Minsker. 2010. Anomaly detection in streaming environmental sensor data: A data-driven modeling approach.Environmental Modelling & Software25, 9 (2010), 1014–1022.
[16] Terran Lane and Carla Brodley. 1997. Sequence Matching and Learning in Anomaly Detection for Computer Security. (05 1997).
[17] Terran Lane and Carla E Brodley. 1997. An application of machine learning to anomaly detection. InProceedings of the 20th National Information Systems Security Conference, Vol. 377. Baltimore, USA, 366–380.
[18] Wenke Lee, Salvatore J Stolfo, et al. 1998. Data mining approaches for intrusion detection.. InUSENIX Security Symposium. San Antonio, TX, 79–93.
[19] Xiaolei Li et al. 2007. ROAM: Rule- and Motif-Based Anomaly Detection in Massive Moving Object Data Sets. InProceedings of the Seventh SIAM Interna- tional Conference on Data Mining. Soc. for Industrial and Applied Mathematics,
Philadelphia, Pa., 273–284.
[20] Xiaolei Li and Jiawei Han. 2007. Mining approximate top-k subspace anomalies in multi-dimensional time-series data. InProceedings of the 33rd international conference on Very large data bases. VLDB Endowment, 447–458.
[21] Jiongqian Liang and Srinivasan Parthasarathy. 2016. Robust contextual outlier detection: Where context meets sparsity. InProceedings of the 25th ACM International on Conference on Information and Knowledge Management. ACM, 2167–2172.
[22] Jessica Lin et al. 2003. A symbolic representation of time series, with im- plications for streaming algorithms. InProceedings of the 8th ACM SIGMOD workshop on Research issues in data mining and knowledge discovery. ACM, 2–11.
[23] Ninghao Liu, Donghwa Shin, and Xia Hu. 2017. Contextual Outlier Interpre- tation.arXiv preprint arXiv:1711.10589(2017).
[24] Mario Lucic, Olivier Bachem, and Andreas Krause. 2016. Linear-time outlier detection via sensitivity.arXiv preprint arXiv:1605.00519(2016).
[25] Carla Marceau. 2005.Characterizing the behavior of a program using multiple- length n-grams. Technical Report. Odyssey Research Associates Inc Ithacany.
[26] Amanda F Mejia et al. 2017. PCA leverage: outlier detection for high- dimensional functional magnetic resonance imaging data.Biostatistics18, 3 (2017), 521–536.
[27] S. Muthukrishnan et al. 2004. Mining deviants in time series data streams. In SSDBM 2004. IEEE Computer Society, Los Alamitos, Calif, 41–50.
[28] Alexandre Nairac et al. 1999. A System for the Analysis of Jet Engine Vibration Data.Integrated Computer-Aided Engineering6, 1 (1999), 53–66.
[29] Thomas Ortner et al. 2017. Local projections for high-dimensional outlier detection.arXiv preprint arXiv:1708.01550(2017).
[30] Xinghao Pan, Jiaqi Tan, Soila Kavulya, Rajeev Gandhi, and Priya Narasimhan.
2008. Ganesha: Black-Box Fault Diagnosis for MapReduce Systems (CMU- PDL-08-112).Parallel Data Laboratory(2008).
[31] Guansong Pang et al. 2018. Sparse Modeling-based Sequential Ensemble Learning for Effective Outlier Detection in High-dimensional Numeric Data.
AAAI.
[32] Leonid Portnoy et al. 2001. Intrusion Detection with Unlabeled Data Using Clustering. (11 2001).
[33] Mario Alfonso Prado-Romero and Andrés Gago-Alonso. 2016. Community Fea- ture Selection for Anomaly Detection in Attributed Graphs. InIberoamerican Congress on Pattern Recognition. Springer, 109–116.
[34] Miloš Radovanović, Alexandros Nanopoulos, and Mirjana Ivanović. 2015.
Reverse nearest neighbors in unsupervised distance-based outlier detection.
IEEE transactions on knowledge and data engineering27, 5 (2015), 1369–1382.
[35] Mostafa Rahmani and George K Atia. 2017. Randomized robust subspace recovery and outlier detection for high dimensional data matrices. IEEE Transactions on Signal Processing65, 6 (2017), 1580–1594.
[36] Umaa Rebbapragada, Pavlos Protopapas, Carla E. Brodley, and Charles Alcock.
2009. Finding anomalous periodic time series.Machine Learning74, 3 (2009), 281–313.
[37] Karlton Sequeira and Mohammed Zaki. 2002. ADMIT: anomaly-based data mining for intrusions. InProceedings of the eighth ACM SIGKDD international conference on Knowledge discovery and data mining. ACM, 386–395.
[38] Weixing Su et al. 2013. An online outlier detection method based on wavelet technique and robust RBF network.Transactions of the Institute of Measurement and Control35, 8 (2013), 1046–1057.
[39] J. Takeuchi and K. Yamanishi. 2006. A unifying framework for detecting outliers and change points from time series.IEEE Transactions on Knowledge and Data Engineering18, 4 (2006), 482–492.
[40] Hui-xin Tian et al. 2016. An outliers detection method of time series data for soft sensor modeling. InProceedings of the 28th Chinese Control and Decision Conference (2016 CCDC). IEEE, Piscataway, NJ, 3918–3922.
[41] Jonathan Von Brünken, Michael E Houle, and Arthur Zimek. 2015.Intrinsic Dimensional Outlier Detection in High-Dimensional Data. Technical Report.
Technical report, National Institute of Informatics, Tokyo.