TRISTAN: Electromagnetic, gravimetric and seismic
measurements to investigate the Tristan da Cunha hot spot and its role in the opening of the South-Atlantic.
Cruise No. MSM20/2
January 17, 2012 – February 15, 2012 Walvis Bay (Namibia) – Recife (Brazil)
M. Jegen, W. Geissler, M. Maia, K. Baba, H. Kirk
Editorial Assistance:
DFG-Senatskommission für Ozeanographie
MARUM – Zentrum für Marine Umweltwissenschaften der Universität Bremen 2015
institutions. The opinions expressed in the MARIA S. MERIAN-Berichte are only those of the authors.
The MARIA S. MERIAN expeditions are funded by the Deutsche Forschungsgemeinschaft (DFG) and the Bundesministerium für Bildung und Forschung (BMBF).
Editor:
DFG-Senatskommission für Ozeanographie
c/o MARUM – Zentrum für Marine Umweltwissenschaften Universität Bremen
Leobener Strasse 28359 Bremen
Telefon: +49-431-600-2560 Telefax: +49-431-600-2915 E-Mail: mjegen@geomar.de Author:
Dr. Marion Jegen
Helmholtz Centre for Ocean Research Kiel Section Dynamics of the Ocean Floor Wischhofstr. 1-3
D-24148 Kiel
Citation: M. Jegen, W. Geissler, M. Maia, K. Baba, H. Kirk (2015) – TRISTAN: Electromagnetic, gravimetric and seismic measurements to investigate the Tristan da Cunha hot spot and its role in the opening of the South-Atlantic – Cruise No. MSM20/2 – January 17 – February 15, 2012 – Walvis Bay (Namibia) – Recife (Brazil). MARIA S. MERIAN-Berichte, MSM20/2, 52 pp.,
DFG-Senatskommission für Ozeanographie, DOI:10.2312/cr_msm20_2
_________________________________________________________________________________
ISSN 2195-8483
TABLE OF CONTENTS ... PAGE
1 Summary ... 3
2 Participants ... 3
3 Research Program ... 5
4 Narrative of the Cruise ... 6
5 Preliminary Results ... 12
5.1 Bathymetry ... 12
5.2 OBEM Deployment and Installation of MT Land Station Nightingale ... 20
5.3 OBS Deployment and Installation of Land Seismometer Nightingale ... 24
5.4 Gravimetry ... 31
5.5 Rock Sampling of the Tristan da Cunha Island for Geochemical Analysis... 43
6 Ship’s Meteorological Station... 46
7 Station List MSM20/2... 46
8 Data and Sample Storage and Availability ... 51
9 Acknowledgements ... 51
10 References ... 51
Attachment 1: Tristan and Isolde Blog ... 53
1 Summary
According to classical plume theory, the Tristan da Cunha hotspot is thought to have played a major role in the rifting of the South Atlantic margins and the creation of the aseismic Walvis Ridge by impinging at the base of the continental lithosphere shortly before or during the breakup of the South Atlantic margins. But Tristan da Cunha is enigmatic, as it cannot be clearly identified as a hot-spot but classifies also highly as a more shallow type of anomaly that may actually have been caused by the opening of the South Atlantic. The equivocal character of Tristan is largely due to lack of geophysical data in this region. To understand the tectonic processes of the opening of the South Atlantic, the formation of the Walvis ridge and to understand whether Tristan da Cunha is the cause or the consequence of rifting, it is of central importance to characterize the region around Tristan da Cunha in a more coherent way. Within this research cruise we deployed 26 ocean bottom electromagnetic stations (OEBM) and 24 ocean bottom seismometer (OBS) for a long term acquisition (1 year) of magnetotelluric and seismological data, acquired bathymetry and gravity data and performed geological sampling on Tristan da Cunha. The data will be interpreted in the context of geochemical data and tectonic models developed within the SPP1375‚
South Atlantic Margin Processes and Links with onshore Evolution (SAMPLE).
Zusammenfassung
Nach klassischer Plume-Theorie wird dem Auftreffen des Tristan da Cunha Hotspots eine zentrale Rolle im Aufbruch des Süd-Atlantiks und bei der Kreation des aseismischen Walvis Rücken zugeschrieben. Jedoch konnte Tristan da Cunha bis heute nicht zweifelsfrei als Hotspot identifiziert werden. Andere Studien gehen davon aus, dass es sich bei Tristan da Cunha eher um eine flachere Anomalie handelt, die sich als Konsequenz des Aufbruchs des Kontinents entwickelt hat. Die zweifelhafte Rolle Tristan da Cunha ist auch dem Mangel an geophysikalischen Daten in dieser Region zuzuschreiben. Um die Dynamik des Aufbruchs des Süd- Atlantik besser verstehen zu können und um abzuklären, ob Tristan da Cunha die Ursache oder Konsequenz des Aufbruchs ist, ist es von zentraler Bedeutung, die Region um Tristan da Cunha genauer zu untersuchen. Im Rahmen dieser Ausfahrt wurden deshalb 26 OBEM und 24 OBS Stationen für eine einjährige Aufzeichnung von magnetotellurischen und seismologischen Daten, bathymetrische und gravimetrische Daten aufgenommen sowie eine geologische Beprobung der Insel Tristan da Cunha durchgeführt. Die Daten werden im Rahmen des Schwerpunktprogramms SPP1375 SAMPLE (South Atlantic Margin Processes and Links with onshore Evolution) im Kontext mit geochemischen und tektonischen Modellen interpretiert.
2 Participants
Name Discipline Institution
Dr. Jegen, Marion Marine Geophysics / Chief Scientist GEOMAR
Dr. Geissler, Wolfram Marine Geophysics AWI
Dr. Maia, Marcia Marine Geophysics UBO
Dr. Sigloch, Karin Marine Geophysics LMU
Dr. Vexler, Ilya Geology TU-BERLIN
Dr. Kleiding, Jakob Geology GFZ
Sommer, Malte Marine Geophysics GEOMAR
Hosseini, Kasra Geophysics LMU
Staehler, Simon Geophysics LMU
Dr. Baba, Kiyoshi Marine Geophysics TOKYO
Ota, Toyanobu Marine Geophysics TOKYO
Kirk, Henning Marine Technician AWI
Wollatz-Vogt, Martin Marine Technician GEOMAR
Schröder, Patrick Marine Technician GEOMAR
Schwartz, Olav Marine Technician GEOMAR
Rannou, Cathrine Artist/Architect RENNES
Bloch, Wasja Student TU-BERLIN
Kapp, Gerhard
(passenger to Tristan da Cunha)
Civil Engineer WSP
Retief, Marthinus
(passenger to Tristan da Cunha)
Civil Engineer WSP
Madlener, Dominik
(passenger to Tristan da Cunha)
Technician LIEBHERR
GEOMAR: Helmholtz Institute of Ocean Research, Kiel, Germany
AWI: Alfred-Wegener-Institut für Polar- und Meeresforschung, Bremerhaven, Germany TOKYO: Earthquake Research Institute, University of Tokyo
UBO: Universite de Bretagne Occidentale, Brest, France LMU: Ludwig Maximilians University, Munich, Germany GFZ: Geoforschungszentrum, Potsdam, Germany
TU-BERLIN: Technical University of Berlin, Berlin, Germany WSP: Southafrican Coastal Engineering Company LIEBHERR: Crane Manufacturing Company, Nenzing, Austria
5HVHDUFK3URJUDP
)LJ7UDFNFKDUWRI590$5,$60(5,$1&UXLVH0%DWK\PHWU\IURP6PLWKDQG6DQGZHOO
7KHUHVHDUFKSURJUDPRQ7ULVWDQGD&XQKDFRPSULVHGJHRSK\VLFVDQGJHRFKHPLVWU\
*HRSK\VLFV
7ZRFKDUDFWHULVWLFVRIDPDQWOHSOXPHDUHDQLQFUHDVHLQWHPSHUDWXUHDQGWKHSUHVHQFHRISDUWLDO PHOWLQWKHPDQWOHUHJLRQ(OHYDWHGWHPSHUDWXUHVORZHUWKHVHLVPLFYHORFLW\GHQVLW\DQGGHFUHDVH WKHHOHFWULFDOUHVLVWLYLW\&RQVWDEOH'XED6FKPHOLQJDDQG6FKPHOLQJ 7KHVDPHLVWUXHIRUWKHSUHVHQFHRISDUWLDOPHOW,PSRUWDQWFRPSOHPHQWDU\LQIRUPDWLRQLQVHLVPLF YHORFLW\DQGHOHFWULFDOUHVLVWLYLW\H[LVWWRLGHQWLI\WKHVHDUHDV:KLOHVHLVPLFYHORFLWLHVLQWKHSDUWLDO PHOW]RQHPDLQO\GHSHQGRQWKHPHOWIUDFWLRQWKHHOHFWULFUHVLVWLYLW\LQWXUQGHSHQGVRQWKHPHOW IUDFWLRQDQGWKHFRQQHFWLYLW\RIWKHSDUWLDOPHOWVXFKWKDWDMRLQWLQWHUSUHWDWLRQRIGDWDZRXOGPDNH WKHGHWHUPLQDWLRQRIERWKWKHIUDFWLRQRIPHOWLQJDQGFRQQHFWLYLW\RIWKHSDUWLDOPHOWSRVVLEOH$V WKHIUDFWLRQRIPHOWLQJDQGWKHFRQQHFWLYLW\RIVWURQJO\EXR\DQWPHOWLQSDUWLFXODUGHWHUPLQHWKH G\QDPLFV RI WKH V\VWHP WKH NQRZOHGJH RI WKHVH IDFWRUV LV RI RXWPRVW LPSRUWDQFH IRU WKH XQGHUVWDQGLQJRIWKHG\QDPLFVRIWKHV\VWHPDVDZKROH7KHVDPSOLQJRIWKHDQRPDO\DWPDQWOH GHSWK UHTXLUHV WKH XVH RI SDVVLYH HOHFWURPDJQHWLF DQG VHLVPLF PHWKRGV DQG WKH DFTXLVLWLRQ RI PDULQHJUDYLW\GDWD$SODQQHGDFWLYHVRXUFHVHLVPLFH[SHULPHQWKDGXQIRUWXQDWHO\WREHFDQFHOOHG GXHWRODFNRIIXQGLQJ$FFRUGLQJO\ZHPRGLILHGWKHLQLWLDOO\SODQQHGOD\RXWRIWKH2%6DORQJ SURILOHVWRZDUGVDJULGVWUXFWXUHZKLFKEHWWHUDFFRPPRGDWHGWKH'VHLVPRORJLFDODVSHFWDQG07 GDWDDFTXLVLWLRQ7RFDSWXUHVXIILFLHQWHDUWKTXDNHVDVZHOODVDFTXLUHVXIILFLHQWO\ORZIUHTXHQF\
HOHFWURPDJQHWLFGDWDWKH2%(0DQG2%6VWDWLRQVZHUHGHSOR\HGIRUDORQJWHUPGDWDDFTXLVLWLRQ
of 1 year. Altogether 26 OBMT (18 from GEOMAR and 8 from University of Tokyo) and 24 OBS (AWI) were deployed in a region of approximately 500 km x 500 km to capture the potential plume. Additionally two seismic and one MT land stations on the neighbouring uninhabited Nightingale Island were installed for the same period of time. The land stations are on loan from the German geophysical instrumentation pool at the Geoforschungszentrum Potsdam. The recovery of all stations is planned for January/February 2013 during a second MARIA S. MERIAN Cruise.
For gravimetric measurements a marine gravimeter of the type KSS-32-M by the Bodensee Gravimeter System has been implemented on MARIA S. MERIAN and been operated during the cruise.
The geophysical data acquisition is accompanied by bathymetric data acquisition in an effort to map seafloor expressions of the volcanic hot-spot activity. Due to the extra days of ship time available after the active source seismic experiment had to be cancelled, we intensified our bathymetric mapping towards a region south of Nightingale, along the Tristan da Cunha fracture zone and towards the ridge and furthermore included geochemical investigations in our scientific work plan.
Geochemistry:
The objective of onshore sampling of the main island of the Tristan da Cunha archipelago was to obtain lava samples suitable for (1) extraction of noble gases for a study of the isotopic composition of He and Ne, and (2) investigation of geochemical diversity of parental magmas by means of microprobe studies of early olivine and pyroxene phenocrysts, and olivine-hosted melt inclusions.
4 Narrative of the Cruise January 17th:
We left the port of Walvis Bay at around 9AM local time to start our research cruise towards Tristan da Cunha. During the first days of the transit, the unpacking of gear in the different laboratories began and the instruments checked for proper electronic functioning and damage from transit.
January 18th:
Still on transit to working area. Acquisition of sound velocity profile:
18/01 07:45 25° 23.515’ S 010° 07.038’ E 1800 m January 19th:
Acquisition of sound velocity profile:
19/01 07:43 28° 00.434’ S 005° 23.569’ E 1800 m
To test the functionality of the releaser, all releasers for the OBEM and OBS stations were tested.
The test consisted of tying closed releasers in a wire box (OBS) and SPUTNIK electromagnetic source (OBEM), lowering the contraptions to 3000 m, sending an open release signal to each releaser and checking whether the release hook has opened once the releasers were back on deck.
January 20th:
Acquisition of sound velocity profile:
20/01 07:54 29° 49.717’ S 002° 01.285’ E 600 m
Bathymetric reading reduced from about 4000m to 1500 m, as we joined up with Walvis Ridge, a volcanic mountain chain produced by the Tristan Hot-Spot, which connects Africa with Tristan da Cunha.
January 21st:
Acquisition of sound velocity profile:
21/01 09:33 32° 05.081’ S 002° 13.607’ W 800 m January 22nd:
We have reached the investigation area. The first deployment of OBEM (TRIS01) and OBS (TDC01) stations took place between 22:30 and 22:45 UTC.
January 23th:
Deployment of three OBS stations (TDC02, TDC03, and TDC04) and OBEM stations (TRIS02- G, TRIS03-G, TRIS04-T).
Fig. 4.1 First sighting of Tristan da Cunha, late afternoon on January 24th.
January 24th:
Deployment of five OBS stations (TDC05 to TDC09) and five OBEM stations (TRIS05-G, TRIS06-G, TRIS07-G, TRIS08-T and TRIS09-G) and first sighting of Tristan da Cunha (see figure 4.1)
January 25th:
In the morning, the immigration officer of Tristan da Cunha was picked up at Tristan Island and ferried to R/V MARIA S. MERIAN by our first officer and immigration formalities were taken care of for the researchers and crew. Captain R. Schmidt, first engineer A. Schüler, chief scientist Marion Jegen and co-chief scientist Wolfram Geissler then left with the officer to Tristan and met the UK governor Sean Burns and the Tristan Island Council to organize the land expedition to
Nightingale Island where land seismic and magnetotelluric stations were to be installed. For the land operation, Tristanians offered the use of two of their local ships to ferry the equipment from Tristan to Nightingale Island. The land expedition to Nightingale was to be accompanied by three Tristanians. M. Jegen and W.Geissler furthermore visited the local geomagnetic observatory on Tristan da Cunha.
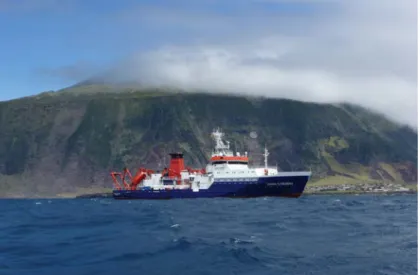
Fig. 4.2 RV MARIA S. MERIAN in front of Tristan da Cunha.
Upon return on the MARIA S. MERIAN, two geologists, Dr. I. Vexler and Dr. J. Kleiding were ferried to Tristan da Cunha accompanied by C. Rannou to collect samples for the geochemical analysis for the coming 5 days. Furthermore, our passenger engineers, G. Kapp, M.Retief and D.
Madlener left for Tristan da Cunha to start their work on the Tristan’s harbor fortification.
Deployment of three OBS stations (TDC10 to TDC12) and four OBEM stations (TRIS11-T, TRIS12-G, TRIS13-T).
January 26th:
Deployment of four OBS stations (TDC14 to TDC17) and four OBEM stations (TRIS14-G, TRIS15-T, TRIS16-G, TRIS17-G).
January 27th:
Deployment of three OBS stations (TDC18 to TDC20) and three OBEM stations (TRIS18-G, TRIS19-T, TRIS20-G).
January 28th:
Deployment of four OBS stations (TDC21, TDC22, TDC23, TDC25) and five OBEM stations (TRIS21-T, TRIS22-G, TRIS23-G, TRIS24-T and TRSI25-G).
January 29th:
Deployment of last OBS station (TDC26) and OBEM station (TRIS26-G) and return to Tristan da Cunha. In exchange for the hospitality of the Tristanians, we invited them for a visit on the RV MARIA S. MERIAN in the afternoon. The offer was accepted by eleven Tristanians (including the governor Sean Burns and his wife). Marion Jegen, W. Geissler, Henning Kirk, Martin Wollatz- Vogt and Kioshi Baba were transferred then with the land station equipment to Tristan da Cunha from where the expedition to Nightingale was to be started early the following morning. In
exchange, the geologist I. Vexel and J. Kleiding and C. Rannou returned from Tritsan da Cunha to RV MARIA S. MERIAN.
January 30th:
Land expedition: Equipment and scientists were ferried with two small Tristanian vessels onto Nightingale Island, which is the remenance of a former volcanic edifice. Due to the fact that there is no water source on the island and it is uninhibited, however, various huts have been erected by Tristanians as a summer holiday getaway. The only possible landing was flat rocks on the east shore of Nightingale. From there a trail leads into the island and the bird sanctuary on Nightingale.
Nightingale Island is densely populated by birds, large colonies of rock hopper penguins, thrushes and albatross and is also the home of a large seal population. Along the trail, we installed two OBS land stations (see section 5.3) and one MT stations (see section 5.2) on the very day powered by solar panels. Installations were finished in the early evening and we spent the night in Tristanian hut (see figure 4.3).
The RV MARIA S. MERIAN crew and remaining scientists ferried to Tristan da Cunha to explore the island for one day (see figure 4.4). One of the tour organized by the Tristanians took the participants to the site of the volcanic eruption in 1961. At that time the eruption destroyed the only natural harbor and the lobster factory on the island and forced the Tristanians to evacuate to Great Britain. However, most of them returned within a few years to Tristan, where they constructed a new harbor and fish factory.
Fig. 4.3 Landing at the east shore of Nightingale (top left) and huts, in which we stayed overnight (top right).
View on Nightingale and landing spot taken from one of the small fishing vessels that picked us up (bottom right) and of the vessel Edinburgh (bottom left), which ferried us back to Tristan (background bottom left).
In the late evening, after crew and scientists returned to RV MARIA S. MERIAN, bathymetric profiling mapping around Tristan continued in an effort to find the site of a 2004 underwater volcanic eruption. The eruption at the time caused tremors felt by Tristanians and a wash up of pumice a few days after the eruption on the eastern beaches of Tristan da Cunha.
January 31st:
Land expedition: In the morning of the next day, we checked that the stations are still running and then waited at the landing site to be picked up the Edinburgh, a lobster fishing boat in the area (see figure 4.3). Transfer to the vessel was achieved via small fishing boats belonging to the Edinburgh that are used to check the numerous lobster traps in the vicinity. We arrived back at Tristan in the late afternoon. Meanwhile the RV MARIA S. MERIAN continued its bathymetric mapping.
Fig. 4.4 View from the walk to the potato patches (top left), the site of the volcanic eruption (top right), inside of the fish factory (bottom left) and the harbor (bottom right).
February 1st:
The land expedition members were ferried back to RV MARIA S. MERIAN together with a much appreciated return gift by the Tristanians consisting of 50 fresh lobsters. During the day, a newly developed marine electromagnetic source called Sputnik was tested in the shallow water before Tristan.
In the evening, we started a closed bathymetric mapping on a site south of Nightingale, where in the previous mapping from January 30th/31st bathymetric readings seemed to deviate from satellite data. Within the region, we found indeed an edifice of a volcanic eruption (see figures 5.1.6 and 5.1.7).
February 2nd:
We continued our bathymetric mapping and left in the evening the working area towards the Mid- Atlantic Ridge. Our stay at Tristan da Cunha was suitable commemorated by a splendid lobster dinner, which were excellently prepared and presented by the cooks of RV MARIA S. MERIAN.
February 3rd:
Transit to Mid-Atlantic Ridge and bathymetric mapping along the Tristan Fracture zone.
February 4th:
Arrival at Mid-Atlantic Ridge in the early morning and start of a bathymetric mapping at the Mid- Atlantic Ridge from the south to the north across the intersection of the Tristan Fracture zone with the Mid-Atlantic Ridge. On February 4th at 16.25 W and 38.4 S a core complex structure could be identified (see figure 5.1.8).
February 5th and 6th:
Bathymetric mapping of Mid-Atlantic Ridge segment.
February 7th:
End of bathymetric mapping. After another test of Sputnik transmitter (see figure 4.5) we left the working area for transit to Recife, Brazil.
Fig. 4.5 Newly developed electromagnetic Sputnik transmitter which was undergoing last testing at the Mid- Atlantic Ridge.
February 9th:
Enjoyable day spent with a Barbeque on deck.
February 12th to 14th:
Packing and cleaning of lab space.
February 15th:
Arrival at Suape, Brazil. Gravimetric tie measurement at the pier in Suape.
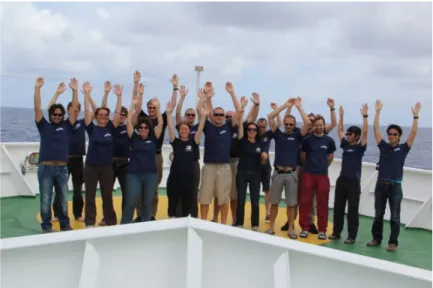
Fig. 4.6 Scientific crew photo before arrival at Suape.
Another narrative of the cruise can be found in the Tristan and Isolde Blog on the GEOMAR website, which is also included as an attachment to this document.
5 Preliminary Results
5.1 Bathymetry (Marcia Maia)
The echo sounder of MSM is an EM120 from Simrad-Konsberg with 191 beams mounted on the keel of the ship. Data was acquired almost continuously during the cruise, acquisition being interrupted during stations for deployments and for sound velocity profiles. The ship’s speed varied from 13 kn during the transits and during the deployments to 8 kn during the surveys around Tristan da Cunha, the Tristan da Cunha Fracture Zone and the Mid-Atlantic Ridge. The quality of the data varied considerably during the cruise, being extremely noisy during the fast speed lines (see section Data Quality Evaluation). The maximum opening angle also varied during the cruise, being set to 56-56 for the fast speed lines and up to 64-64 for the slow speed survey lines, since most of the external beams were lost at fast speeds. This resulted in an extremely variable ratio width/depth for the swath.
Sound Velocity Profile
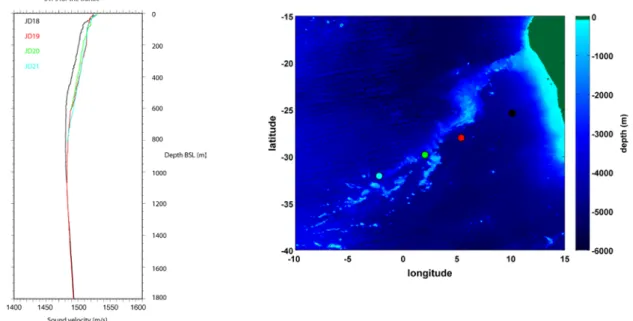
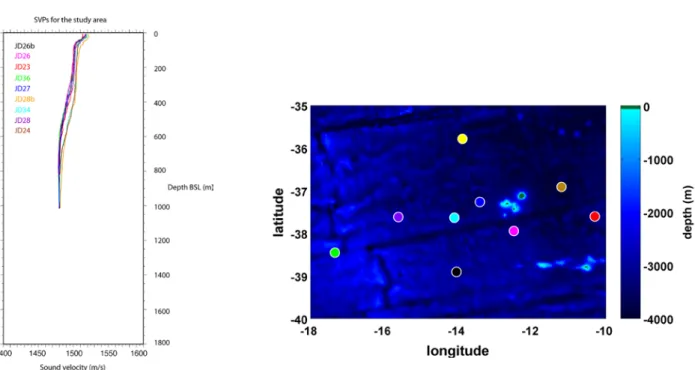
13 sound velocity profiles (SVP) were acquired during the cruise, 4 during the transit from Walvis Bay to the deployment area (figure 5.1.1), 7 on the deployment area and 2 near the Mid-Atlantic Ridge (MAR) (see figures 5.1.2 and 5.1.3). In the deployment area and at the MAR, the strategy for the choice of the SVP stations was geographical, trying to cover the area in a relatively homogeneous way. During the transit, we chose to perform one station/day. The sound velocity was measured with the help of a SVPlus from Applied Microsystems, which measures directly the sound speed every 1s during the deployment and stands up to 200 bar pressure (~2000 m depth).
Two casts reached 1800 m depth, the majority being between 800 to 1000 m where the strongest variations in the upper water layer occur. The instrument is deployed with the ship stopped, using a lateral winch the lowers it at a speed of 0.8m/s. Please refer to table in section 7 for a complete listing of SVP stations.
Fig. 5.1.1 Sound velocity profiles on transit from Walvis Bay to Tristan da Cunha.
The profiles made during the transit show strong variability between the first day, when we were still close to the coast and the following days, where the water column was more uniform. The two first casts went down to 1800 m but the profiles were identical for depths below 1000m. We thus chose to limit our casts to this depth for time reasons.
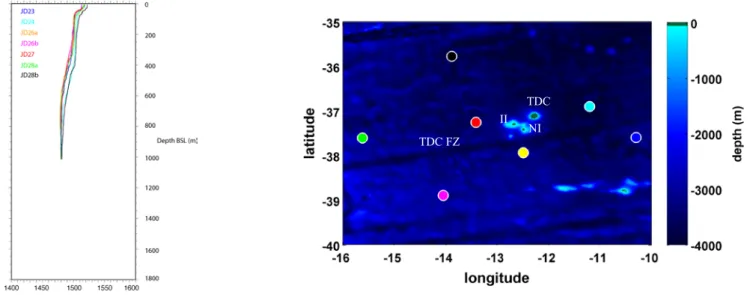
SV profiles around Tristan da Cunha, on the deployment area, show a large variability, especially between the north (JD24 and 28b) and the south and west. Significant differences exist for the depth range of 200 to 600 m, as well as in the upper layers. The profiles were entered in the sounder software according to the ship’s location during this part of the mapping and during the following surveys.
Two additional SVPs were made during the survey one north of the Tristan da Cunha FZ and one near the axis of the MAR. These profiles were used together with the westernmost SVPs of the deployment area (JD26b and JD28b) to correct for the sound speed in this part of the survey.
The main differences occur in the upper water layer and at greater depths (200 to 600 m) two groups can be distinguished: profiles JD28b and JD34 (03/02) and JD26b and JD36 (05/02).
The sound velocity was, as expected, very heterogeneous over the study area, probably due to mixing of water masses by strong currents at both the surface and at intermediate depths.
Fig. 5.1.2 Sound velocity profiles in deployment area around Tristan da Cunha (TDC), Nightingale Island (NI), Inaccessible Island (II) and Tristan da Cunha Fracture Zone (TDC FZ).
Fig. 5.1.3 Sound velocity profiles on Tristan da Cunha Fracture Zone (TDC FZ) and Mid-Atlantic Ridge. Also shown are the locations of Tristan da Cunha (TDC), Nightingale Island (NI) and Inaccessible Island (II).
TDC TDC FZ NI
TDC TDC FZ NI
TDC NI TDC FZ
II
Fig. 5.1.4 Overview of sound velocity profiles in area of investigation. TDC, II and NI denote the positions of Tristan da Cunha, Nightingale Island and Inaccessible Island, TDC FZ the Tristan da Cunha fracture zone.
Data Quality Evaluation
Multibeam data was extremely noisy during most of the cruise. While part of this can be due to the fast speed of the ship during transit between deployment stations (12 to 13 kn) and to rough weather, some characteristic problems were also observed during the slower survey lines (8 kn) and in good sea states (see figure 5.1.5). These problems consist of a sudden trough or peak (most often a trough) over a certain number of beams. The pings located at about 1000 m from the keel both at port and starboard sides often presented these anomalies. These artefacts were not always easy to identify in the beam profiles when close to high topography and considerably lengthened the time allowed to the data processing. Part of the problem with the pings may arise from cavitation near the hydrophones that may trouble the reception of the signal. However, the fact that the problem was also observed at slow speed and calm seas suggest that a verification of the sounder by the constructor should be considered.
TDC NI TDC FZ II
Fig. 5.1.5 Above: Example of noisy pings for a survey line at 8 kn. Below: The same for 12.8 kn.
External beams were sometimes noisy, especially during rougher sea states or headings facing the wind and at these conditions we chose to narrow the sounder angle to prevent excessive ping loss.
Survey Lines and Processing
Additional ship time allowed surveying the area around the islands of Tristan, Inaccessible and Nightingale, the Tristan da Cunha Fracture zone and the adjacent segments of the MAR. These survey lines were made at 8 kn to reduce the noise on the data. The profile spacing was variable.
At the MAR, a 5 miles spacing allowed an almost full coverage of two ridge segments. The fracture zone was partly surveyed, with close spacing south of the Tristan group, where the predicted bathymetry suggested possible volcanic infill of the trough, and a more lose crossing between the
islands and the MAR. The location of the transits between the deployment stations help to improve this part of the survey. Close to Nightingale, the survey was designed to cover the potential site of the 2004 submarine eruption, east-northeast of the island.
Data was processed using the MBSystem software. The navigation parameters were checked for each file and found to be good. Due to the high noise level of the data, we chose not to apply automatic filters and to edit the data manually using mbedit.
Preliminary Results Nightingale Volcano:
The Tristan authorities provided us with a report from the British Geological Survey by Hards, 2004 (BGS International and Corporate Development Commissioned Report CR/04/235), which investigated a potential volcanic eruption in late July/August 2004. It states that during the time the inhabitants of the island felt a suite of tremors, furthermore pumice was discovered by cray fishers on Sandy Point Beach (figure 5.1.6), located at the East of the island (see figure 5.5.1).
Prevailing currents suggest a source of the volcanic eruption south or southwest of Tristan da Cunha. Volcanic activity has also been indicated by seismic activity recorded by the seismometers on Tristan [maintained by the Comprehensive Test Ban Treaty Organisation (CTBTO) as part of the International Monitoring System (IMS)] on 29/30July and attributed to pressurization due to magma ascent beneath the vent area. Concern of the imminent eruption of Tristan volcano itself were mitigated since there was no sign of increased thermal activity or ground deformation - such as increased rock fall activity or disruption of any man-made structures on the island.
Based on the report and bathymetric survey around the island, we have found a strong deviation in the GEBCO bathymetric and ship board bathymetric data ESE of Nightingale Island (Figures 5.1.7 and 5.1.8). Subsequent analysis of the ship bathymetric data showed the presence of a volcano reaching 200 m below the sea surface. Location and topography of the volcano suggest that it might be the source of the 2004 eruption.
Fig. 5.1.6 Left: Pumice deposits in the inter-tidal and splash zones on Runaway Beach, 18 September 2004. Right:
Fresh pumice collected from the surface of the sea by island’s fisherman on August 3rd, 2004 (left) and pumice found around the high-tide mark on the beach St. Cave point on Sept. 23rd (from Hards, 2004).
)LJ &RPSDULVRQRI*(%&2EDWK\PHWULFGDWDOHIWZLWKVKLSERDUGEDWK\PHWU\ULJKW,QVKLSERDUG EDWK\PHWU\DQHZO\GLVFRYHUHGYROFDQRQDPHG,VROGHZKLFKUHDFKHVXSWRDSSUR[PEHORZ VHDVXUIDFH LV RXWOLQHG 66: RI 7ULVWDQ 7KH ORFDWLRQ RI ,VROGH DJUHHV ZHOO ZLWK WKH SUHGLFWHG GLUHFWLRQLQIHUUHGIURPSXPPLFHGLVWULEXWLRQVRQ7ULVWDQ¶VFRDVWE\DQHUXSWLRQLQ
)LJ &RORXUHG'YLHZIURPVRXWKHDVWRIWKHVLWHRISRVVLEOHHUXSWLRQLQ
&RUH&RPSOH[
$QRWKHUJHRORJLFDOO\LQWHUHVWLQJIHDWXUHZDVREVHUYHGDWWKH0$5ZKHUHDFRUHFRPSOH[ZDV LGHQWLILHGDWWKHQRUWKHUQHQGRIWKHVHFWLRQVRXWKRIWKH7ULVWDQGD&XQKDIUDFWXUH]RQHVHHILJXUH 7KHH[LVWHQFHRIVXFKDFRUHFRPSOH[LQGLFDWLQJDPDJPDVWDUYHGVHFWLRQRIWKH0$5LV VXUSULVLQJ JLYHQ WKH SUR[LPLW\ RI WKH 7ULVWDQ GD &XQKD YROFDQLF FRPSOH[ DQG WKH DVVRFLDWHG WHPSHUDWXUHDQRPDO\LQWKHUHJLRQ,WPLJKWLQGLFDWHDVRPHZKDWGHFUHDVHGWKHUPDODQRPDO\LQ WKHUHJLRQ7KHFRUHFRPSOH[LVUDWKHUODUJHZLWKDQHDVWZHVWH[WHQVLRQRIDSSUR[NPDQGD QRUWKVRXWKH[WHQVLRQRIDERXWNP(OHYDWLRQZLWKUHVSHFWWRWKHVXUURXQGLQJPHDQVHDIORRU OHYHOLVDSSUR[P
Fig. 5.1.9 Bathymetric data showing the core complex in a 3D view from south-west (top) and as shaded relief map (bottom).
5.2 OBEM Deployment and Installation of MT Land Station Nightingale (M. Jegen and K. Baba)
Magnetotellurics is a passive electromagnetic geophysical method for imaging the electrical resistivity structure (reciprocal to conductivity) of the subsurface. Electrical resistivity varies strongly due to temperature and presence of melt, such that this type of measurement is of great interest in the investigation of Tristan da Cuna. The method is founded on the observation that naturally occurring fluctuations of the Earth's magnetic external field induce electric currents whose strength and distribution depend on the subsurface resistivity.
Variations of the horizontal electric and three-component magnetic fields are recorded on the ocean bottom to derive a spectral, complex-valued impedance tensor Z given by Z Hh = Eh where Eh and Hh denote the frequency-dependent horizontal electric (Eh) and magnetic (Hh) field vectors.
In a homogenous half-space, the so-called skin depth δ is a crude estimate of detection depth with δ = sqrt (ρ T) in kilometers, (where T is the period in seconds and ρ is the bulk resistivity). At periods shorter than approximately 1 s, seafloor electromagnetic signals are very small. This is due to the high conductivity of the sea water above, which causes attenuation according to skin depth and thus reduces the resolvability of shallower sea-bottom features. To have some estimates of shallow features at least locally, we have installed a land station (provided by GFZ Potsdam) on Nightingale Island.
For the experiment it was essential to cover a possibly large region around Tristan da Cunha.
To ensure sufficient number of instrumentation and for scientific reasons, we collaborated with one of the leading marine electromagnetic groups in the world in the Earthquake Research Institute (ERI) at the University of Tokyo. Prof. H. Utada and Prof. K. Baba were able to raise Japan’s funding for the project and could thus join the cruise with 8 marine MT instruments. From the German side we deployed 18 stations, which were all instruments available during that period.
Instrument description GEOMAR OBEM
The instrument carrier is based on the OBS DEPAS pool ‘LOBSTER’ design and consists of a titanium frame on which syntactic foam elements are mounted to give the frame a positive buoyancy. For deployment, a concrete slab is attached to the frame as an anchor (anchors consisting railway racks usually used for seismic deployments cause a disturbance/bias in the magnetic field readings) through a releaser. The frame is equipped with a titanium cylinder containing the battery pack and with a smaller titanium cylinder containing the 3 component fluxgate magnetometer with a precision of 10 pT/sqrt(Hz) and a data logger (provided by Magson GmbH, Berlin). The latter records magnetic and electric field variations, tilt variations, temperature and time. Timing of the measurement is kept via a Seascan temperature controlled crystal which is synchronized to GPS prior to deployment (typical drift < 500 ms/year). The logged data is stored on a removable SMD card. Orthogonal horizontal electric field measurements are performed through voltage difference measurements between non-polarizable silver-silver chloride electrodes (Clover Tech Ltd, Japan) separated by plastic pipes mounted between frame and anchor to span a 10 m electric dipole. The consumption of the data logger and fluxgate
magnetometer is on the order of 800 mW, such that the battery is sufficient to power the instrument for a period of 5 months. After this point in time the logging is shut off and merely the timing crystal remains powered. Data sampling has been set to 10 sec. Figure 5.2.1 shows a photo of a GEOMAR OBEM station during deployment.
ERI, University of Tokyo OBEM
The ERI OBEM, made by Tierra Tecnica, Ltd., consists of two pressure glass spheres and four plastic pipes mounted on a titanium frame (Figure 5.2.2). It has a magnetometer and electrometer in one of the glass spheres and the acoustic electronics and batteries in the second glass sphere.
Silver-silver chloride electrodes (productions of Clover Tech, Ltd.) are fastened into the ends of the 2.5m plastic pipes, giving total span of 5.4 m for the measurement of two horizontal components of the electric field. Because the voltage differences between four electrodes on the end of the pipes to a reference electrode fastened on the middle of a pipe are measured, it has redundancy to reproduce the two horizontal components of the electric field even if one channel fails to record good data. The OBEM also measure the two components of the instrumental tilts and temperatures near the flux-gate magnetic sensor and the data logger. The resolutions are 0.01 nT for the magnetic field, 0.0002 μV/m for the electric field, 0.00026 degrees for the tilts, and 0.00014 ºC and 0.01ºC for the temperature near the magnetic sensor and the data logger, respectively.
All data are recorded internally on a flash card. The sampling interval is set 60 seconds for five OBEMs deployed at the stations Tris04, 08, 15, 21, and 24 and is switched from 10 seconds to 60 seconds after one month from the start of the measurement and switched to 10 seconds again after further 10 months for three OBEMs deployed at the stations Tris11, 13, and 19. The magnetometer runs just ±3 seconds of every sampling interval and sleeps in the other periods to save the power consumption, which is 186.5 mA during the measurements and 6.4 mA during idling for 12 V.
The acoustic transponder triggers the burn-wire to release ~80 kg concrete ballast weight, allowing the instrument to float back to the surface for recovery. A radio beacon and a flashing light are also mounted on the titanium frame, which help to find the instrument on sea surface.
Fig. 5.2.1 GEOMAR OBEM.
Fig. 5.2.2 ERI OBEM.
Installation of Magnetotelluric Land Station on Nightingale
The magnetotelluric instrument was supplied by the Geophysical Instrument Pool of the GFZ in Potsdam. The configuration used for the low frequency MT signal recording were a Geomagnet Fluxgate Magnetometer , 4 silver-silver chloride electrodes in holes filled with bentonite and aligned north-south and east-west to form two orthogonal dipoles with a length of 53.16 m and 40 m respectively, a signal preconditioning board (Castle E-Sensor Box) and a GFZ Earth Data Logger (EDL). The station was powered through a 12 V battery recharged by solar panels. Time
OLQHRIWKHUHFRUGLQJZDVVXSSOLHGWKURXJKD*36VLJQDODQGWKHGDWDVDPSOLQJUDWHZDVVHWWR +]$VWKHORFDWLRQIRUWKHLQVWUXPHQWDWLRQZHFKRVHDVLWHDORQJWKHSDWKLQWRWKHLQWHULRURIWKH LVODQGVHHILJXUHZKLFKZDVIODWVXFKWKDWWKHGLSROHVFRXOGEHOD\HGRXWDSSUR[LPDWHO\
KRUL]RQWDOO\7KHVWDWLRQZDVLQVWDOOHGRQ-DQXDU\WK DQGFKHFNHGZKHWKHULWZDVVWLOOZRUNLQJ RQ-DQXDU\VW
)LJ /RFDWLRQRI1LJKWLQJDOHODQG07VWDWLRQYLHZIURPDSSUR[QRUWKDQGSKRWRRIVWDWLRQSKRWRLQVHUW
'HSOR\PHQWRIPDULQH2%(0
7KH GHSOR\PHQW RI WKH PDULQH 2%(0 ZHUH RSWLPL]HG WR DFKLHYH D JRRG ' FRYHUDJH RI WKH SRWHQWLDOSOXPHDUHDVHHILJXUHDQG2%(0DQG2%6ZHUHFROORFDWHGWRHQVXUHVLPLODUGDWD FRYHUDJHIRUWKHVHLVPLFDQGHOHFWURPDJQHWLFGDWD3OHDVHUHIHUWRVHFWLRQIRUDFRPSOHWHOLVWLQJ RIFRRUGLQDWHVRIVWDWLRQV
)LJ /RFDWLRQVRIMRLQWO\RFFXSLHGVHDIORRU%%2%62%(0VWDWLRQVHQFLUFOHGWULDQJOHV2%(0VWDWLRQV RQO\WULDQJOHVDQGMRLQWO\RFFXSLHG07DQGVHLVPLFVWDWLRQRQ1LJKWLQJDOH,VODQGHQFLUFOHGGLDPRQG DURXQG7ULVWDQGD&XQKD
2%6'HSOR\PHQWDQG,QVWDOODWLRQRI/DQG6HLVPRPHWHU1LJKWLQJDOH :+*HLVVOHU+.LUN.6LJORFK.+RVVHLQL66WlKOHU:%ORFK
2QHPDMRUWDVNVRIWKH,62/'(SURMHFWLVWKHGHSOR\PHQWRIRFHDQERWWRPVHLVPRPHWHUVDURXQG 7ULVWDQGD&XQKD7KH\ZLOOEHXVHGWRVWXG\WKHGHHSOLWKRVSKHULFDQGXSSHUPDQWOHDWWKHSUHVHQW SRVLWLRQRIWKH7ULVWDQGD&XQKDKRWVSRWPDQWOHSOXPHE\PHDQVRISDVVLYHVHLVPLFPHWKRGV 'XULQJ060ZHGHSOR\HGEURDGEDQGRFHDQERWWRPVHLVPRPHWHUV2%6IURPWKH*HUPDQ '(3$6 LQVWUXPHQW SRRO FRRUGLQDWHG E\ WKH $OIUHG :HJHQHU ,QVWLWXWH IRU 3RODU DQG 0DULQH 5HVHDUFK%UHPHUKDYHQDQG*)=3RWVGDP
,QVWUXPHQWDWLRQ
'(3$6 /2%67(5 /RQJWHUP2FHDQ%RWWRP6HLVPRPHWHU IRU7VXQDPL DQG(DUWKTXDNH 5HVHDUFKVHHILJXUH.07PDQXIDFWXUHGE\.808PZHOWXQG0HHUHVWHFKQLN.LHO
*PE+*HUPDQ\DUHXVHGGXULQJWKHH[SHULPHQW7KH\DUHHTXLSSHGZLWKD*UDOS&0*7 EURDGEDQG VHLVPRPHWHU LQFRUSRUDWHG LQ D WLWDQLXP SUHVVXUH KRXVLQJ D K\GURSKRQH DQG D
GEOLON MCS (Marine Compact Seismocorder) data logger from SEND GmbH Hamburg, Germany. The electric power supply for the recorder and the seismometer is granted by 180 lithium power cells. Generally each sensor channel is sampled at 50 Hz, however, larger disk space allowed a sampling at 100 Hz for 2 OBS stations. The preamplifier gain of the hydrophone channel is set to 4 and is set to 1 for the three seismometer components. The total disk space of the stations is 20 GB (2 OBS with 32 GB). The disk space should be enough for a recording time of >12 months, also taking into account that there might be an increased noise level around the islands.
The clock of the data loggers were synchronized by GPS time before deployment and will be synchronized again after recovery of the instruments. The time difference during the recording period will then be corrected linearly. The seismometers are equipped with a cardanic levelling mechanism, which will be initiated a few hours after deployment, when the OBS is located on the seafloor, and then every 21 days.
Fig. 5.3.1 Photograph of the LOBSTER during deployment (Photograph by K. Ota).
Releaser Test
The KUMQUAT release unit is the most important part of the OBS for a secure recovery. To assure the proper operation of the release units under deployment conditions in the deep sea, we performed two release tests with 13 and 15 release units, respectively. The releasers were fixed with clamps and cable straps in an iron cage (see figure 5.3.2) and brought down to 3000 m depth using the winch (in the Hangar). At first we tried to communicate via the ship’s mounted transducer/hydrophone with the release units. But, we did not get answers from the release units.
Therefore, we decided to use the mobile cable-based transducer (hydrophone). Normally, the acoustic release code of each release unit was sent twice. Then we got answers from almost all release units. After recovery on board all release hooks were open, confirming the proper operation of the release units at the average operation depth.
Fig. 5.3.2 Photograph of the releaser test configuration (Photograph by M. Retief).
Parameters of test 1: station MSM20/016-2 19.01.2012, 08:44 – 10:46 UTC
27° 54.456' S, 05° 34.074' E, 3000 m depth all tested13 releaser units released
test 2: station MSM20/017-2 20.01.2012, 08:44 – 10:09 UTC
29° 50.074' S, 02° 0.824' E, 3000 m depth all tested15 releaser units released
No MCS SN GPS Sync Date
GPS Sync Time
GPS skew Date
GPS skew Time
Skew (us)
Pred. Skew per year (sec) 1 050902 26.01.2012 11:45:51 28.01.2012 12:45:53 1718 0,31
2 050906 26.01.2012 10:32:36 27.01.2012 09:54:32 -63 -0,02 3 050907 24.01.2012 15:03:30 25.01.2012 21:14:28 -907 -0,26 4 050921 19.01.2012 19:18:00 20.01.2012 16:08:16 1062 0,45 5 050924 26.01.2012 12:50:09 28.01.2012 12:52:54 406 0,07 6 050930 26.01.2012 10:06:38 26.01.2012 21:17:44 -219 -0,17 7 060704 24.01.2012 20:04:06 27.01.2012 09:39:30 -5844 -0,83 8 060708 26.01.2012 08:55:32 26.01.2012 19:55:47 93 0,07 9 060713 25.01.2012 19:35:50 26.01.2012 14:19:19 156 0,07 10 060715 24.01.2012 15:58:24 25.01.2012 21:56:43 468 0,14 11 060720 21.01.2012 15:38:13 22.01.2012 18:40:43 250 0,08
No MCS SN GPS Sync Date
GPS Sync Time
GPS skew Date
GPS skew Time
Skew (us)
Pred. Skew per year (sec) 12 060723 26.01.2012 13:04:33 27.01.2012 13:42:30 125 0,04
13 060724 26.01.2012 11:21:52 27.01.2012 13:30:18 -282 -0,09 14 060725 19.01.2012 13:25:25 22.01.2012 14:11:01 5031 0,61 15 060728 25.01.2012 20:00:00*) 26.01.2012 13:56:46 -625 -0,31 16 060729 19.01.2012 13:40:06 22.01.2012 10:03:00 -1438 -0,18 17 060734 28.01.2012 15:16:08 28.01.2012 18:23:34 -719 -2,02 18 060735 24.01.2012 08:37:48 24.01.2012 14:37:53 31 0,05 19 060735 18.01.2012 13:57:23 20.01.2012 14:02:26 -282 -0,05 20 060738 17.01.2012 13:07:32 22.01.2012 15:10:38 -2594 -0,19 21 060739 19.01.2012 19:32:29 20.01.2012 16:15:07 93 0,04 22 060740 18.01.2012 18:42:46 22.01.2012 14:59:47 -29969 -2,84 23 060740 23.01.2012 14:57:46 24.01.2012 13:50:15 -7344 -2,81 24 060742 18.01.2012 18:24:07 22.01.2012 09:57:06 2031 0,20 25 060743 18.01.2012 09:28:00 21.01.2012 14:02:55 156 0,02 26 091104 18.01.2012 12:44:52 20.01.2012 13:49:13 -2813 -0,50 27 091107 17.01.2012 19:02:55 20.01.2012 13:19:14 1125 0,15
*) time estimated
Table 5.3.1: Results of GPS synchronisation tests
Due to the problems with synchronisation of the internal clock, we decided to perform tests of all recorders (see table 5.3.1). This was possible due to the long transit from Walvis Bay to the first deployment site. We mounted the recorders in the pressure tubes and started recording as it is usually done for deployment. In some cases seismometers and hydrophones were also mounted and connected to the recording unit. For almost all recorders we got acceptable skew values (drift of the internal clock). Assuming a linear behaviour, the estimated drift for one year of operation will hopefully result in values less than +-0.5 s. Two recorders show drift values above -2 s. For one of these recorders this high value was confirmed by a second short test. Most probably this clock drift is real and might be caused by a previous re-calibration. Due to some problems with another recorder, one recorder had to be mounted shortly before final deployment of a station.
Therefore, it had not been tested for GPS synchronisation. This has to be done after recovery in 2013. GPS synchronisation was done with the antenna on the winch control room or with the antenna at the working deck (airgun deployment run).
Station Preparation and Deployment
Leaving Walvis Bay we started to mount the first twelve instruments parallel to the testing of recorders. More instruments could not be mounted at the same time due to limited space on the working deck (there were additional 26 OBMT stations from GEOMAR Kiel and ERI Tokyo).
Fixing the anchor and cables was done without problems. Before the final programming the GPS quality was checked. Normally we got >9 satellites and an HDOP value of less than 1.0.
Sometimes, mostly in the evenings, only 7 satellites were available and the HDOP was then about 1.3. For the final synchronisation we used the GPS antenna on the roof of the winch control room and sometimes at the airgun deployment run. Programming of the recording units was done without major problems; all sensors seemed to work properly. Finally, deployment of all 24 BB- OBS was done with starboard crane and release hook without major problems (see figure 5.2.4) . At positions 13 and 24 no OBS were deployed (only OBMT stations). Please refer to section 7 for a complete listing of the stations’ coordinates.
Nightingale Island Land Seismometer Installation
To complement the ocean-bottom network and the existing station on Tristan da Cunha, Dr. W.
Geissler and H. Kirk also installed two land instruments on Nightingale Island. We prepared the first site NIG01 completely during the first day, and later also prepared the basement of the second site NIG02. In the morning of January 31st, we finished the second site and controlled the proper operation of NIG01 before we left the island at noon.
Land Instrumentation
Two land stations from DEPAS instrument pool were installed. Each of it is composed of a seismometer (Guralp-3ESP Compact 60s), data logger (Earth Data), GPS antenna, breakout box, two solar panels, and rechargeable battery (65 Ah). The solar panels were placed on steel racks prepared in the AWI workshop. The angle for the panels was chosen to get the best insulation during the austral winter month. Hopefully, at least one station will get enough solar power to record until next year. As recording parameters we chose 100 Hz sampling rate and low gain (0.4).
Land Deployment Sites
The first station was deployed on the trail starting from the east landing point. The second was installed at the crossroad, where the trails from east and west landing meet (see figures 5.2.3, 5.3.3 and 5.3.4). The groundings of the station were not perfect, at least for the second site. Since there was no space to put the station on hard rock cropping out at the coastline (e.g., due to a penguin colony), we decided to place the station into the ground along the trail. At two spots we dug holes to prepare a small basement of concrete (app. 13 litre at each site). At the first site the concrete was placed on most probably re-deposited weathered bedrock (epiclastic material), which seems to be a rather good grounding for the station (see figure 5.3.3). At the second site we dug the hole in a thick sequence of soil and something similar to peat (little bit oily, former lake deposits?). Due to the limited time, missing alternatives and breeding birds everywhere aside from the trail, we decided to install both stations in the already prepared hole.
station date (UTC)
time
(UTC) latitude longitude elevation (m) NIG01 30.01.12 22:43 37° 25.063' S 12° 28.547’
W 40
NIG02 31.01.12 05:15 37° 25.078' S 12° 28.654'
W (>40)
Table 5.3.2: Land station deployment parameters
(Mis-)Orientation of the Land Seismometers
The seismometers were oriented using a magnetic compass (±5°) knowing already that there might be a problem with a potential mis-orientation in the South Atlantic and on volcanic rocks.
Additionally we measured the North direction with a GPS based compass. We got a deviation of about 22 degrees (measured from magnetic North). According to the magnetic maps of RV Maria S. MARIA S. MERIAN, the magnetic mis-orientation is -23.5° in the study area. That’s why the acquired data has to be corrected for that value before analyses.
Fig. 5.3.3 Preparation of seismometer basement at site NIG01.
Fig. 5.3.4 Final setup of station NIG01. The seismometer is placed beneath the solar panels. This might be a potential problem during windy days.
5.4 Gravimetry
(H. Kirk, M. Maia and W.H. Geissler)
During the entire cruise leg MSM20/2 gravimetric measurements were carried out. An exception is the 200 miles zone of Brazil, where data acquisition has been stopped, besides a spot measurement in the harbour of Suape.
The instrument of type KSS-32-M used on the survey delivers values of relative gravity only.
To gain absolute values and to correct for instrumental drift, two tie measurements at the beginning and at the end have been performed with a land gravimeter La Coste & Romberg (L&R) model G, S/N 877 in Walvis Bay, Namibia and Recife, Brazil, respectively.
The error estimations are consisting of the sum of the instrument error by factory and a maximum error assumption, gained by observing fluctuations during the measurements (e.g.
caused by road traffic. In parts, errors are reduced the common way by averaging. A tide correction was not applied, which may increase the errors by 0.1mgal.
Gravity Tie Measurements
Measurements in Walvis Bay, Namibia
In Walvis Bay, three onshore measurements, both manually and with a feedback unit, at two different sites were taken with the L&R land gravimeter. For reasons of consistency, only the feedback values will be used for the determination of absolute gravity. At each spot, the instrument was placed on a tripod-plate. The internal temperature of the instrument showed a constant value of 49,8°C during the measurements.
Taking into account, that the sites belong to a cargo harbour with a high amount of activities, vibrational disturbance was low. By observation it is estimated to ±0.05 mgal. Factory repetitivity is given within ±0.02 mgal, which sums to an error of ±0.07 mgal.
The total relative gravity Gtot,rel for each measurement with the L&R land gravimeter was derived by the help of the instrument's specific interpolation table as follows: All measured values M lay in-between 2400 and 2500 counter units (CU), which means to have a scale fix value of 2400 CU and thereby a calibration fix C of 2454.6 mgal. The valid calibration factor f is 1.02327.
Additionally, the feedback unit delivers the offset FO straight in mgal. So, we have:
Gtot,rel = C + f(M-2400) + FO = 2454.6 mgal + 1.02327(M-2400) + FO WAL A, Harbour Pier, Walvis Bay, Namibia
(Gravity: 978822.839±0,06 mgal)
WAL A was chosen next to the ship on the pier between the bollards No. 42 and No. 43 at closest distance to the sea gravimeter on board R/V Maria S. MARIA S. MERIAN (figure 5.4.1). This distance was calculated to be 11,80±0,2m horizontally. The vertical distance, of course, changed in between the two measurements due to the tide and to bunkering fuel meanwhile. Fixed vertical distance is from the bottom of the sea gravimeter's sensor to the top of the reeling of the working deck, which equals to RS = 3.34±0.05m.
With the measured, time dependant, distances RW (top of reeling – water surface) and LW (land gravity meter – water surface) we retrieve the instruments vertical distance to
D = - RS - (LW - RW),
whereby a negative D has the meaning of a lower altitude of the sea gravimeter, compared to the L&R.
Station Description Date Time UTC Rel. Gravity Gtot,rel
[mgal]
Abs. Gravity Gabs
[mgal]
WAL A Harbour Pier, next to ship 22°57'11.7'' S 14°29'33.6'' E
15.01.12 11:25 – 11:35 2485.000 ± 0,03 978822.852±0.06
WAL B Harbour, Gravity Base, Code No.
431AAD 22°56'56.8'' S 14°29'56.7'' E
15.01.12 12:24 – 12:48 2484.900 ± 0,03 978822,752
(no error
declared)
WAL A Harbour Pier, next to ship 22°57'11.7'' S 14°29'33.6'' E
15.01.12 14:45 – 15:03 2484.974 ± 0,03 978822.826±0.06
Table 5.4.1: Parameters of Tie measurement in Walvis Bay
Fig. 5.4.1 Tie measurement site at the pier in Walvis Bay. The yellow stripe at the ship marks the horizontal position of the gravimeter inside the ship.
At this site WAL A, the measurements have been carried out twice: First at the very beginning and a second repetitive measurement after intermediate activities at WAL B. The two tables below show the results. A minor error might have been affected to this data by the fact, that the counter values have not been approached from the same side. The manually taken values of WAL A, 1st measurement, vary from 2485.24 mgal to 2485,37 mgal and though show an offset of roughly 0.3 mgal compared to the feedback measurements. The manually taken values of WAL A, 2nd measurement, vary from 2485.30 mgal to 2485,39 mgal and though show an offset of roughly 0.35 mgal compared to the feedback measurements.
Time UTC
Counter Reading [CU]
Feedback Offset
±0.05 [mgal]
Counter Reading
±0.02 [mgal]
Total Gravity Gtot,rel
±0.07 [mgal]
11:27:45 11:26:15 11:25:00 11:25:??
11:30:00 11:31:45 11:33:35 11:34:30
2428.00 2428.50 2429.00 2429.50 2430.00 2430.50 2431.00 2431.50
+1.745 +1,240 +0.745 +0.230 -0.240 -0.760 -1.420 -1.920
2483.252 2483.763 2484.275 2484.786 2485.298 2485.810 2486.321 2486.913
2484.997 2485.003 2485.020 2485.016 2485.058 2485.050 2484.901 2484.913 Table 5.4.2: First feedback measurement at site WAL A, Jan 15th, 2012, 11:25 – 11:35 UTC
Time UTC
Counter Reading [CU]
Feedback Offset
±0.05 [mgal]
Counter Reading
±0.02 [mgal]
Total Gravity Gtot,rel
±0.07 [mgal]
14:45:45 14:48:00 14:51:00 14:55:30 14:57:45 14:59:45 15:02:30
2431.50 2431.00 2430.50 2430.00 2429.50 2429.00 2428.50
-1.855 -1.391 -0.790 -0.290 +0.200 +0.685 +1.175
2486.833 2486.321 2485.810 2485.298 2484.786 2484.275 2483.763
2484.978 2484.930 2485.020 2485.008 2484.986 2484.960 2484.938 Table 5.4.3. Second feedback measurement at site WAL A, Jan 15th, 2012, 14:45 – 15:03 UTC
WAL B, Harbour of Walvis Bay, Namibia, Gravity Base, Station Code 431AAD (Gravity: 978822,752 mgal)
WAL B is a gravity station in the harbour area of Walvis Bay close to the harbour masters office.
It was set up in May 1997, named WALVIS-W17 with the Code No. 431AAD, published in GIMDG-97-032. It is no IGSN station. The station consists of a nail in a concrete strip in between a berthing and a parking area. Further marks are missing, but the position could be confirmed by use of a GPS handheld Garmin Oregon 450t. Table 4 lists the measurements.
The manually taken values of WAL B vary from 2485.216 mgal to 2485.287 mgal and show again an offset of roughly 0.35 mgal compared to the feedback measurements.
Fig. 5.4.2 Gravity tie point WALVIS-W17. The measurement table stands above the marking nail.
Fig. 5.4.3 Gravity tie point WALVIS-W17. Note the marking nail in the centre.
Time UTC
Counter Reading [CU]
Feedback Offset
±0.05 [mgal]
Counter Reading
±0.02 [mgal]
Total Gravity Gtot,rel
±0.07 [mgal]
12:24:30 12:25:45 12:27:15 12:28:30 12:30:35 12:33:00 12:34:55 12:36:05
2431.50 2431.00 2430.50 2430.00 2429.50 2429.00 2428.50 2428.00
-1.985 -1.435 -0.915 -0.390 +0.140 +0.650 +1.135 +1.645
2486.833 2486.321 2485.810 2485.298 2484.786 2484.275 2483.763 2483.252
2484.848 2484.886 2484.894 2484.908 2484.926 2484.924 2484.898 2484.897 Table 5.4.4. Feedback measurement at site WAL B, Jan 15th, 2012, 12:24 – 12:48 UTC Absolute Gravity at Sea Gravitymeter's Position in Walvis Bay
With the above gained values, the absolute gravity at the pier can be determined:
Gabs(WAL A,1st ) = Gabs(WAL B) + (Gtot,rel(WAL A,1st) – Gtot,rel(WAL B))
= 97882.752 mgal +(2485.000 ±0.03 mgal – 2484.900 ±0.03 mgal) = 978822.852 ±0.06 mgal
and
Gabs(WAL A,2nd ) = Gabs(WAL B) + (Gtot,rel(WAL A,2nd) – Gtot,rel(WAL B))
= 97882.752 mgal +(2484.974 ±0.03 mgal – 2484.900 ±0.03 mgal) = 978822.826 ±0.06 mgal
That gives by averaging the absolute gravity at the pier in Walvis Bay next to the ship:
Gabs(WAL A) = 978822.839 ±0.06 mgal
The sea gravimeter was continuously in operation, while the onshore measurements were conducted. In parallel to both measurements at WAL A, the vertical distance D of the instruments has been derived. With Lw1 = 4.235±0.05 m and Rw1 = 4.37±0.05m, one get D1 = -3.19±0.15 m and likewise with Lw2 = 3.825±0.05 m and Rw2 = 4.17±0.05m follows D2= 2.92±0.15 m, which gives two opportunities for free air correction, in order to gain the absolute gravity at the sea gravimeter's location Gabs(KSS):
Gabs(KSS,1st) = Gabs (WAL A) + 0.3086 mgal/m * D1
= 978822.839±0.06 mgal + 0.3086 mgal/m * 3.19±0.15m = 978823.823±0.11 mgal
Gabs(KSS,2nd) = Gabs(WAL A) + 0.3086 mgal/m * D2
= 978822.839±0.06 mgal + 0.3086 mgal/m * 2.92±0.15m = 978823.740±0.11 mgal
Finally, by averaging, the absolute gravity at the sea gravimeter in Walvis Bay is:
Gabs(KSS, WAL A) = 978823.78 ±0.11 mgal
The mean of the readings of KSS32 during time period of the land-based measurements gives - 1609.804±0.02 mgal. The error of the KSS is declared to be 0.5 mgal for each single measurement and so decreases the common way by taking the average. So, with the K-factor of the instrument of 0.901:
Gtot,rel(KSS,WAL A) = -1450.433±0.02 mgal ,
which corresponds to 978823.78 ±0.11 mgal on 15.01.2012 at 15:03 UTC.
Measurements in Suape and Recife, Brazil
The tie measurements in Brazil were carried out the same way like in Namibia. The first measurement was done next to ship on the pier in Suape. Afterwards we went to the old town of Recife, where an absolute gravity station is situated. This is roughly 50 km away from the harbour of Suape, where no reference gravity station is installed by now. The final measurement was taken again next to the ship.
During the whole procedure no problems aroused. The L&R was put on the plate again. Its temperature showed a slight fluctuation between 49.7°C and 49.8°C. The vibrations in the harbour had a stronger effect compared to Walvis Bay and caused an error of ±0.08 mgal. In Recife it was again ±0.05 mgal. With the help of the interpolation table, we calculate the gravity with C = 1738.51 mgal and f = 1.02280:
Gtot,rel = C + f(M-1800) + FO = 1738.51 mgal + 1.0228(M-1800) + FO
Station Description Date Time UTC Rel. Gravity Gtot,rel
[mgal]
Abs. Gravity Gabs
[mgal]
SUA Harbour Pier, next to ship 08º23'24.6'' S 34º58'12.3'' W
15.02.1 2
13:30 – 13:42
1826.828±0.04 978164.910±0.09
REC B Recife, Old Town, Gravity Base “Recife B”
Code No. 101109 08º03'47.3'' S 34º52'16.1'' W
15.02.1 2
15:17 -15:37 1823.634±0.02 978161.716±0.031
SUA Harbour Pier, next to ship 08º23'24.6'' S 34º58'12.3'' W
15.02.1 2
17:20 -17:30 1826.725±0.04 978164.807±0.09
Table 5.4.5: Parameters of Tie measurement in Suape and Recife, Brazil
SUA, Harbour Pier, Suape, Brazil (Gravity: 978164.859±0.09 mgal)
The site SUA on the pier of the harbour of Suape, between bollard no. 4 and no. 5, had the same relative position to the ship like in Walvis Bay. Therefore, the horizontal distance is again 11.80±0.2 m and the vertical distances are given by D = - RS - (LW – RW) (s.a.).
The single feedback measurements are shown in tables 6 and 7. A manual measurement at this site was done only once. Values spread from 1827.123 mgal to 1827.192 mgal with a mean offset of 0.34 mgal compared to the feedback measurements.
Time UTC
Counter Reading [CU]
Feedback Offset
±0.08 [mgal]
Counter Reading
±0.02 [mgal]
Total Gravity Gtot,rel
±0.10 [mgal]
13:30 13:31 13:34 13:36 13:37 13:39 13:40 13:42
1788.0 1787.5 1787.0 1786.5 1786.0 1785.5 1785.0 1784.5
-1.688 -1.183 -0.673 -0.170 +0.348 +0.887 +1.386 +1.903
1828.516 1828.005 1827.494 1826.982 1826.471 1825.959 1825.448 1824.937
1826.828 1826.822 1826.821 1826.812 1826.819 1826.846 1826.834 1826.840
Table 5.4.6: First feedback measurement at site SUA, Feb 15th, 2012, 13:30 – 13:42 UTC
Time UTC
Counter Reading [CU]
Feedback Offset
±0.08 [mgal]
Counter Reading
±0.02 [mgal]
Total Gravity Gtot,rel
±0.10 [mgal]
17:20:04 17:2?:??
17:2?:??
17:2?:??
17:24:15 17:22:26 17:28:09 17:29:07
1788.0 1787.5 1787.0 1786.5 1786.0 1785.5 1785.0 1784.5
-1.725 -1.285 -0.779 -0.277 +0.235 +0.777 +1.267 +1.773
1828.516 1828.005 1827.494 1826.982 1826.471 1825.959 1825.448 1824.937
1826.791 1826.720 1826.715 1826.705 1826.706 1826.736 1826.715 1826.710
Table 5.4.7: Second feedback measurement at site SUA, Feb 15th, 2012, 17:20 – 17:30 UTC REC B, Old Town of Recife, Brazil, Gravity Base, Official Station Name “Recife B”, Station Code 101109
(Gravity: 978161.716±0.031 mgal)
Recife B is an IGSN station in the middle of the place “Placa do Marco Zero”, which is the major place of the old town. The station is easy to identify, because it is a monument as well, consisting of a bronze disc of roughly 1 m in diameter. Although at that time, there was a buzz of activities in order to prepare for the carnival, the measurement ran without any problems. The manually taken values of REC B vary from 1824.010 mgal to 1824.093 mgal and show in average an offset of 0.42 mgal compared to the feedback measurements.
Time UTC
Counter Reading [CU]
Feedback Offset
±0.08 [mgal]
Counter Reading
±0.02 [mgal]
Total Gravity Gtot,rel
±0.10 [mgal]
15:17:15 15:20:00 15:22:00 15:23:45 15:25:45 15:27:25 15:29:45 15:31:45 15:33:45 15:36:35
1788.0 1787.5 1787.0 1786.5 1786.0 1785.5 1785.0 1784.5 1782.0 1781.0
-4.865 -4.405 -3.860 -3.371 -2.845 -2.325 -1.790 -1.300 +1.279 +1.270
1828.516 1828.005 1827.494 1826.982 1826.471 1825.959 1825.448 1824.937 1822.380 1821.357
1823.651 1823.600 1823.634 1823.611 1823.626 1823.634 1823.658 1823.637 1823.659 1823.627 Table 5.4.8: Feedback measurement at site REC B, Feb 15th, 2012, 15:17 – 15:37 UTC, Absolute Gravity at Sea Gravimeter's Position in Suape
Gabs(SUA,1st ) = Gabs(REC B) + (Gtot,rel(SUA,1st) – Gtot,rel(REC B))
= 978161.716 ±0.031 mgal + (1826.828 ±0.04 mgal – 1823.634 ±0.02 mgal) = 978164.910 ±0.09 mgal
and
Gabs(SUA,2nd ) = 978164.807 ±0.09 mgal
That gives by averaging the absolute gravity at the pier in Suape next to the ship:
Gabs(SUA) = 978164.859 ±0.09 mgal