Isolation of Kaempferol Glycosides from Ginkgo biloba Leaves and Synthesis,
Identification and Quantification of their major in vivo Metabolites
DISSERTATION
ZUR ERLANGUNG DES DOKTORGRADES DER NATURWISSENSCHAFTEN (DR. RER. NAT.) DER NATURWISSENSCHAFTLICHEN FAKULTÄT IV
DER UNIVERSITÄT REGENSBURG
vorgelegt von Daniel Bücherl aus Dieterskirchen
2013
Die vorliegende Arbeit entstand im Zeitraum vom März 2010 bis Oktober 2013 unter der Leitung von Herrn Prof. Dr. Jörg Heilmann am Lehrstuhl für Pharmazeutische Biologie am Institut für Pharmazie der Naturwissenschaflichen Fakultät IV – Chemie und Pharmazie – der Universität Regensburg.
Das Promotionsgesuch wurde eingereicht im Oktober 2013 Tag der mündlichen Prüfung: 29.11.2013
Prüfungsausschuss:
Prof. Dr. Gerhard Franz (Vorsitzender) Prof. Dr. Jörg Heilmann (Erstgutachter) Prof. Dr. Joachim Wegener (Zweitgutachter) Prof. Dr. Frank-Michael Matysik (Drittprüfer)
Was du für den Gipfel hältst, ist nur eine Stufe.
Lucius Annaeus Seneca
Danksagung
Ein großes Dankeschön geht an alle die mir während meiner Promotion hilfreich zur Seite gestanden haben. Besonders möchte ich danken:
Prof. Dr. Jörg Heilmann für das Vertrauen und die Möglichkeit mir dieses interessante Projekt zu überlassen, für zahlreiche wertvolle Diskussionen und für die lehrreiche und schöne Zeit in seiner Arbeitsgruppe;
Dr. Egon Koch und Dr. Clemens Erdelmeier der Dr. Willmar Schwabe GmbH und Co. KG, für die Mitbetreuung dieser Arbeit, ihre zahlreichen wertvollen Beiträge, die hilfreichen Diskussionen, die Bereitstellung der Flavonoidfraktionen von EGb 761®, und die Durchführung der Fütterungsexperimente an den Ratten;
Dr. Willmar Schwabe GmbH und Co. KG für die grosszügige finanzielle Unterstützung dieser Arbeit;
meinen Kolleginnen und Kollegen am Lehrstuhl für Pharmazeutische Biologie sowie auch allen Praktikanten, für die freundliche Aufnahme in der Gruppe, das wunderbare Arbeitsklima und ihre Hilfsbereitsschaft. Weiterhin möchte ich mich dafür bedanken, dass die „lebhafte“
Gestaltung meines jeweiligen Arbeitsplatzes immer mit einem Lächeln hingenommen wurde.
Aus naturwissenschaftlicher Sicht sei angemerkt: „Ordnung ist das Unwahrscheinliche und deswegen eine Erscheinungsweise der Kunst.“ (Botho Strauß);
besonderer Dank gilt dabei Gabriele Brunner, für die Hilfe bei all den Problemen des Laboralltags und für die stetig freundliche Wegbeschreibung, wenn man mal wieder hektisch und unwissend auf der Suche nach diesem und jenem war;
besonderer Dank gilt auch Anne Grashuber, für die schöne Zusammenarbeit bei der Betreuung der Praktika und ihre freundliche Hilfsbereitschaft;
besonderer Dank gilt auch meinen Laborkolleginnen und Kollegen, Sarah Sutor, Magdalena Motyl, Marcel Flemming, Beata Kling und Michael Saugspier für viele förderliche Diskussionen, das bereitwillige und unkomplizierte Teilen der Arbeitsplätze und Geräte, aber auch für die unterhaltsamen und lustigen Momente im Labor;
besonderer Dank gilt auch Susann Haase, Anne Freischmidt, Susanne Knuth, Rosmarie Scherübl, Monika Untergehrer, Matej Barbič und Sebastian Schmidt für die Geduld beim Erklären der unterschiedlichen Laborgeräte und Methoden;
besonderer Dank gilt auch Markus Löhr und Stefan Wiesneth, für die Hilfe bei Software- Problemen und die damit einhergehende Übernahme der „Computer-Arbeit“ innerhalb der Arbeitsgruppe;
der spektroskopischen und spektrometrischen Abteilungen der Fakultät Chemie und Pharmazie der Universiät Regensburg für die nette Zusammenarbeit. Ein besonderer Dank geht hierbei and Herrn Fritz Kastner und Herrn Josef Kiermaier für die hilfreichen Diskussionen und die Ermittlung zahlreicher analytischer Daten;
den Mitarbeitern der Arbeitskreise von Herrn Prof. Dr. Armin Buschauer, Herrn Prof. Dr.
Burkhard König und Herrn Prof. Dr. Oliver Reiser für die freundliche Zusammenarbeit;
Paul Baumeister, Petr Jirásek und Andreas Kreuzer für die vielen hilfreichen Diskussionen und die Unterstützung;
meinen Freunden, die immer für Ablenkung gesorgt haben, wenn dies nötig war. Besonders die gemeinsame sportliche Freizeitgestaltung half nach langen Arbeitstagen;
meinen Eltern, Brigitte und Gerhard Bücherl, meinen Geschwistern Tonia und Katrin, und meiner Christina für die jahrelange Unterstützung, das Vertrauen und die Geduld. Ohne sie hätte ich es niemals bis hierhin geschafft. Ihnen ist die vorliegende Arbeit gewidmet.
~ 6 ~ Abbreviations
2D two-dimensional
AAPH 2,2'-azobis(2-amidinopropane) dihydrochloride ABTS 2,2'-azino-bis(3-ethylbenzothiazoline-6-sulphonic acid ACEI angiotensin-converting enzyme inhibition
ATP adenosine-5'-triphosphate CBG cytosolic -glucosidase CC column chromatography
CoA coenzyme A
CVD cardiovascular disease DCM dichloromethane
DMF N,N-dimethylformamide DMSO dimethyl sulfoxide EtOAc ethyl acetate EtOH ethanol
FCS/FKS fetal calf serum Glc -D-glucose HCl hydrochloric acid
HMBC heteronuclear multiple-bond correlation HMEC human microvascular endothelial cells HPLC high-performance liquid chromatography HSQC heteronuclear single-quantum correlation IC50 half maximal inhibitory concentration LOQ limit of quantification
LPH lactase phlorozin hydrolase MeOH methanol
MMP matrix metalloproteinase
~ 7 ~
NADH nicotinamide adenine dinucleotide
NADPH nicotinamide adenine dinucleotide phosphate NMR nuclear magnetic resonance
NOESY nuclear Overhauser effect spectroscopy NOS nitric oxide synthase
NP normal phase
ppm parts per million
R2 coefficient of determination ROS reactive oxygen species
RP reversed phase
RT room temperature
SN2 bi-molecular substitution SULT sulfotransferase
TCA tricarboxylic acid
tR retention time
UGT uridine 5'-diphospho-glucuronosyltransferase
UV ultraviolet
~ 8 ~
Table of Contents
1 General Introduction ...11
1.1 Flavonoids and their Role in Plants ... 11
1.2 Biosynthesis ... 12
1.3 Flavonoids as Food Ingredients ... 15
1.4 Flavonoid Activities and their Structural Essentials ... 16
1.5 Flavonoids containing Plants in Traditional Medicine ... 19
1.6 Objectives ... 20
2 Isolation and Quantification of Kaempferol Glycosides 21 2.1 Introduction ... 21
2.2 Material and Methods ... 24
2.2.1 Consumable Material ... 24
2.2.2 Columns and Stationary Phases for Isolation ... 24
2.2.3 Extract and Fractions ... 25
2.2.4 Instruments ... 25
2.2.5 Isolation of Flavonol Diglycosides ... 26
2.2.6 Isolation of Flavonol Triglycosides ... 27
2.2.7 Quantification of four Kaempferol Glycosides in EGb 761® ... 28
2.3 Results and Discussion ... 30
3 Synthesis of five expected Kaempferol Metabolites ... 43
3.1 Introduction: Synthetic Approach towards Flavonoid Glucuronides .... 43
3.2 Material and Methods ... 45
3.2.1 Consumable Material ... 45
3.2.2 Columns... 46
3.2.3 Instruments ... 46
3.3 Chemistry and Analytical Data ... 47
3.3.1 Synthesis of Kaempferol-4´-O--D-glucuronide ... 47
~ 9 ~
3.3.2 Synthesis of Kaempferol-7-O--D-glucuronide and Kaempferol-7,4’-di-O--D-
glucuronide... 55
3.3.3 Synthesis of Kaempferol-3-O--D-glucuronide ... 66
3.3.4 Synthesis of Kaempferol-7-sulfate ... 70
3.4 Results and Discussion ... 73
4 Quantification of Plasma Metabolites ... 84
4.1 Introduction ... 84
4.2 Material and Methods ... 86
4.2.1 Consumable Material ... 86
4.2.2 Instruments ... 86
4.2.3 Sample Preparation ... 88
4.2.4 Calibration Curve Parameter ... 88
4.2.5 Tentative Investigation with Glucuronidase and Sulfatase ... 89
4.3 Results and Discussion ... 90
4.3.1 Identification of Kaempferol Metabolites ... 93
4.3.2 Plasma Analysis by HPLC-MS ... 96
4.3.3 Quantification of Kaempferol Metabolites ... 97
5 Pharmacological Characterisation of Kaempferol and Conjugates ... 101
5.1 Introduction ... 101
5.2 Material and Methods ... 104
5.2.1 Consumable Material ... 104
5.2.2 Instruments ... 105
5.2.3 Neurotoxicity and Neuroprotection Assay ... 105
5.2.4 ORAC Assay ... 106
5.2.5 ICAM-1 Assay ... 106
5.2.6 Proliferation Assay ... 107
5.3 Results and Discussion ... 108
5.3.1 Neurotoxicity and Neuroprotection Assay ... 108
5.3.2 ORAC-Fluorescein Assay ... 111
~ 10 ~
5.3.3 ICAM-1 Expression ... 112
5.3.4 Proliferation Assay ... 113
6 Summary ...114
7 Zusammenfassung ...115
8 Literature ...117
9 Posters ... 123
10 List of Figures ... 123
~ 11 ~ 1 General Introduction
1.1 Flavonoids and their Role in Plants
Flavonoids are a group of plant secondary metabolites with more than 4000 described members (1999).1 They occur for instance in the epidermis of leaves and skin of fruits.2 The basic structure is a flavan skeleton, which consists of two six-membered aromatic rings, connected by a three carbon chain.2 Further oxidation and hydroxylation can form derivatives and thus the flavonoid family is divided into several subclasses (Figure 1).
Most of these flavonoids are glycosidated, which is, beside the substitution with hydroxyl groups, the reason for their hydrophilic properties.3 Nevertheless, also several more lipophilic conjugates with O-methyl or isopentyl groups are known.2
Flavan Flavone
Isoflavone Flavonol
Anthocyanidin
Flavanone
Flavan-3-ol
Figure 1: Generic structures of the major flavonoids2
The substitution with a sugar moiety is favoured at positions 3 or 7. Commonly found sugars are -D-glucose (Glc), α-L-rhamnose and -D-galactose. Further on, the glucose can be covalently bonded to a cinnamic acid moiety. In plants, flavonoids play an important role as pigments, to protect the plant from UV damage, in disease resistance and even for pollen development.4,2 The sub- group of H2O-soluble anthocyanins forms some pigments with pink, red, violet, blue and purple colors (Figure 2). These pigments and their variations are, among others, generated by the pH-depended interactions of anthocyanins with so-called copigments. Copigments like flavonol glycosides are often part of inter- or intra-molecular complexes. But also self-association mechanisms, metal complexation and even covalently linked conjugates via malonic acid (in Allium schoenoprasum) have been reported.5,6 The consequence is an enhancement and higher stability of the color.6 Anthocyanins and their copigments are generally located in the vacuoles of the petal epidermal cells,5 but also cell wall bounded flavonol glycosides like the yellow kaempferol-3-rhamnosylgalactoside can be found in Eustoma grandiflorum, which cannot be regarded as copigment, due to the spatial separation.5
1.2 Biosynthesis
The biosynthesis of the flavonoids is described briefly starting from the photosynthesis, also regarding the ongoing discussions in literature concering the compartimentation of the different steps.
Photosynthesis
Located in the chloroplasts, the photosynthesis uses the energy of the light for an electron transport chain to generate reduction potentials and in particular NADPH and the energy store molecule ATP. These reduction equivalents and “energy carriers” are further used in the Calvin cycle to generate carbohydrates. During the Calvin cycle, a triose phosphate is formed (glyceraldehyde 3-phosphate dihydroxyacetone-phosphate) which can either be
Cyanidin-3-O-
-D-glucoside (red to magenta
Pelargonidin-3-O-
-D-glucoside (orangen to red)
Delphinidin-3-O-
-D-glucoside (purple)
Figure 2: Anthyocyanins and their color
~ 13 ~
Figure 3: Structure of malonyl-CoA
transferred to the cytosol to support the synthesis of sucrose, or stay in the chloroplast to form starch.7 The final carbohydrate is not necessarily free glucose, but rather the disaccharide sucrose or the polysaccharide starch.7,8,9
Glycolysis
Glycolysis, which is localised in the cytosol and as well in plastids,7 produces energy in the form of ATP and the reduction equivalents NADH/H+. Starch, sucrose or dihydroxyacetone- phosphate are all able to enter the glycolysis. The first two have to be hydrolyzed to its monomers, phosphorylated and in the case of glucose 6-phosphate, converted to fructose 6- phosphate by hexose phosphate isomerase. Dihydroxyacetone-phosphate can enter the glycolysis directly after conversion to glyceraldehyde 3-phosphate (triose phosphate isomerase). One of the final products of glycolysis is pyruvate.7,8,9
Synthesis of Malonyl-CoA
In the next step, pyruvate from plastid located glycolysis undergoes decarboxylation to form acetyl-CoA. The latter is converted by acetyl-CoA carboxylase which involves the conjugation with hydrogen carbonate to form malonyl-CoA and is described as the first step in fatty acid biosynthesis.7,8,9
The pyruvate from cytosol located glycolysis instead can pass the outer membrane of the mitochondria by free diffusion and the inner membrane by a specific carrier protein. In the mitochondria, pyruvate is also converted by the pyruvate dehydrogenase complex to form acetyl-CoA. In the next step, acetyl-CoA undergoes tricarboxyl acid (TCA) cycle which results in the formation of citrate. Citrate is transported to the cytosol via an antiporter (oxaloacetate). In the cytoplasm, citrate is converted to acetyl-CoA by ATP citrate lyase.
Further on, acetyl-CoA is also transfered by acetyl-CoA carboxylase to form malonyl-CoA.7,
10,11,12
In general, acetyl-CoA can be found in at least four compartments namely in mitochondria (for the TCA cycle), in plastids (for de novo fatty acid biosynthesis), in peroxisomes (the product of β-oxidation of fatty acids) and in the cytosol.10,13
Malonyl-CoA is one of the essential elements for the final flavonoid biosynthesis.
Figure 5: Structure of phenylalanine
Figure 6: Structure of 4- coumaroyl-CoA
The Prechorismate Pathway or Shikimate Pathway
The prechorismate pathway seems to be located exclusively in plastids14 but also isoenzymes can be found in cytoplasma. The starting materials for this sequence are phosphoenolpyruvate and D- erythrose-4-phosphate. During glycolysis in the plastids, phosphoenolpyruvate is generated. Erythrose-4-phosphate is an intermediate in the regeneration of ribulose-1,5-bisphosphate (Calvin cycle) and in the pentose phosphate pathway. The reaction sequence is catalyzed by six enzymes and yields in chorismate.7,8,9
The Postchorismate Pathway
It is still not clear whether just plastids or even the cytosol has the ability of further conversion of chorismate to aromatic amino acids and thus, among others, phenylalanine.15 But most of the enzymes, which are necessary for this step (with the exception of cytosolic phenylpyruvate/4-hydroxyphenylpyruvate aminotransferase) were found in plastids.16
The Phenylpropanoid Pathway
Further enzymatic conversion of phenylalanine to cinnamic acid is catalyzed by phenylalanine ammonia-lyase (PAL), which can be found in the cytosol and is associated to the endoplasmic reticulum.17 Another enzymatic hydroxylation and conjugation with CoA leads to the formation of 4-coumaroyl-CoA.7
Figure 4: Structure of chorismate
~ 15 ~
Synthesis of Flavonoids
The association of 4-coumaroyl-CoA with three molecules of malonyl-CoA by the cytosol- located chalcone synthase results in the formation of tetrahydroxychalcone, a compound which can already be described as submember of the flavonoid family.17 Following isomerisation to the flavanone naringenin, hydroxylation at position 3 and finally the generation of a C2-C3 double bond by the oxidoreductase flavonol synthase is one possible way for the synthesis of the flavonol kaempferol.7
An additional glycosylation may also take place in the cytosol. The necessary enzyme, UDPG- flavonoid glucosyl transferase was also detected at the cytoplasmic side of the endoplasmic reticulum.17 Overall it seems to be most likely and beneficial, that the final steps in flavonoid biosynthesis might be managed by an enzyme complex.17
1.3 Flavonoids as Food Ingredients
Flavonoid glycosides are present in several consumed food products and beverages like herbs, vegetables, fruits, tea and wine. The estimated daily flavonoid intake in humans is subject of some studies. But most of the investigations just regard about 2-5 flavonoids. For instance Hertog et al. (1993) report a daily intake of the potentially anti-carcinogenic flavonols quercetin, kaempferol, myricetin, together with the flavones apigenin and luteolin of 23 mg/day in the Netherlands.1 Considering, that Arts et al. (2001) have measured an average catechin intake of 50 mg/day in the Netherlands as well, makes the problem for the
Figure 7: Final biosynthethic pathway to the flavonol kaempferol. Enzyme abbreviations: CHS, chalcone synthase; CHI, chalcone isomerase; F3H, flavanone 3-hydroxylase; FLS, flavonol synthase
Figure 8: Radical scavenging mechanism of kaempferol.27 DPPH: 2,2- diphenyl-1-picrylhydrazyl
investigation of total flavonoid intake obvious.18 The published averages differ between 0.154 mg/day (4 isoflavones, USA) and 63.9 mg/day (4 flavonols, 1 flavone, 2 isoflavones, Japan) and therefore in a wide range, depending on several variables like analyte, geography, investigated food and possibly even age and gender of the participants.19,20 A value for an estimated total flavonoid intake for USA adults is 189.7 mg/day based on a database which contains the flavonoid content in foods.21
1.4 Flavonoid Activities and their Structural Essentials
In mammals, flavonoids are known to have, among others, anti-inflammatory, anti-oxidative, anti-viral, anti-thrombotic and spasmolytic activities.22 The knowledge on molecular mechanisms which are responsible for these activities is limited. Nevertheless, flavonoids have, depending on their hydroxyl pattern and presence of a carbonyl group, the ability of free radical scavenging (Figure 8, Figure 9), metal ion chelating and enzyme inhibition.
Some free radicals like the nitric oxide radical NO∙ or the superoxide radical O2∙―
, are generated deliberately in vivo by phagocytes.23 The generation of nitric oxide also takes place in neurones and endothelial cells starting from L- arginine by the enzym nitric oxide synthase (NOS).24,25 This compound plays an important role as intracellular signal, transcellular messenger and cytotoxic species
~ 17 ~
Figure 9: Catechol radical scavening activity101
in the unspecific immune defence.26 But, as usual, the effect depends on concentration and environment and thus can also be destructive for DNA or important proteins. An excess of NO∙ can consequently cause cytotoxic and cytostatic effects.25 A further reaction of nitric oxide with the superoxide radical O2∙―
yields in the formation of peroxynitrite, which is directly cytotoxic.25 The free radical scavenging activity of flavonoids is based on the oxidizability of the B- and C-ring. The oxidation of the compound and thus the reduction and deactivation of the nitric oxide- and other radicals proceeds in two steps.27
Another part of the anti-oxidative effect of some flavonoids is the interaction with metal ions. The reason for this effect might be on one hand the chelating of the metal and a higher anti-oxidative potential of the resulting complex (e.g. quercetin/2Co2+, Figure 10).28 On the other hand flavonoids can protect for instance low-density lipoprotein from directly Cu2+-induced oxidation by chelating this ion.29 But in this context it has to be mentioned that these interactions depend strongly on the structure of the flavonoid and metal ion concentration. So even pro-oxidative effects of flavonoids are reported.30
Flavonoids are also known to have enzyme inhibiting activity. At first, it can be assumed that either a complexation of the metal ion in the enzyme (if present) or an interaction with amino acids from the active side are responsible for this activity. Concerning the enzyme group of matrix metalloproteinases (MMPs) for instance, the inhibition is based on a
Figure 10: Quercetin-cobalt-complex28
Figure 11: Influence of substitution pattern37
hydrogenbridge bond and hydrophobic interactions in the zinc binding catalytic domain.31 The chelation of the zinc ion can be discarded in this case, due to the distance from the ion to the flavonoid of more than 5 Å.31 Hydrogen bonds can also occur between the amino acids and the hydroxyl groups, preferentially at a catechol moiety of the flavonoid.31 Hydrophobic interactions can be formed, among others, between the amino acid leucin and the chromon scaffold.31 These non-competitive inhibition of MMPs contributes to anti- metastatic and anti-arteriosclerotic effects, which are reported for some flavonoids.32 Similar results have been published for the inhibition of the angiotensin-converting enzyme, which is one of the top-selling branches in the pharmaceutical industry. This enzyme is responsible for the maintenance of normal blood pressure via the conversion of Angiotensin I into Angiotensin II.33 Angiotensin II acts vaso- contrictive and can thus cause hypertension and cardiovascular disease (CVD).34 Concering the flavonoids, the presence or absence of some structural elements changes the ACE- inhibitory (ACEI) activity (Figure 11).34 In a study from Guerrero et al. (2012), Luteolin (17 flavonoids were tested) showed the highest effect with an IC50 value of 23 µM. The essential structure elements are a double bond between C2 and C3, a carbonyl group in the C-ring, a free hydroxyl function at C3 and a catechol moiety at the B-ring. The latter is with distances of 2.1 Å (oxygen at C3’) and 4.3 Å (oxygen at C4’) to the zinc ion of the enzym within the range for chelation, but again, hydrophobic interactions and hydrogen bonds play a crucial role.34 Consequently, even if the ACEI activity of the flavonoids cannot measure up with those of the commercially available drugs, the common, regular dietary intake of flavonoids in a higher dose could prevent or reduce hypertension.34
~ 19 ~
1.5 Flavonoids containing Plants in Traditional Medicine
Among the flavonoid subclasses, the flavonols are the most widespread.2 Kaempferol is beside quercetin the most important member of this group and can be found in some foods like i.e. endive, leek, broccoli, radish, grapefruit and black tea in higher concentrations.35,36 Further on, significant yields of kaempferol and its conjugates can be found in several traditionally used medicinal plants:
Camptosorus sibiricus (Aspleniaceae), North China, treatment of vascular inflammation, diabetic complication and traumatism37
Stenochlaena palustris (Blechnaceae), Papua New Guinea, used as a contraceptive38
Cinnamomum osmophloeum (Lauraceae), Taiwan, treatment of inflammation, intestinal infections, astringent, diuretic and diabetic complications39
Epimedium sagittatum (Berberidaceae), People's Republic of China, coronary heart disease, chronic bronchitis, frequency/urgency of urination, aphrodisiac40
Ilex paraguariensis, mate tea (Aquifoliaceae), South America, choleretic, hypocholesteremic, anti-oxidant, hepatoprotective effects41
Momordica foetida, (Cucurbitaceae), East Africa, antimalarial activity42
Ginkgo biloba, (Ginkgoaceae), People's Republic of China, treatment of heart and lung dysfunctions, skin infections43
Of course it has to be remarked, that this is only a short list of examples among several other plants and furthermore the healing properties may not be only the result of the kaempferol content. In general, it is improbable that the use in traditional medicine is attributed to one compound. But some studies have shown, that kaempferol has various pharmacological activities: anti-oxidant, anti-inflammatory, anti-microbial, anti-cancer, cardioprotective, neuroprotective, anti-diabetic, anti-osteoporotic, estrogenic/anti-estrogenic, anxiolytic, analgesic and anti-allergic.44
Some more detailed information on kaempferol glycosides in Ginkgo folium, synthetic strategies, in vivo metabolism and pharmacology can be found at the beginning of each specific topic.
1.6 Objectives
Kaempferol is beside quercetin one of the most common flavonols in vegetables and herbal medicines. Wherein the in vivo metabolism of quercetin is widely understood, the exact structures of in vivo kaempferol conjugates and their plasma concentration are unknown or not absolutely evidenced.
The first aim of this thesis was to isolate kaempferol glycosides from two fractions of a Ginkgo folium extract, provided from Dr. Willmar Schwabe GmbH und Co. KG. A standard chromatographic scheme should be developed, which allows the facile isolation of compounds in sufficient amounts for in vivo pharmacokinetic investigations in rats with a certain dosage.
Five expected metabolites of kaempferol should be chemically synthesized, in order to have reference substances for the analysis of the plasma samples. Therefore, synthetic pathways starting from the aglycone should be developed to yield in the formation of four kaempferol glucuronides and one kaempferol sulfate, wherein the latter is already described in literature.
In the next step, the metabolites of kaempferol in rat plasma should be identified and quantified by HPLC-UV. Therefore some preparatory work has to be accomplished, which includes the development of a combined workup method for the plasma samples and a suitable chromatographic separation with regard to the recovery and the limit of quantification.
Finally, some pharmacological data of kaempferol and its conjugates should be examined, with the focus on potential anti-oxidative, anti-proliferative and anti-inflammatory effects.
~ 21 ~
Figure 12: Gingko leaf102
2 Isolation and Quantification of Kaempferol Glycosides
2.1 IntroductionGinkgo biloba LINNÉ (Ginkgoaceae) is described by Charles Darwin as ´living fossil´ due to little or no morphological changes in the past 100 million years.45 It belongs to the group of gymnosperms, is a dioecious plant and the only member of the Ginkgoaceae family. The tree has a grey bark, reaches a height of 30-40 m and has a diameter of 3-4 m. The plant is probably native in China and Japan and was cultivated in temples. Since the 18th century it can be found in european parks. Ginkgo folium consists of the green to yellowish whole leaves (4-10 cm). The leaf is characteristic and bilobate, fan-like and the venation is dichotomously and almost parallel (Figure 12).46,47,48
At least eight kaempferol glycosides are known from literature to occur in Gingko folium. In Figure 13 the structures are presented. For the preparation of the extract, one can find different monographs, all using the powdered drug, which is processed as described briefly in the following :
U.S. Pharmacopoeia: methanol, c(suspension) = 0.1 g/mL, reflux, 10 min
Chinese Pharmacopoeia: for flavonoids: methanol, c(suspension) = 0.1 g/mL, reflux, 10 min
for terpene lactones: 50% acetone, c(suspension) = 0.025 g/mL, reflux, 3 h
Hong Kong Chinese Materia Medica Standards: methanol, c(suspension) = 0.1 g/mL, sonification, 30 min
European Pharmacopoeia: methanol, c(suspension) = 0.2 g/mL, 65 °C, 10 min
EGb 761® complies the monograph in the European Pharmacopoeia “Ginkgo dry extract, refined and quantified”: 60% acetone
The indications listet in the chinese pharmacopoeia are: obstruction of collaterals by blood stasis, chest impediment and heart pain, hemiplegia caused by windstroke, cough and panting caused by lung deficiency and hyperlipidemia.
Figure 13: Kaempferol glycosides in Ginkgo folium 3-O-(-D-Glucosyl)kaempferol103,104
3-O-(α-L-Rhamnosyl)kaempferol52
3-O-(6-O-(α-L-Rhamnosyl)--D- glucosyl)kaempferol103,104
3-O-(2-O-(-D-Glucosyl)- α-L-hamnosyl)kaempferol105,103
3-O-(2-O, 6-O-Bis(α-L-rhamnosyl)-
-D-glucosyl)kaempferol106,107
3-O-(2-O-(6-O-(p-Hydroxy-trans-cinnamoyl)--D- glucosyl)-α-L-rhamnosyl)kaempferol103,104,108
3-O-(2-O, 6-O-(p-(-D-Glucosyl)-oxy-trans-cinnamoyl)-
-D-glucosyl)-α-L-rhamnosyl)kaempferol105
3-O-(2-O, 6-O-(p-Hydroxy-trans-cinnamoyl)--D-glucosyl)-α-L-rhamnosyl)- 7-O-(-D-glucosyl)kaempferol104
~ 23 ~
For the isolation of kaempferol glycosides, two flavonol glycosides enriched fractions of EGb 761® were provided from the Dr. Willmar Schwabe GmbH and Co. KG. In the following, a combination of chromatographic methods was developed, which allows the isolation of some kaempferol derivatives for extract quantification and in vivo investigation.
The standardized extract EGb 761® consists of about 22-27% flavonoid glycosides and 5-7%
terpene lactones.49 The extract is the active ingredient in Tebonin® caplets and the scope of application covers disturbances of memory, concentration disorders, depressive state, dizziness, tinnitus and headaches.49 The corresponding aglycones of the flavonoids are mainly quercetin, kaempferol and isorhamnetin. The maximum daily recommended oral dosage for the extract in Tebonin® is 240 mg which is equivalent to about 3.2 mg/kg.
In the present study, it has to be considered, that an administration of 3.2 mg/kg is not sufficient for an in vivo investigation in rats due to the different metabolic situation and the expected plasma levels of the metabolites would be with certainity under the limit of quantification (LOQ) using HPLC with UV detection, even if just a pure compound is administered and not the whole extract.
In a comparable study, rats were treated with a dosage of 600 mg/kg of the extract, which yields to a maximum kaempferol concentration (aglycone) of 341 ng/mL after 8 hours.50 In the present study, not the extract should be used for administration, but different kaempferol glycosides in their pure form and depending on their content in EGb 761®.
Consequently, the standardized extract has to be quantified concerning the isolated kaempferol glycosides.
The pure compounds are further on used in the next step as reference substances for the quantification of the standardized extract.
2.2 Material and Methods 2.2.1 Consumable Material 2.2.1.1 Solvents
Acetone, EMSURE®, for analysis, Merck KGaA, 64271 Darmstadt, Germany
Ethyl acetate, for analysis, 99.99%, Acros, New Jersey, USA
H2O, deionised, further purified by membraPure, Astacus, MembraPure GmbH, Berlin, Germany
2-Propanol, EMSURE®, for analysis, 99.8%, Merck KGaA, 64271 Darmstadt, Germany
2-Propanol, ROTISOLV® HPLC, ≥ 99.9%, Carl Roth GmbH & Co. KG, 76185 Karlsruhe, Germany
DMSO, SeccoSolv®, ≥99.9%, Merck KGaA, 64271 Darmstadt, Germany
Methanol, EMSURE®, for analysis, 99.9%, Merck KGaA, 64271 Darmstadt, Germany
2.2.1.2 Naturstoffreagenz A
2-Aminoethyldiphenylborinate, 2 g dissolved in 200 mL MeOH, Fluka®, Sigma- Aldrich Chemie GmbH, 89555 Steinheim, Germany
Polyethylene glycol 400, 10 g dissolved in 200 mL MeOH, Merck Schuchardt OHG, 85662 Hohenbrunn, Germany
2.2.1.3 TLC
TLC Silica gel 60 F254, Merck KGaA, 64271 Darmstadt, Germany
TLC chambers, Camag, Muttenz, Switzerland 2.2.1.4 NMR
Bruker Avance 300, Bruker Corporation, Billerica, USA
Methanol-d4, 99.8%, Deutero GmbH, 56288 Kastellaun, Germany
NMR tubes, 507-HP, 203 mm, Norell, Landisville, USA 2.2.2 Columns and Stationary Phases for Isolation
Flash-NP: SuperVarioPrep® D40, 46 x 186 mm, filled with stationary phase Geduran® Si 60 63-200 µm, 90 g, Merck KGaA, 64271 Darmstadt, Germany
Flash-RP: SuperVarioPrep® D40, 46 x 186 mm, filled with stationary phase RP18 25-40 µm, 90 g, Merck KGaA, 64271 Darmstadt, Germany
Semipreparative HPLC: Knauer, Vertex, 16 x 250 mm, filled with stationary phase Eurospher-100 C18-7 µm, 14163 Berlin, Germany
~ 25 ~
2.2.3 Extract and Fractions
The extract of Ginkgo folium and flavonoid enriched fractions were obtained from Dr.
Willmar Schwabe GmbH & Co. KG.
Flavonol diglycosides enriched extract: PSC0148/B/Wo06-149-02, 35 g
Flavonol triglycosides enriched extract: PSC0148/B/Wo06-148-16, 100 g
Standardised Ginkgo folium extract: PSC0148/Ginkgo-Extrakt/ Ch.454 2.2.4 Instruments
Flash: Spot Flash Liquid Chromatography, SPOT-System Ser.-No. 08-01-108, single-beam spectrophotometer, Interchim, 03103 Montlucon, France
Semipreparative HPLC: Varian ProStar, Model 210, diode array detector, Agilent Technologies Deutschland GmbH, 71034 Böblingen, Germany
Analytical HPLC:
Column: Hibar® 250-4, Purospher® STAR, RP18e (5 µm), Column No.:
027444, Merck KGaA, Darmstadt, Germany
Precolumn: LiChroCART® 4-4, Purospher® STAR, RP18e (5 µm), Merck KGaA, Darmstadt, Germany
Pump: Hitachi L-2130, VWR, Darmstadt, Germany
Autosampler: Hitachi L-2200, VWR, Darmstadt, Germany
Column Oven: Hitachi L-2350, VWR, Darmstadt, Germany
Diode Array Detector: Hitachi L-2455, VWR, Darmstadt, Germany
Software, EZChrom Elite, Version 3.1.7, VWR, Darmstadt, Germany
Mass spectrometer:
TermoQuest Finnigan TSQ 7000, Thermo Fisher Scientific, Waltham, USA
Electrospray ionization (ESI)
2.2.5 Isolation of Flavonol Diglycosides 2.2.5.1 First Chromatographic Separation Instrument: Flash chromatography
Column: Merck, SuperVarioPrep® D40, 46 x 186 mm, for 90 g Silica Si 60 Stationary Phase: Merck, Geduran® Si 60 63-200 µm, 40 x 140 mm
Mobile Phase: A: EtOAc, B: acetone, C: H2O
The solvents where exhaustively mixed in a separatory funnel; after phase separation, the upper phase was used for CC
Application 3.0 g diglycoside extract + 4.5 g silica gel Fractionation: 52 min
Gradient: 0-25 min: EtOAc: acetone: H2O ~ 6:2:0,7 25-40 min: EtOAc: acetone: H2O ~ 5:3:1 40-52 min: 100% MeOH
Flow: 50 mL/min
88 fractions each 30 mL
2.2.5.2 Second Chromatographic Separation Instrument: Semipreparative HPLC Column: Knauer, Vertex, 16 x 250 mm Stationary Phase: Eurospher-100 C18-7 µm Mobile Phase: A: H2O, B: 2-propanol
Application: 300 µL (H2O: 2-propanol 70:30), ~ 33 mg of F3 Fractionation: 31 min
Gradient: 0 min: 15% 2-propanol 25 min: 30% 2-propanol 25-27 min: 30% 2-propanol 29 min: 15% 2-propanol 29-31: 15% 2-propanol
Flow: 5 mL/min
~ 27 ~
2.2.6 Isolation of Flavonol Triglycosides 2.2.6.1 First Chromatographic Separation Instrument: Flash chromatography
Column: Merck, SuperVarioPrep® D40, 46 x 186 mm, für 90 g Silica Si 60 Stationary Phase: Merck, Geduran® Si 60 63-200 µm, 40 x 140 mm
Mobile Phase: A: EtOAc, B: acetone, C: H2O
The listed solvents where exhaustively mixed in a separatory funnel, after phase separation, the upper phase was used for CC
Application: 5.0 g triglycoside extract + 7.5 g silica gel Fractionation: 55 min
Gradient: 0-10 min: EtOAc: acetone: H2O ~ 5:3:1 10-40 min: EtOAc: acetone: H2O ~ 5:4.5:2 40-52 min: 100% MeOH
Flow: 30 mL/min
55 fractions each 30 mL
2.2.6.2 Second Chromatographic Separation Instrument: Flash chromatography
Column: Merck, SuperVarioPrep® D40, 46 x 186 mm, 90 g Stationary Phase: Merck, RP18 25-40 µm, 90 g, 40 x 115 mm Mobile Phase: A: H2O, B: 2-propanol
Application: 1.7 g F2 + 2.5 g RP18 Fractionation: 33 min
Gradient: 0 min: 15% : 2-propanol 22 min: 28%: 2-propanol 22-33 min: 2-propanol
Flow: 30 mL/min
33 fractions each 30 mL
2.2.6.3 Third Chromatographic Separation Instrument: Semipreparative HPLC Column: Knauer, Vertex, 16 x 250 mm Stationary Phase: Eurospher-100 C18-7 µm Mobile Phase: A: H2O, B: 2-propanol
Application: 100 µL (H2O: 2-propanol 95:5), ~ 36 mg of F2 Fractionation: 33 min
Gradient: 0 min: 10% 2-propanol 24 min: 20% 2-propanol 24-27 min: 20% 2-propanol 30 min: 10% 2-propanol 30-33: 10% 2-propanol
Flow: 7.5 mL/min
2.2.7 Quantification of four Kaempferol Glycosides in EGb 761®
2.2.7.1 Principles
Two times, 5.0 mg of each reference substance were dissolved in DMSO ≙ two 1st stock solution for each compound
60 µL of the 1st stock solution were diluted with 1940 µL of 7% aqueous 2-propanol ≙ 2nd stock solution
Depending on the desired concentration, 75-260 µL of the 2nd stock solution were brought to the volume of 1 mL with 7% aqueous 2-propanol
One calibration curve based on six points
Only three points of each calibration curve are based on a single 1st stock solution
Three calibration curves for each reference substance
These three calibration curves were arithmetically averaged
The single calibrations curves are interday
Interday precision und intraday precision based on a single 1st stock solution
Three times, 5.0 mg of the standardized extract were dissolved in 3320 µL of 7%
aqueous 2-propanol and 7.5 µL DMSO
~ 29 ~
2.2.7.2 Analytical HPLC for Extract Quantification Instrument: Analytical HPLC
Oven: 30 °C
Thermo Unit: 4 °C
Column: Precolumn: LiChroCART® 4-4, Purospher® STAR RP-18e (5 µm) Main column: Hibar® 125-4, Purospher® STAR RP-18e (3 µm) Mobile Phase: A: H2O + 0.1% TFA, B: 2-propanol
Injection Volume: 20 µL
Gradient/Flow: 0 min: 7% 2-propanol 0.7 mL/min 60 min: 20% 2-propanol 0.7 mL/min 70 min: 30% 2-propanol 0.6 mL/min 77 min: 30% 2-propanol 0.6 mL/min
80: 7% 2-propanol 0.6 mL/min
90: 7% 2-propanol 0.7 mL/min
2.3 Results and Discussion
The aim of the isolation was to get kaempferol glycosides for the in vivo investigations and as references for extract quantification. A combination of chromatographic methods was developed to isolate these compounds from two flavonol-enriched subfractions of the extract EGb 761®. For the isolation of kaempferol diglycosides, two chromatographic steps were needed, whereas 3-O-(2-O, 6-O-bis(α-L-rhamnosyl)--D-glucosyl)kaempferol was isolated within three steps. The final purification was successful by use of a H2O/2-propanol gradient. The crucial separation of the kaempferol- from the isorhamnetin derivatives could not be achieved with H2O/MeOH or H2O/acetonitrile mixtures. The final assignment of the flavonol glycosides to the corresponding region on the TLC is depicted in Figure 14.
At the beginning, the enriched extract was analyzed by TLC. It could be seen, that the addition of formic or acetic acid leads to a good separation on normal phase. Nevertheless, it was tried to avoid acid in the mobile phase, because hydrolysation can occur during the use of the rotation evaporator.
Figure 14: NP-TLC of flavonol glycoside enriched extracts. Application: diglycoside-enriched extract; triglycoside-enriched extract. Mobile phase: EtOAc:acetone:H2O ∼ 5:3:1, 6 runs. Detection at 254 and 366 nm (bands 1-4); 366 nm after derivatisation with Naturstoffreagenz A (band 5 and 6)
~ 31 ~
A mixture of EtOAc, acetone and H2O showed a good separation on TLC. It was necessary to develop the TLC plate about six times, but this procedure results in a good separation of the compounds, which is exemplarily shown for the triglycoside enriched fraction in
Figure 15.
Consequently, different mixtures of these three solvents with varying elution strength were prepared for the first normal phase column chromatography.
Isolation of Kaempferol Diglycosides
The first separation with flash column chromatography visualized on TLC showed, after derivatisation with Naturstoffreagenz A, four fluorescent areas (366 nm) at an Rf value between 0.34 and 0.56 (Figure 16). The upper three have a greenish yellow fluorescens, which indicates one free hydroxyl group at the B-ring of the flavonoid and can thus be assigned, with regard to the metabolite spectrum of Ginkgo folium, possibly to kaempferol- and/or isorhamnetin derivatives.51 The lower, more orange spot can be associated to a flavonoid with two free hydroxyl functions at the B-ring.51
Figure 15: Six times development on NP-TLC of the triglycoside-enriched extract compared to isolated substances. Application (bands 1—4): 3-O-(2-O, 6-O-bis(α-L- rhamnosyl)--D-glucosyl)quercetin; triglycoside enriched fraction; 3-O-(2-O, 6-O- bis(α-L-rhamnosyl)--D-glucosyl)isorhamnetin; 3-O-(2-O, 6-O-bis(α-L-rhamnosyl)-- D-glucosyl)kaempferol. Mobile phase: EtOAc:acetone:H2O ∼ 5:3:1
3 i8 13 18 23 28 33 38 43 48 53 58 63 68 73 78 83 88
Kaempferol rutinoside Isorhamnetin rutinoside Kaempferol biloside Quercetin rutinoside
Figure 16: NP-TLC after CC of the diglycoside enriched fraction. Mobile phase: EtOAc:acetone:H2O ∼ 5:3:1; 6 developments; detection at 366 nm after derivatisation with Natursoffreagenz A. CC according to 2.2.5.1
Overall, the separation is not perfect, due to the overlap of the four spots from test tube 28-73. Nevertheless, it can be noted that a combination of the test tubes 18-38 would give a fraction of mainly the desired compounds (greenish yellow fluorescens) and avoids the major part of the quercetin glycoside. Further on, some more lipophilic ingredients could be separated from the kaempferol diglycosides, which allowed the subsequent use of reversed phase HPLC.
With the application of a H2O/2-propanol gradient, a sufficient separation of the remaining flavonoid glycosides could be achieved (Figure 17). Beside the already expected flavonols, a myricetin glycoside could be isolated. Overall, five flavonol diglycosides were isolated, wherein two are kaempferol derivatives.
tR = 17.83 Myricetin rutinoside
tR = 20.19 Quercetin rutinoside
tR = 23.19 Isorhamnetin
rutinoside tR = 25.33 Kaempferol
rutinoside
tR = 27.60 Kaempferol
biloside
Figure 17: Semipreparative HPLC chromatogram of the diglycosides at 349 nm. CC according to 2.2.5.2
~ 33 ~
Isolation of Kaempferol Triglycosides
The flavonol triglycoside enriched fraction was first subjected to normal phase flash column chromatography, wherein some traces of remaining diglycosides with a medium Rf-value could be removed. In contrast, the separation form the orange fluorescent quercetin glycoside is unsatisfactory (Figure 18).
An additional reversed phase flash column chromatography was accomplished with an H2O/2-propanol gradient. This step could remove the major part of quercetin triglycosides (fraction 8) from kaempferol- and isorhamnetin triglycosides (Figure 19).
The final purification step was again achieved by semipreparative HPLC (H2O/2-propanol gradient), which yielded in the isolation of the three flavonol glycosides (Figure 20).
tR = 22.77 Quercetin triglycoside
tR = 26.21 Kaempferol triglycoside tR = 25.08
Isorhamnetin triglycoside
Figure 20: Semipreparative HPLC chromatogram of the triglycosides at 349 nm. CC according to 2.2.6.3
i4 7 10 13 16 19 i22 25 28 31 i34 37 40 43 46 49 52 55
Kaempferol triglycoside Isorhamnetin triglycoside Quercetin triglycoside Diglycoside containing fractions
Figure 18: NP-TLC after CC of the triglycoside enriched fraction. Mobile phase: EtOAc:acetone:H2O ∼ 5:3:1; 6 developments; detection at 366 nm after derivatisation with Natursoffreagenz A. CC according to 2.2.6.1
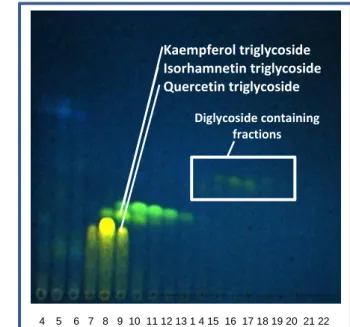
4 i5 6 7 8 9 10 11 12 13 1 4 15 16 17 18 19 20 21 22
Kaempferol triglycoside Isorhamnetin triglycoside Quercetin triglycoside
Diglycoside containing fractions
Figure 19: NP-TLC after CC of the triglycoside enriched fraction. Mobile phase: EtOAc:acetone:H2O ∼ 5:3:1; 6 developments; detection at 366 nm after derivatisation with Natursoffreagenz A. CC according to 2.2.6.2
Overall, both isolation sequences results in chromatograms which do not show baseline separation of the compounds. Nevertheless, the methods are a relatively affordable and fast way to get the flavonoids in sufficient amounts for the following projects. In addition, the intermediate fractions which comprises two or more glycosides can be combined and added to the extract. Thereby, unnecessary loss of substance is avoided.
Finally the following eight flavonoid glycosides were isolated.
Isolated diglycosides:
3-O-(2-O-(-D-Glucosyl-α-L-rhamnosyl)kaempferol (calculated yield for 3 g enriched extract: 170 mg, 5.7%)
3-O-(6-O-(α-L-Rhamnosyl)--D-glucosyl)kaempferol (calculated yield for 3 g enriched extract: 230 mg, 7.7%)
3-O-(6-O-(α-L-Rhamnosyl)--D-glucosyl)isorhamnetin
3-O-(6-O-(α-L-Rhamnosyl)--D-glucosyl)quercetin
3-O-(6-O-(α-L-rhamnosyl)--D-glucosyl)myricetin
Isolated triglycosides:
3-O-(2-O, 6-O-Bis(α-L-rhamnosyl)--D-glucosyl)kaempferol (calculated yield for 5 g enriched extract: 65 mg, 1.3%)
3-O-(2-O, 6-O-Bis(α-L-rhamnosyl)--D-glucosyl)isorhamnetin
3-O-(2-O, 6-O-Bis(α-L-rhamnosyl)--D-glucosyl)quercetin
The yields for the myricetin-, quercetin- and isorhamnetin glycosides are not presented, because the chromatographic separation was not focused on their isolation and thus, the calculated contents would not be informative.
The identification of the kaempferol glycosides was achieved by comparison with 1H NMR literature values52 (Table 1-Table 8) and the further down presented analysis by HPLC-MS (Figure 21) .
~ 35 ~
Position 1H 1HLIT
6 6.21 (1H, d, 2.0) 6.20 (1H, d, 2.0) 8 6.39 (1H, d, 2.0) 6.39 (1H, d, 2.0)
2´,6´ 7.28 (2H, s) 7.29 (2H, s)
1´´ 5.08 (1H, d, 7.7) 5.08 (1H, d, 7.6) 6´´A 3.80 (1H, d, 10.5) 3.80 (1H, d, 10.7) 1´´´ 4.52 (1H, d, 1.3) 4.52 (1H, d, 1.2) 2´´´ 3.62 (1H, dd, 1.5, 3.3) 3.62 (1H, dd, 1.2, 3.5) 3´´´ 3.55 (1H, dd, 3.3, 9.3) 3.55 (1H, dd, 3.5, 9.4) 6´´´ 1.12 (3H, d, 6.2) 1.12 (3H, d, 6.2) Remaining
sugar protons
3.51-3.23 (7H, m) 3.50-3.25 (7H, m) Table 1: 1H NMR spectral data of 3-O-(6-O-(α-L-rhamnosyl)--D- glucosyl)myricetin (300 MHz, 294 K, J in Hz, in CD3OD) compared to literature values52
Position 1H 1HLIT
6 6.21 (1H, d, 2.1) 6.19 (1H, d, 2.1) 8 6.40 (1H, d, 2.1) 6.37 (1H, d, 2.1) 2´ 7.66 (1H, d, 2.1) 7.67 (1H, d, 2.2) 5´ 6.87 (1H, d, 8.4) 6.87 (1H, d, 8.4) 6´ 7.63 (1H, dd, 2.2, 8.4) 7.63 (1H, dd, 2.2, 8.4) 1´´ 5.10 (1H, d, 7.5) 5.09 (1H, d, 7.2) 6´´A 3.80 (1H, d, 10.9) 3.81 (1H, d, 10.0)
1´´´ 4.51 (1H, s) 4.53 (1H, br s)
2´´´ 3.62 (1H, dd, 1.4, 3.4) 3.65 (1H, m) 3´´´ 3.53 (1H, dd, 3.6, 9.4) 3.55 (1H, dd, 3.1, 9.4) 6´´´ 1.12 (3H, d, 6.2) 1.13 (3H, d, 6.1) Remaining
sugar protons
3.50-3.33 (7H, m) 3.82-3.25 (7H, m) Table 2: 1H NMR spectral data of 3-O-(6-O-(α-L-rhamnosyl)--D- glucosyl)quercetin (300 MHz, 295 K, J in Hz, in CD3OD) compared to literature values52
Position 1H 1HLIT 6 6.21 (1H, d, 2.1) 6.19 (1H, d, 1.9) 8 6.40 (1H, d, 2.1) 6.38 (1H, d, 1.9) 2´,6´ 8.06 (2H, d, 8.9) 8.06 (2H, d, 8.9) 3´,5´ 6.89 (2H, d, 8.9) 6.88 (2H, d, 8.9) 1´´ 5.13 (1H, d, 7.5) 5.12 (1H, d, 7.6) 6´´A 3.80 (1H, dd, 1.9, 7.6) 3.81 (1H, d, 10.6) 1´´´ 4.51 (1H, d, 1.4) 4.52 (1H, d, n.r.) 2´´´ 3.63 (1H, dd, 1.6, 3.3) 3.64 (1H, m) 3´´´ 3.52 (1H, dd, 3.4, 9.5) 3.53 (1H, dd, 3.3, 9.4) 6´´´ 1.12 (3H, d, 6.2) 1.13 (3H, d, 6.2) Remaining
sugar protons
3.48-3.23 (7H, m) 3.48-3.25 (7H, m) Table 4: 1H NMR spectral data of 3-O-(6-O-(α-L-rhamnosyl)--D- glucosyl) kaempferol (300 MHz, 294 K, J in Hz, in CD3OD) compared to literature values;52 n.r.: not reported
Position 1H 1HLIT
6 6.20 (1H, d, 2.1) 6.19 (1H, d, 2.1) 8 6.40 (1H, d, 2.1) 6.37 (1H, d, 2.1) 2´ 7.94 (1H, d, 2.0) 7.94 (1H, d, 2.1)
3´-O-CH3 3.94 (3H, s) 3.95 (3H,s)
5´ 6.91 (1H, d, 8.5) 6.91 (1H, d, 8.5) 6´ 7.62 (1H, dd, 2.1, 8.4) 7.59 (1H, dd, 2.1, 8.5) 1´´ 5.23 (1H, d, 7.4) 5.22 (1H, d, 7.6) 6´´A 3.81 (1H, d, 10.2) 3.81 (1H, d, 10.6) 1´´´ 4.52 (1H, d, 1.3) 4.54 (1H, d, n.r.) 2´´´ 3.61 (1H, dd, 1.6, 3.3) 3.63 (1H, d, 3.4) 6´´´ 1.09 (3H, d, 6.2) 1.11 (3H, d, 7.6) Remaining
sugar protons
3.51-3.20 (7H, m) 3.51-3.24 (7H, m) Table 3: 1H NMR spectral data of 3-O-(6-O-(α-L-rhamnosyl)--D- glucosyl)isorhamnetin (300 MHz, 297 K, J in Hz, in CD3OD) compared to literature values52
~ 37 ~
Position 1H 1HLIT
6 6.20 (1H, d, 1.9) 6.20 (1H, d, 1.9) 8 6.37 (1H, d, 2.1) 6.37 (1H, d, 1.9) 2´,6´ 7.77 (2H, d, 8.8) 7.76 (2H, d, 8.9) 3´,5´ 6.94 (2H, d, 8.8) 6.94 (2H, d, 8.9) 1´´ 5.72 (1H, d, 1.4) 5.73 (1H, d, 1.1) 2´´ 4.28 (1H, dd, 1.5, 3.5) 4.29 (1H, dd, 1.3, 3.5) 3´´ 3.80 (1H, dd, 3.5, 9.4) 3.81 (1H, dd, 3.5, 9.3) 6´´ 0.93 (3H, d, 5.9) 0.94 (3H, d, 5.9) 1´´´ 4.41 (1H, d, 7.7) 4.42 (1H, d, 7.7) 6´´´ 3.73-3.65 (2H, m) 3.70 (2H,m) Remaining
sugar protons
3.44-3.17 (6H, m) 3.43-3.19 (6H, m) Table 5: 1H NMR spectral data of 3-O-(2-O-(-D-glucosyl-α-L- rhamnosyl)kaempferol (300 MHz, 297 K, J in Hz, in CD3OD) compared to literature values52
Position 1H 1HLIT
6 6.18 (1H, d, br s) 6.18 (1H, d, 2.0) 8 6.36 (1H, br s) 6.37 (1H, d, 2.0) 2´ 7.59 (1H, br s) 7.59 (1H, br s) 5´ 6.87 (1H, d, 8.4) 6.87 (1H, d, 8.8) 6´ 7.62 (1H, d, 1.9) 7.61 (1H, dd, 2.1, n.r) 1´´ 5.59 (1H, d, 7.6) 5.59 (1H, d, 7.6) 1´´´ 5.22 (1H, br s) 5.22 (1H, d, 1.3) 2´´´ 4.00 (1H, dd, 1.7, 2.8) 4.01 (1H, dd, 1.5, 3.3) 5´´´ 4.08 (1H, dd, 6.2, 9.6) 4.09 (1H, dd, 6.2, 9.6) 6´´´ 1.00 (3H, d, 6.2) 1.00 (3H, d, 6.2) 1´´´´ 4.50 (1H, br s) 4.51 (1H, d,1.5) 6´´´´ 1.07 (3H, d, 6.2) 1.09 (3H, d, 6.2) Remaining
sugar protons
3.90-3.18 (12H, m) 4.07-3.21 (12H, m) Table 6: 1H NMR spectral data of 3-O-(2-O, 6-O-bis(α-L-
rhamnosyl)--D-glucosyl)quercetin (300 MHz, 297 K, J in Hz, in CD3OD) compared to literature values;52 n.r.: not reported
Position 1H 1HLIT
6 6.18 (1H, d, 2.1) 6.18 (1H, d, 2.0) 8 6.38 (1H, d, 2.1) 6.39 (1H, d, 2.0) 2´ 7.94 (1H, d,2.0) 7.94 (1H, d,1.9)
3´-O-CH3 3.97 (3H,s) 3.97 (3H,s)
5´ 6.91 (1H, d, 8.5) 6.92 (1H, d, 8.5) 6´ 7.57 (1H, dd, 2.0, 8.5) 7.57 (1H, dd,1.9, 8.5) 1´´ 5.73 (1H, d, 7.4) 5.74 (1H, d, 7.3) 6´´A 3.81 (1H, d, 10.3) 3.81 (1H, d, 10.3) 1´´´ 5.19 (1H, d, 1.2) 5.19 (1H, d, n.r.) 2´´´ 4.00 (1H, dd, 1.6, 3.4) 4.00 (1H, dd, n.r) 3´´´ 3.77 (1H, dd, 3.3, 9.5) 3.73 (1H, dd, 3.4, 9.6) 5´´´ 4.06 (1H, dd, 6.3, 9.7) 4.04 (1H, dd, 6.3, 9.7) 6´´´ 0.91 (3H, d, 6.2) 0.92 (3H, d, 6.2) 1´´´´ 4.53 (1H, d, 1.4) 4.54 (1H, d, n.r.) 6´´´ 1.06 (3H, d, 6.2) 1.07 (3H, d, 6.2) Remaining
sugar protons
3.89-3.17 (10H, m) 4.07-3.19 (10H, m) Table 7: 1H NMR spectral data of 3-O-(2-O, 6-O-bis(α-L-rhamnosyl)-- D-glucosyl)isorhamnetin (300 MHz, 297 K, J in Hz, in CD3OD) compared to literature values;52 n.r.: not reported
Position 1H 1HLIT
6 6.18 (1H, d, 2.1) 6.20 (1H, d, 2.0) 8 6.38 (1H, d, 2.1) 6.40 (1H, d, 1.9) 2´, 6´ 8.01 (2H, d, 8.9) 8.05 (2H, d, 8.9) 3´, 5´ 6.89 (2H, d, 8.9) 6.92 (2H, d, 8.9) 1´´ 5.60 (1H, d, 7.3) 5.63 (1H, d, 7.2) 1´´´ 5.22 (1H, d, 1.2.) 5.25 (1H, d, n.r.) 2´´´ 4.00 (1H, dd, 1.6, 3.3j) 4.02 (1H, m) 5´´´ 4.06 (1H, dd, 6.2, 9.6) 4.08 (1H, dd, 6.3, 9.6) 6´´´ 0.97 (3H, d, 6.2) 0.99 (3H, d, 6.2) 1´´´´ 4.49 (1H, d, 1.4) 4.52 (1H, d, n.r.) 6´´´´ 1.07 (3H, d, 6.2) 1.08 (3H, d, 6.2) Remaining
sugar protons
3.88-3.19 (12H, m) 3.85-3.22 (12H, m) Table 8: 1H NMR spectral data of 3-O-(2-O, 6-O-bis(α-L-rhamnosyl)-
-D-glucosyl)kaempferol (300 MHz, 297 K, J in Hz, in CD3OD) compared to literature values;52 n.r.: not reported
~ 39 ~
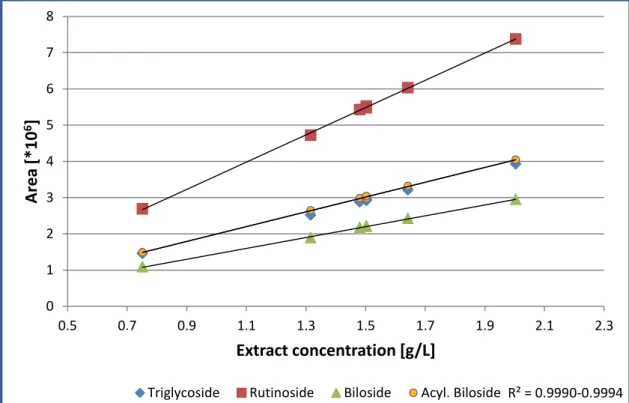
Extract Quantification
The isolated kaempferol glycosides and an additional acylated kaempferol glycoside, which was a kind gift from Dr. Willmar Schwabe GmbH und Co. KG., were used in the next step for their quantification in the standardized extract EGb 761®. The following list contains these four compounds and their used abbreviations:
3-O-(2-O, 6-O-Bis(α-L-rhamnosyl)--D-glucosyl)kaempferol (Triglycoside)
3-O-(6-O-(α-L-Rhamnosyl)--D-glucosyl)kaempferol (Rutinoside)
3-O-(2-O-(-D-Glucosyl-α-L-rhamnosyl)kaempferol (Biloside)
3-O-(2-O-(6-O-(p-Hydroxy-trans-cinnamoyl)--D-glucosyl)-α-L- rhamnosyl)kaempferol (Acylated Biloside)
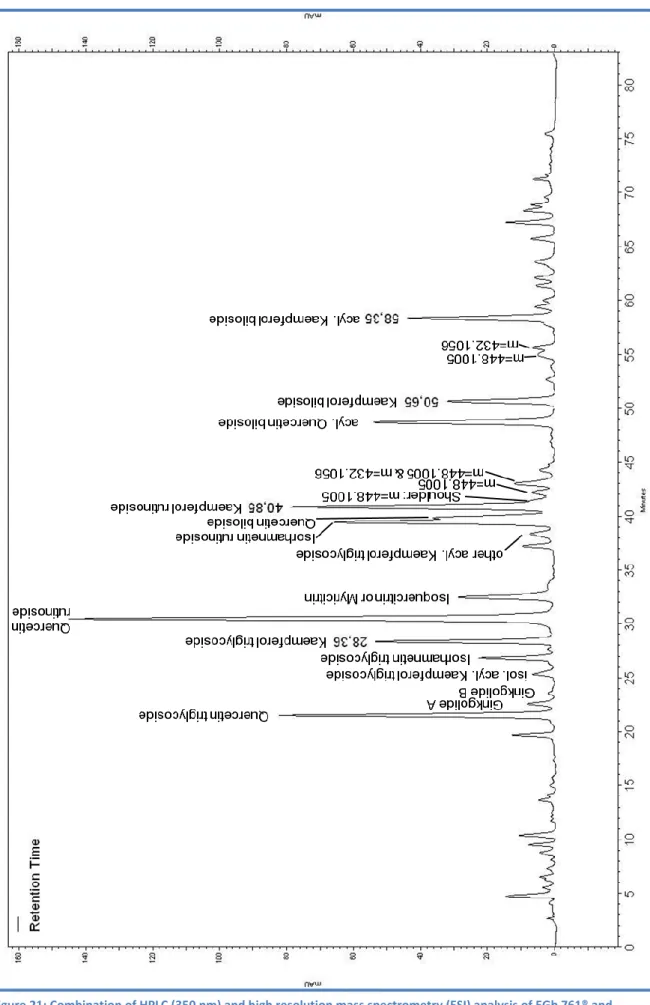
At first, the questions arises whether these four kaempferol glycosides are those with the highest content in EGb 761®. The extract was therefore analyzed by HPLC followed and high resolution mass spectrometry (Figure 21). The isolated kaempferol glycosides can clearly be assigned in the chromatogram of EGb 761® by comparison of the retention times and MS data with the pure reference compounds. Further on several other flavonoid glycosides and two ginkgolides can be assigned based on HR m/z values, which is consequently not an absolute evidence. The retention time of the two kaempferol monoglycosides cannot be associated to a certain peak in the chromatogram, because of similar molecular masses of the following substances:
Kaempferol-3-O--D-glucoside (448), luteolin-3´-O--D-glucoside, quercetin-3-O-α-L rhamnoside
Kaempferol-3-O- α-L-rhamnoside (432), apigenin-7-O--D-glucoside
All conceivable signals for the monoglycosides have multiple smaller integrals compared to the four isolated compounds. Consequently, these substances can be regarded as the predominat kaempferol glycosides in EGb 761®.
The chosen chromatographic method gives a good separation of the ingredients, which is sufficient for the quantification, although for instance the acylated biloside shows a little shoulder in the chromatogram (Figure 22)
Figure 21: Combination of HPLC (350 nm) and high resolution mass spectrometry (ESI) analysis of EGb 761® and tentative assignment of other compounds based on MS data. CC according to 2.2.7.2, but with formic acid instead of trifluoracetic acid
~ 41 ~
25.78
25.78 37.59
37.59
55.41
47.17 47.17
55.41 min
Triglycoside
Rutinoside Biloside Acylated Biloside
Figure 22: HPLC of EGb 761® at 350 nm. CC according to 2.2.7.2