Humboldt-Universität zu Berlin - Geographisches Institut
C HANGE D ETECTION FOR A PPLICATION IN U RBAN G EOGRAPHY BASED ON V ERY H IGH R ESOLUTION R EMOTE S ENSING
Dissertation
zur Erlangung des akademischen Grades doctor rerum naturalium (Dr. rer. nat.)
im Fach Geographie
eingereicht an der
Mathematisch-Naturwissenschaftlichen Fakultät der Humboldt-Universität zu Berlin
von
Tobias Leichtle (M.Sc.)
Präsidentin der Humboldt-Universität zu Berlin Prof. Dr.-Ing. Dr. Sabine Kunst
Dekan der Mathematisch-Naturwissenschaftlichen Fakultät Prof. Dr. Elmar Kulke
Gutachter/innen: 1. Prof. Dr. Tobia Lakes
2. Prof. Dr. Birgit Kleinschmit
3. Prof. Dr. Andreas Schmitt
Acknowledgements
At this point, I would like to express my sincere gratitude to everyone who was involved and contributed to this thesis.
First and foremost, I would like to thank my supervisors, Prof. Dr. Tobia Lakes and Dr. Hannes Taubenböck for their continuous and encouraging support as well as their very valuable scientific advice during all stages of this dissertation and for making this work possible.
My very special thanks go to the Company for Remote Sensing and Environmental Research (SLU) for funding large parts of this dissertation through different projects and its owner, Dr. Klaus Martin, for his continuous support as well as the possibility and the freedom of conducting research besides work.
Special thanks go to the German Remote Sensing Data Center of the German Aerospace Center, in particular to the department of Geo-Risks and Civil Security and its head Prof. Günter Strunz for the opportunity to create my thesis in an exciting scientific environment.
The basis for this thesis was established in the BMBF-funded research project DELIGHT (Delta Information System for geoenvironmental and human Habitat Transition, www.delight.eoc.dlr.de), which provided inspiration and ideas for conducting this work. In addition, very high resolution (VHR) remote sensing imagery and field data from DELIGHT was used in this thesis.
I also want to thank European Space Imaging (EUSI, www.euspaceimaging.com) for providing additional VHR images for my work.
Source of inspiration and motivation in everyday work as well as numerous opportunities for discussion came from all my colleagues of the team City and Society within the department of Geo-Risks and Civil Security, particular thanks go to Dr. Christian Geiß and Dr. Michael Wurm for valuable advice and critical discussions on my work and possible pathways towards a PhD.
I am particular grateful to my family for encouragement and uncontested support.
Finally, my deep gratitude goes to my wife Sahra Abdullahi for her endless patience, scientific advice, continuous support, and Nora.
Abstract
The continuous and ongoing transformation of the Earth’s surface can be observed especially in urban areas, which are hot spots of global change. In addition to the process of urbanization, the world population has increased exponentially since 1900, while future population growth is entirely projected to cities. Facing these trends, the envisaged goal is to promote efficient, resilient, and sustainable development of cities through politics and urban planning. In this regard, suitable highly detailed and up-to-date information is required, which can be delineated based on various earth observation sensors.
In this context, this thesis aims at the development of a change detection approach for monitoring urban environments based on optical remote sensing data with very high resolution (VHR) and consequent exemplary application of the assessment of the ghost city phenomenon in the context of urban geography. The unsupervised object-based change detection approach captures the construction of individual buildings and returned viable results in the order of 0.8 to 0.9 according to kappa statistics in the city of Dongying, China. The methodology utilizes object-based difference features based on existing building geometries and employs clustering as the comparison method for the delimitation of changed and unchanged buildings. Several different clustering algorithms were evaluated and their ability to separate possible arbitrary distribution of clusters in the feature space was documented. The proposed approach mitigates differences in the acquisition system and is capable of handling VHR data from different sensors, with deviating viewing geometries, in different acquisition modes, and/or in different seasons. This allows the utilization of all present and future available sources of VHR data for monitoring urban areas at medium and small spatial scale. The transferability of the approach is investigated with particular focus on the nature and effects of class distribution and potentially occurring class imbalance in this thesis. For this purpose, a diagnostic framework is developed and consequently applied in the city of Dongying, China and the city of Munich, Germany, which are characterized by different built-up structure as well as divergent temporal evolution. The results showed that situations of imbalanced class distribution generally provide less reliable identification of changes compared to balanced or close to balanced situations.
However, clustering techniques like the genetic k-means algorithm, which account for non-linearity and possess capabilities for the detection of clusters of arbitrary shape, provide more robust results compared to the traditional k-means algorithm. In addition, the diagnostic framework can be utilized for further development and
application of present and future methods for change detection and image classification in order to assess and improve robustness and transferability of the methodology. The assessment of the presence or absence of the ghost city phenomenon is conducted as an exemplary application of urban geography in the city of Dongying, China. The conceptual framework based on VHR imagery and census counts in this thesis replicates undercapacity with respect to the residential population as one of the key characteristics of a ghost city. A 4d functional city model is established and serves for estimation of available living space and population capacity of residential buildings. Subsequently, population capacity estimates are related to actual permanent residential population from census counts revealing a significant mismatch and thus, high likelihood for the emergence and presence of the ghost city phenomenon within the urban area of Dongying. In addition, the proposed approach allows identification of specific regions of the urban area that are most likely affected. In perspective, the 4d functional city model also enables other fields of application in the context of changing urban environments.
Accordingly, this thesis not only discusses the applicability of heterogeneous VHR data sets for unsupervised change detection in urban areas as well as the transferability of the methodology regarding the distribution of classes, but also contributes to a more detailed understanding of urban growth in highly dynamic Chinese cities based on the exemplary application of the ghost city phenomenon in the city of Dongying.
Zusammenfassung
Städte sind Brennpunkte des globalen Wandels. Seit etwa 1900 steigt die Weltbevölkerung exponentiell an, wobei das zukünftig prognostizierte Bevölkerungswachstum vollständig auf Städte entfallen wird. Vor den damit verbundenen Herausforderungen ist es das angestrebte Ziel, eine effiziente, widerstandsfähige und nachhaltige Stadtentwicklung durch Politik und Stadtplanung zu fördern. In diesem Zusammenhang sind hochdetaillierte und aktuelle Informationen über die Entwicklung von Städten zwingend erforderlich. Hierfür liefern moderne Erdbeobachtungssensoren eine ideale Datenbasis zum Monitoring von Städten.
Vor diesem Hintergrund wird im Rahmen der vorliegenden Arbeit ein Verfahren zur Änderungserkennung auf Basis höchstaufgelöster optischer Erdbeobachtungsdaten entwickelt und anschließend im stadtgeographischen Anwendungsfall zur Bewertung einer potenziell vorliegenden Geisterstadt in Wert gesetzt. Das unüberwachte objektbasierte Verfahren erfasst die Entstehung neuer Gebäude mit einer Genauigkeit von 0,8 bis 0,9 entsprechend der Kappa Statistik in einem Testgebiet in der chinesischen Stadt Dongying. Dabei werden objektbasierte Differenzmerkmale auf Basis vorhandener Gebäudegeometrien eingesetzt und mittels Clustering veränderte und unveränderte Gebäude unterschieden. Verschiedene Clustering-Algorithmen werden analysiert, um komplexe Klassenverteilungen im Merkmalsraum trennen zu können. Ein Vorteil des entwickelten Ansatzes ist die Nutzung höchstaufgelöster Aufnahmen verschiedener Sensoren mit unterschiedlichen Aufnahme- geometrien, verschiedenen Erfassungsmodi und/oder zu unterschiedlichen Jahreszeiten. Dies ermöglicht die Nutzung des gesamten Datenbestandes aktueller und zukünftig verfügbarer höchstaufgelöster Satellitenbilddaten zum Monitoring von Städten auf mittleren und kleinen räumlichen Skalen. Die Übertragbarkeit des Ansatzes zur Änderungserkennung wird mit besonderem Augenmerk auf die Verteilung und das mögliche Ungleichgewicht der Klassen untersucht. Zu diesem Zweck wird ein Rahmenwerk entwickelt und in der chinesischen Stadt Dongying sowie der deutschen Stadt München angewandt, welche sich durch unterschiedliche Bebauungs- struktur sowie eine unterschiedliche zeitliche Dynamik auszeichnen. Die Ergebnisse zeigen geringere Genauigkeiten bei ungleich verteilten Klassen im Gegensatz zu einer ausgewogenen Verteilung. Clustering- Techniken wie der genetic k-means Algorithmus, die nichtlineare Klassengrenzen berücksichtigen und Cluster beliebiger Form erfassen, lieferten robustere Ergebnisse im Vergleich zum traditionellen k-means Algorithmus.
Darüber hinaus kann das Rahmenwerk für die Weiterentwicklung aktueller und zukünftiger Methoden zur
Änderungserkennung und Klassifikation genutzt werden, um die Robustheit und Übertragbarkeit der Methodik zu beurteilen und zu verbessern. Die Bewertung potenziell vorliegender Geisterstädte wird als exemplarische stadtgeographische Anwendung am Beispiel der chinesischen Stadt Dongying gezeigt. Das Bewertungskonzept basiert auf der Annahme, dass eine geringe Auslastung des verfügbaren Wohnraums eines der wichtigsten Merkmale einer Geisterstadt darstellt und auf Grundlage höchstaufgelöster Satellitenbilddaten in Kombination mit Zensusinformation analysiert werden kann. Dazu wird ein funktionales 4D-Stadtmodell erstellt, welches zur Abschätzung der verfügbaren Wohnfläche und damit der potenziellen Einwohnerzahl von Wohngebäuden dient.
Anschließend werden die Schätzungen der Bevölkerungskapazität mit der tatsächlichen permanenten Wohnbevölkerung der Zensusdaten verglichen. Aufgrund signifikanter Unterschiede dieser beiden Größen ergibt sich eine hohe Wahrscheinlichkeit für die Entstehung einer Geisterstadt in der Stadt Dongying. Darüber hinaus ermöglicht der Ansatz die Identifikation bestimmter Regionen des Stadtgebiets, die am wahrscheinlichsten betroffen sind. Perspektivisch lässt sich das funktionale 4D-Stadtmodell auch für andere Anwendungsbereiche im Kontext sich verändernder urbaner Räume einsetzen.
Die vorliegende Arbeit diskutiert nicht nur die Anwendbarkeit heterogener, höchstaufgelöster Satellitenbilddaten für die unüberwachte Änderungserkennung in Städten sowie die Übertragbarkeit der Methodik bezüglich der Verteilung der Klassen, sondern trägt darüber hinaus auf Basis der Bewertung potenziell vorliegender Geisterstädte am Beispiel der Stadt Dongying zu einem detaillierteren Verständnis des Stadtwachstums in hochdynamischen chinesischen Städten bei.
Contents
Acknowledgements ... i
Abstract ... ii
Zusammenfassung ... iv
Contents ... vi
List of Figures ... ix
List of Tables ... xii
Abbreviations ... xiii
Chapter I. Introduction ...1
1. Global transformation of cities ...1
2. Remote sensing for monitoring of urban areas ...2
2.1 Conceptualization of change in VHR remote sensing images ...4
2.2 Methods for change detection using VHR remote sensing ...7
2.3 Fields of application for change detection based on VHR data in cities ...12
3. Study area and background ...15
4. Objectives and aims of this dissertation ...18
5. Thesis structure ...20
Chapter II. Unsupervised change detection in VHR remote sensing imagery – an object-based clustering approach in a dynamic urban environment ...22
Abstract ...23
1. Introduction ...23
2. Materials ...26
2.1 Study area ...26
2.2 Data sets ...27
3. Methodology ...28
3.1 Preprocessing ...30
3.1.1 Preprocessing of optical imagery ...30
3.1.2 Generation of object geometries ...30
3.2 Preparation of object features ...32
3.3 Selection of relevant principal components ...34
3.4 Cluster analysis for change detection ...36
3.5 Accuracy assessment ...37
4. Experimental results ...37
4.1 Selection of relevant principal components ...38
4.2 Clustering for change detection and accuracy assessment ...41
5. Discussion ...45
6. Conclusion ...47
Acknowledgements ...48
Chapter III. Evaluation of clustering algorithms for unsupervised change detection in VHR remote sensing imagery ...49
Abstract ...50
1. Introduction ...50
2. Study area and data sets ...51
3. Methodology ...52
3.1 Generation of object-based features ...52
3.2 Change detection workflow ...53
3.3 Evaluation of clustering algorithms ...54
4. Results ...55
5. Conclusion ...57
Acknowledgements ...58
Chapter IV. Class imbalance in unsupervised change detection – A diagnostic analysis from urban remote sensing ...59
Abstract ...60
1. Introduction ...60
2. Study area and data sets ...63
3. Methodology ...68
3.1 Preparation of object features & change detection analysis ...69
3.2 Analysis of class imbalance ...70
4. Results ...72
4.1 Change detection results in Dongying and Munich ...72
4.2 Description of class imbalance ...76
5. Discussion ...84
6. Conclusion ...86
Appendix ...88
Acknowledgements ...89
Chapter V. Has Dongying developed to a ghost city? - Evidence from multi-temporal population estimation based on VHR remote sensing and census counts ...90
Abstract ...91
2. Ghost cities of China ...93
2.1 Background of the ghost city phenomenon in China...94
2.2 Current state of ghost cities in China...94
2.3 Scientific assessment of the ghost city phenomenon ...95
3. Conceptual framework ...96
4. Data & methods ...99
4.1 Data sets ...99
4.1.1 Remote sensing data ...99
4.1.2 Ground truth data on buildings ...100
4.1.3 Multi-temporal census data ...100
4.2 4d functional city model ...101
4.2.1 Change detection of buildings ...101
4.2.2 Classification of building types ...102
4.2.3 Transformation of building height ...104
4.2.4 Validation of the 4d functional city model ...105
4.3 Population capacity estimation ...106
4.4 Assessment of the ghost city phenomenon ...107
5. Results ...108
5.1 4d functional city model ...108
5.1.1 Multi-temporal building model ...108
5.1.2 Building types ...110
5.1.3 Number of floors ...110
5.1.4 Validation of the 4d functional city model ...111
5.2 Population capacity estimation ...111
5.3 Assessment of the ghost city phenomenon ...113
6. Discussion ...115
7. Conclusion ...119
Acknowledgements ...120
Chapter VI. Synthesis ...121
1. Summary and discussion ...121
2. Main conclusions ...126
3. Outlook and future research ...127
References ...130
Eidesstattliche Erklärung ...151
List of Figures
Fig. I-1: Conceptualization of change in multi-temporal VHR remote sensing images according to Bruzzone and Bovolo (2013). ...5 Fig. I-2: Examplary multi-temporal VHR image pair over Dongying, China. a) QuickBird image
acquired on 25.02.2007, b) WorldView-2 image from 17.01.2013. ...6 Fig. I-3 General change detection workflow (modified based on Tewkesbury et al. (2015)). ...8 Fig. I-4 Urban and rural population development in China from 1950 to 2017 according to
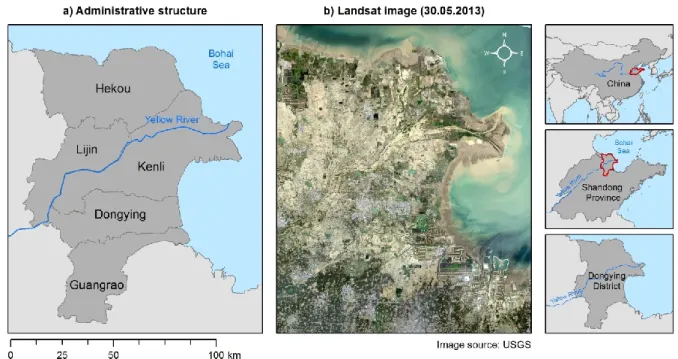
National Bureau of Statistics of China (2018). ...15 Fig. I-5 Study area of the Yellow River Delta: a) Administrative structure within Dongying
district, b) Landsat image of the Yellow River Delta. ...17 Fig. I-6 Visualization of the structure of this thesis. ...20 Fig. II-1 Study area and available data: a) QuickBird data 2007 (t
0-1), b) WorldView data 2013
(t
0), c) Detailed views of QuickBird, WorldView and Pléiades nDSM data, respectively. .28 Fig. II-2 Overview of the proposed workflow. ...29 Fig. II-3 Object geometries and experimental spatial adjustment: a) Extracted building footprints
and Pléiades nDSM, b) Detailed views of building footprints and adjusted object geometries according to QuickBird (t
0-1) and WorldView (t
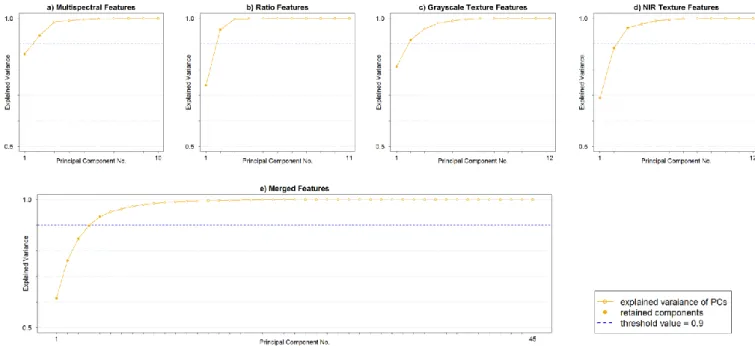
0), respectively. ...32 Fig. II-4 Cumulative proportion of explained variance in case of original object geometries after
PCA: a) Multispectral features b) Ratio features c) Grayscale texture features d) NIR texture features e) Merged features. ...39 Fig. II-5 Averaged parallel analysis in case of original object geometries after PCA: a)
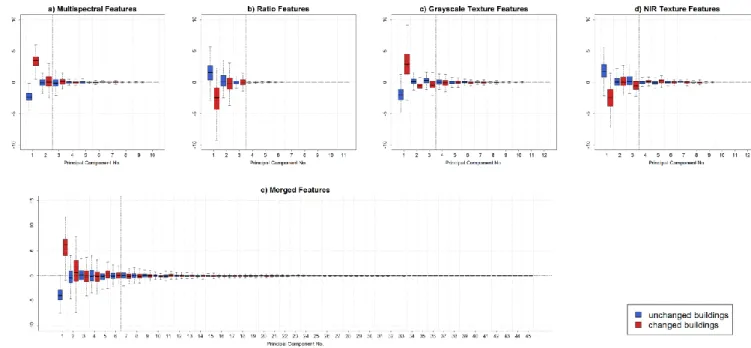
Multispectral features b) Ratio features c) Grayscale texture features d) NIR texture features e) Merged features. ...40 Fig. II-6 Boxplots of PCs with class labels (unchanged buildings in blue, changed buildings in
red) from reference data in case of original object geometries: a) Multispectral features b) Ratio features c) Grayscale texture features d) NIR texture features e) Merged features. The vertical black dashed lines indicate the cut-off point for the relevant PCs. ....41 Fig. II-7 Results of change detection in case of original object geometries: a) Multispectral
features b) Ratio features c) Grayscale texture features d) NIR texture features e) Merged features. Column 1 shows change maps and reference map (bottom), column 2 depicts the classification result as scatterplots of PC 1 (horizontal axis) against PC 2 (vertical axis), column 3 displays scatterplots of PC1 against PC2 colored according to reference classification. Green circles indicate good classification performance, red circles refer to worse classification agreement, respectively. ...43 Fig. II-8 Comparison of results of the unsupervised change detection approach based on the
merged feature set: a) Original object geometries b) Adjusted object geometries
(horizontal axis) against PC 2 (vertical axis) and corresponding change maps (bottom).
c) Reference map. ...45 Fig. III-1 Best results of unsupervised change detection based on genetic k-means clustering using
the merged feature set: a) clustering result b) ground truth map c) scatterplot of changed and unchanged buildings of PC1 against PC2 for the clustering result d) scatterplot of PC1 and PC2 of ground truth. ...57 Fig. IV-1 Experimental site and available data in Dongying, China: a) Building geometries and
ground truth information, b) Detailed views of multi-temporal remote sensing imagery, c) Orientation of buildings according to the main angle of polygons. ...65 Fig. IV-2 Experimental site and available data in Munich, Germany: a) Building geometries from
OSM and ground truth information, b) Details of multi-temporal IKONOS (2001) and WorldView (2010) imagery, c) Orientation of buildings according to the main angle of polygons. ...67 Fig. IV-3 Overview of the workflow for evaluation of class imbalance. ...68 Fig. IV-4 Results of unsupervised change detection for Dongying. a) Reference map b) Best
change detection result based on grayscale texture features and SOM clustering (κ = 0.87, TSS = 0.87, precision = 0.94, recall = 0.95). ...74 Fig. IV-5 Change detection results in case of Munich. a) Reference map b) Best change detection
result based on grayscale texture features and k-means clustering (κ = 0.22, TSS = 0.48, precision = 0.97, recall = 0.79). ...75 Fig. IV-6 Boxplots of κ across possible degrees of class imbalance (n:m, 1,000 iterations each) in
case of Dongying: a) Multispectral features b) Ratio features c) Grayscale texture features d) Merged features. Column 1 shows results for k-means, column 2 depicts change detection accuracy according to genetic k-means, column 3 displays the performance after SOM clustering. The red dotted line shows class imbalance of 54:46 corresponding to the original classification (Fig. IV-4). ...77 Fig. IV-7 Accuracy of change detection according to κ across possible degrees of class imbalance
(n:m, 1,000 iterations each) in Munich: a) Multispectral features b) Ratio features c) Grayscale texture features d) Merged features. Column 1 shows results for k-means, column 2 depicts change detection accuracy according to genetic k-means, column 3 displays the performance after SOM clustering. The red dotted line shows class imbalance of 93:7 corresponding to the original classification (Fig. IV-5). ...79 Fig. IV-8 True Skill Statistics (TSS) across possible degrees of class imbalance (n:m, mean value
of 1,000 iterations each) for test sites in Dongying (left) and Munich (right): a) Multispectral features b) Ratio features c) Grayscale texture features d) Merged features. Colors refer to different clustering algorithms (k-means, genetic k-means and SOM). The red dotted line indicates the distribution of classes for the two test sites. ...81 Fig. IV-9 Precision-Recall (PR) curves of unsupervised change detection across possible degrees
of class imbalance (n:m, mean value of 1,000 iterations each) in Dongying (left) and
Munich (right): a) Multispectral features b) Ratio features c) Grayscale texture features
d) Merged features. Colors refer to different clustering algorithms (k-means, genetic k-
means and SOM). ...83
Fig. V-1: The methodological framework of this study. ...97
Fig. V-2: Location of the study area and available data sets: a) Overview of the five municipalities in Dongying district and extent of the study area corresponding to the city of Dongying (red frame), b) Zoomed area from the Pléiades normalized digital surface model (nDSM) and derived building footprint geometries, c) Details of the QuickBird imagery from 2006/2007 (t
0), and d) Details from WorldView imagery acquired in 2013 (t
1). ...98 Fig. V-3 Transformation of building height to number of floors for all buildings within the study
area. Formulae index j refers to buildings from the reference data set, index i indicates the complete building inventory within the study area. For mathematical symbols and abbreviations see text. ...105 Fig. V-4 Workflow for estimation of population capacity. For mathematical symbols and
abbreviations see text. ...106 Fig. V-5 Change detection and classification results in Dongying. a) Multi-temporal building
model according to unsupervised change detection of QuickBird imagery from 2006/2007 (t
0) and WorldView-2 acquisitions from 2013 (t
1). b) Building types classification associated with residential and non-residential function. c) Details of the multi-temporal building model and building types classification. ...109 Fig. V-6 Relationship of building height (i.e., median height from the nDSM per building
footprint) and number of floors for 468 reference residential buildings within the study area. ...111 Fig. V-7 Multi-temporal estimation of population capacity at building level for the city of
Dongying. a) Population per building in 2013 (t
1). b) Estimated population capacity in 2006/2007 (t
0). c) Details of multi-temporal population capacity estimation. ...112 Fig. V-8 Multi-temporal comparison of population capacity estimates in 2006/2007 (t
0) and 2013
(t
1) (red) with census counts of Dongying district (orange) and Dongying municipality (blue). ...114 Fig. V-9 Spatial dynamics of the estimated population capacity related to census counts: a)
Spatial assessment of the ghost city phenomenon, and b) Detail of the spatial
assessment of the ghost city phenomenon. ...115
List of Tables
Tab. II-1 Object-based feature sets ...33
Tab. II-2 Number of relevant Principal Components ...40
Tab. II-3 Accuracy (κ) according to original and adjusted object geometries of the proposed approach ...44
Tab. III-1 List of object-based features ...53
Tab. III-2 Summarized values of kappa (κ) ...56
Tab. IV-1 Statistics of the two test sites in Dongying and Munich. ...64
Tab. IV-2 Object-based Features ...69
Tab. IV-3 Layout of the confusion matrix in case of binary classification ...71
Tab. IV-4 Number of relevant, non-trivial Principal Components ...73
Tab. IV-5 Accuracy measures for change detection in the experimental site of Dongying. a) Kappa b) True Skill Statistics. ...88
Tab. IV-6 Accuracy measures for change detection in the experimental site of Munich. a) Kappa b) True Skill Statistics. ...88
Tab. V-1 Object-based features for change detection ...101
Tab. V-2 Object-based features for building types classification based on Wurm et al. (2016), Geiß
et al. (2015a), Xie et al. (2015), and Lu et al. (2014b). ...103
Abbreviations
ATCOR Atmospheric and Topographic Correction CVA change vector analysis
DELIGHT Delta Information System for geoenvironmental and human Habitat Transition
DLR German Aerospace Center
DMSP/OLS Defense Meteorological Satellite Program / Operational Linescan System DSM digital surface model
DTM digital terrain model EUSI European Space Imaging
EO earth observation
EM expectation–maximization GHSL Global Human Settlement Layer GLCM gray-level co-occurrence matrix GLDV gray-level difference vector GUF Global Urban Footprint
GPW Gridded Population of the World GRUMP Global Rural-Urban Mapping Project
HR high resolution
IPCC Intergovernmental Panel on Climate Change
IPBES Intergovernmental Science-Policy Platform on Biodiversity and Ecosystem Services LBS location based services
MOD500 500 m Map of Global Urban Extent MERIS MEdium Resolution Imaging Spectrometer MODIS Moderate Resolution Imaging Spectroradiometer
MS multispectral
nDSM normalized digital surface model
NDVI normalized difference vegetation index
OA overall accuracy
OBIA object-based image analysis
OSM OpenStreetMap
PAM partitioning around medoids
PR precision-recall
PC principal component
PCA principal component analysis PPV positive predictive value
RF random forest
RMSE root mean square error
ROC receiver operator characteristics SAR synthetic aperture radar
SAVI normalized difference soil index
SLU Company for Remote Sensing and Environmental Research SMOTE synthetic minority oversampling technique
SOM self-organizing map
SVM support vector machines TPR true positive rate TNR true negative rate TSS true-skill-statistics
UN-Habitat United Nations Human Settlements Programme VHR very high resolution
WBGU German Advisory Council on Global Change
YRD Yellow River Delta
Chapter I. Introduction
1. Global transformation of cities
The Earth’s surface is under continuous and ongoing transformation. Especially in recent times the rate of change has been accelerating, whereas it is generally acknowledged that most of these alterations can be accounted to humanity (Vitousek et al. 1997). In this context of global change, the tremendous anthropogenic influences on ecosystems worldwide led to the introduction of the ‘Anthropocene’ as a new era (Crutzen 2002).
Although the ‘Anthropocene’ is not yet officially recognized as an unit of geological time (Lewis and Maslin 2015), global human activities have become pervasive and profound at unprecedented magnitudes and rates, especially after the end of the Second World War (Steffen et al. 2007). The clear influence of humanity on this rapid global transformation was also ascertained by the German Advisory Council on Global Change (WBGU) (WBGU 2016), the Intergovernmental Science-Policy Platform on Biodiversity and Ecosystem Services (IPBES) (IPBES 2019), as well as the Intergovernmental Panel on Climate Change (IPCC), in particular with respect to climatic changes on Earth (IPCC 2014).
These processes of reshaping and modification of the Earth’s surface can be observed especially in cities and their surroundings, which are hot spots and drivers of environmental changes in many regards (Grimm et al.
2008). Within the past 100 years, global population has increased exponentially and the future global population growth is entirely predicted for cities (United Nations 2017). With regard to urban areas, in 1900 only 15% of the world’s population lived in cities, whereas today over 50% of the people live in urban environments (Spence et al. 2009). In general, population growth is predicted for urban areas of all sizes, i.e., from small settlements smaller than 500,000 dwellers to megacities and megaregions with 10 million inhabitants or more (United Nations 2014). However, urban growth is not equally distributed across the globe as most of the current urban as well as total population is concentrated in Asia, whereas the greatest increase in population is expected for Africa (United Nations 2017). In 2100, Asia and Africa will be home of around 4.5 billion people each, compared to an estimated total global population of 11.2 billion (United Nations 2017).
A well-established program in the context of urbanization and population growth is the United Nations
the elaboration of strategies for efficient and sustainable cities against the background of rapid urban development. Another institutional approach for facing these trends are the Sustainable Development Goals introduced by the United Nations (www.un.org/sustainabledevelopment), which include a specific objective with respect to urban development (i.e., Goal 11 “Sustainable Cities and Communities”) for promotion of inclusive, safe, resilient, and sustainable cities. Finally, the World Bank (www.worldbank.org) collects data on urban development worldwide and provides knowledge and recommendations for governments through its regularly updated reports on regional as well as country-specific urbanization reviews.
In order to promote the envisaged goal of efficient, resilient, and sustainable development of cities, appropriate information is urgently required for political decision makers and urban planning. In addition to other data sources like official statistics, in situ measurements, or crowdsourcing data, suitable and relevant (geo-)information is available through data collected by various sensors (Scholten and Stillwell 2013). While data and corresponding information are relatively well available for cities of the Western world, there is an increased need for appropriate information especially in emerging and developing countries of Asia and Africa, as these areas are hot spots of urbanization and projected population growth (Cohen 2006; UN-Habitat 2016;
World Bank 2013).
2. Remote sensing for monitoring of urban areas
Against the background of global environmental changes and rapid urban development, remote sensing has proven an adequate tool for observation and monitoring (i.e., regularly repeated observations of an area over a period of time) of the Earth’s surface in many regards (Bartholomé and Belward 2005; Buiten and Clevers 1994;
Townshend et al. 1991), also with respect to urban areas (Taubenböck et al. 2015; Weng et al. 2018; Yang 2011). Based on numerous research studies and continuous improvement of methods for information extraction in urban environments, several global urban products and applications at medium and small spatial scales have been developed using remote sensing imagery within the past decades.
Examples of global products for the assessment of the urban extent with moderate spatial resolution are the 500 m Map of Global Urban Extent (MOD500) based on MODIS (Moderate Resolution Imaging Spectroradiometer) data (Schneider et al. 2009) or the 300 m GlobCover 2009 which was delineated from MERIS (MEdium Resolution Imaging Spectrometer) imagery (Arino et al. 2007; Bontemps et al. 2010). Two recent high resolution (HR) global urban maps are the 12 m Global Urban Footprint (GUF) product which was
produced from TerraSAR-X and TanDEM-X SAR (Synthetic Aperture Radar) data (Esch et al. 2013) and the 10 m Global Human Settlement Layer (GHSL) based on high resolution optical imagery from different sensors (Pesaresi et al. 2013). Other relevant data sources and approaches for mapping urban areas at medium and small spatial scales include multi-temporal Landsat imagery (Taubenböck et al. 2012) or the DMSP/OLS (Defense Meteorological Satellite Program / Operational Linescan System) nighttime light data (Zhang and Seto 2011). In addition, the Sentinel-1 (C-band SAR sensor) and Sentinel-2 (multispectral sensor) missions have been providing remote sensing data with high spatial resolution for global urban mapping recently (Ban et al. 2017).
These remote sensing data have also been used in combination with census counts for population estimation and mapping to provide global products like GPW (Gridded Population of the World) (Doxsey-Whitfield et al. 2015;
Tobler et al. 1997), GRUMP (Global Rural-Urban Mapping Project) (Balk et al. 2005), LandScan (Dobson et al.
2000), or the WorldPop data set (Stevens et al. 2015) at medium and high spatial resolution.
Satellite remote sensing imagery for multi-temporal assessment of urban areas is available with large spatial coverage from several space-borne sensors since the 1970s (Townshend et al. 1991). These sensors possess diverse characteristics with respect to temporal (i.e., imaging frequency, revisit time), spectral (i.e., number and wavelength of spectral bands, radiometric resolution, and radiometric calibration) as well as spatial (i.e., spatial resolution, and geometric registration) properties of the acquired data (Townshend and Justice 1988). In this regard, comprehensive capabilities have been demonstrated in literature for urban monitoring at large and global scales as mentioned above. Correspondingly, several effective methods for automatic and unsupervised change detection (i.e., identification of the occurrence and/or the type of changes within a defined time frame) based on satellite imagery with moderate (i.e., several 100 m) and high (i.e., 10 - 100 m) spatial resolution have been proposed in literature (Coppin et al. 2004; Lu et al. 2004; Radke et al. 2005; Singh 1989).
Around the year 2000, a new generation of optical remote sensing satellites with very-high resolution (VHR), which are commonly defined according to spatial resolution of 1 m or less, became available. These data enable detailed characterization and analysis of the Earth’s surface with particular advantages for mapping urban areas where various surface materials and objects are concentrated in a highly dynamic and complex manner (Carleer and Wolff 2006). In this context, VHR imagery allows the identification of individual man-made and natural objects and facilitates the classification of the intra-urban morphologic configuration of cities (Bellens et al.
2008; Wurm et al. 2011). After around 15 years of data collection by sensors like IKONOS, QuickBird, GeoEye- 1/2, WorldView-1/2/3/4 or Pléiades-1/2, VHR imagery became more available especially for applications in the temporal domain. However, existing research studies based on multi-temporal VHR data mostly analyze only
absent. In addition, the practical accessibility of this imagery remains challenging due to high cost of such commercial data at present. Nevertheless, the future increasing availability of VHR imagery, potentially decreasing data cost, as well as new VHR missions with alternative data policies (e.g., nano- and microsatellites like Planet SkySat) enable to value VHR data for information extraction and monitoring of urban areas (Butler 2014; Doncaster et al. 2016; Shao et al. 2017). Furthermore, the majority of research studies focus on change detection based on homogeneous data from only one sensor, whereas the combination of imagery from different sensors would significantly expand the potential VHR data basis. Thus, automatic and unsupervised change detection techniques, with additional capabilities of handling data from different sensors, are strongly required for effective analysis of the dynamics of intra-urban morphologic structure and large spatial coverage of multi- temporal VHR data (Bruzzone and Bovolo 2013).
2.1 Conceptualization of change in VHR remote sensing images
For the analysis and identification of changes in multi-temporal VHR imagery, several approaches and their applicability have been summarized according to different concepts of image analysis (e.g., Bhagat (2012), Hussain et al. (2013), Lu et al. (2014a), Tewkesbury et al. (2015)) in order to counter the complexity and heterogeneity of the image content in VHR data. To address the challenges caused by high dynamics in urban areas, Bruzzone and Bovolo (2013) proposed a versatile framework for change detection in VHR remote sensing imagery by introducing a taxonomy of possible radiometric changes which enables the association of their causes and semantic meaning. Based on this systematization, relevant changes to the specific application can be delimited against non-relevant radiometric differences and the methodology for change detection can be designed accordingly.
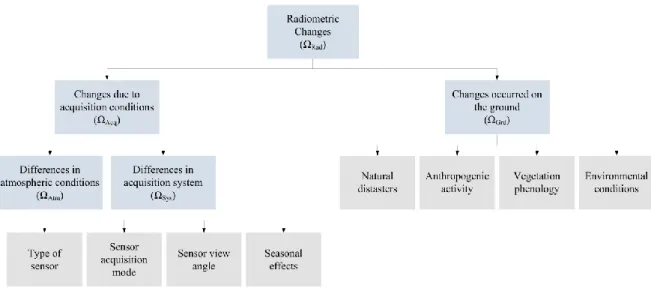
At the most generalized level of radiometric changes (ΩRad) that occur in between a pair of multi-temporal remote sensing images, changes due to acquisition conditions (ΩAcq) can be separated from changes occurred on the ground (ΩGrd) (Fig. I-1).
Fig. I-1: Conceptualization of change in multi-temporal VHR remote sensing images according to Bruzzone and Bovolo (2013).
According to the left side of Fig. I-1, changes due to acquisition conditions (ΩAcq) are composed of differences in atmospheric conditions (ΩAtm) as well as differences in the acquisition system (ΩSys). Varying atmospheric conditions mostly affect passive remote sensing imagery and include changing weather conditions (e.g., presence of clouds) as well as variations in atmospheric transmittance (e.g., concentration of ozone, water vapor, carbon dioxide, etc.). Differences in the acquisition system comprise different types of sensors, varying sensor view angles, seasonal effects (e.g., incidence angle of solar radiation), and deviating sensor acquisition modes of the VHR image pair. While atmospheric conditions can be mitigated by means of atmospheric correction as well as detection and masking of clouds, differences in the acquisition system are highly likely in a multi-temporal data setting of VHR imagery since suitable image pairs from the same sensor of a particular area of interest for a specific period of time with similar acquisition parameters are largely absent due to the intermittent acquisition tasking of most VHR remote sensing satellites. Especially different sensor view angles and changing solar incidence angles within the course of the year strongly affect the multi-temporal representation of objects which possess vertical extension in VHR imagery in terms of parallax distortion as well as object shadows.
The right side of Fig. I-1 depicts the changes that occurred on the ground (ΩGrd), which are commonly relevant from the application point of view. These changes of land cover are categorized into four groups according to Bruzzone and Bovolo (2013), however, numerous other categorizations may be utilized dependent on the specific conceptualization and application context of change detection. In Fig. I-1, changes due to natural disasters (e.g., floods, earthquakes, landslides, etc.), vegetation phenology (e.g., crop growth, fall of leaves, etc.),
environmental conditions (e.g., desertification, glacier retreat, snow cover, etc.), and anthropogenic activity (e.g., forest clear cut, construction of buildings, etc.) are considered. Especially the latter category is highly relevant from the perspective of urban geography and urban growth. In particular, VHR images enable the detection of the built environment and its changes, since man-made objects on the land surface, such as individual buildings, are less recognizable in images with moderate or high spatial resolution.
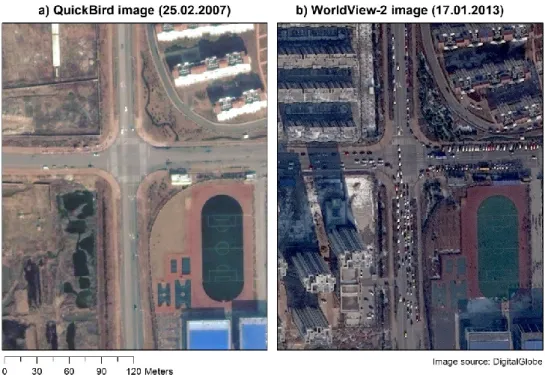
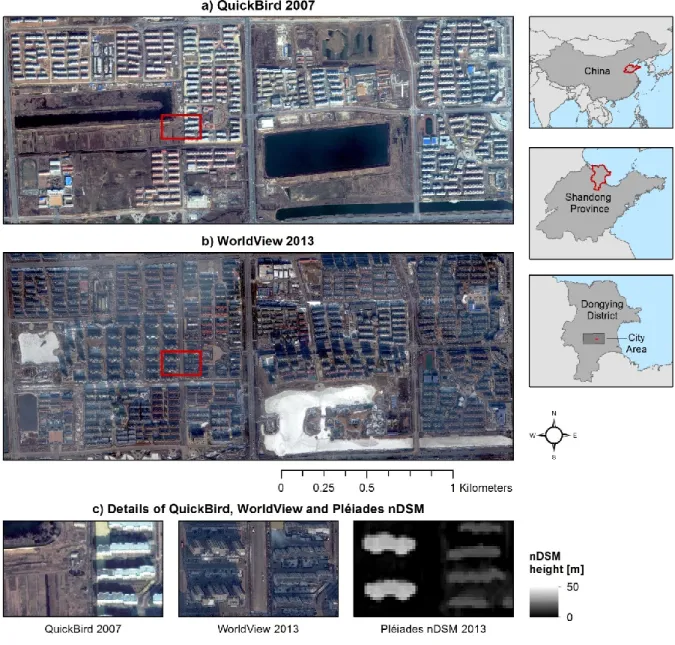
Fig. I-2: Examplary multi-temporal VHR image pair over Dongying, China. a) QuickBird image acquired on 25.02.2007, b) WorldView-2 image from 17.01.2013.
Fig. I-2 depicts an example of a multi-temporal image pair in a dynamic urban area of the city of Dongying, China for illustration of the framework for change detection (Fig. I-1). Obviously, a considerable amount of changes occurred on the ground (ΩGrd) within the temporal interval of six years. Dependent on the application, several anthropogenic activities might be of interest, for example the construction of buildings and corresponding loss of other land cover or the changing traffic volume (i.e., the number of cars). However, different environmental conditions in terms of snow cover or different phenological states of the vegetation are also visible. Besides these differences affecting the Earth’s surface, the atmospheric conditions (ΩAtm) deviate in between the acquisition dates. Finally, differences in the acquisition system (ΩSys) induce changes in the image pair. The different sensors (i.e., QuickBird and WorldView-2) possess deviating sensor acquisition modes, i.e., different number of multispectral bands with slightly deviating wavelengths. Deviating sensor view angles cause
significantly different representation of vertical objects due to the parallax distortion, which particularly affects high-rise buildings. In addition, the intra-annual temporal difference of 39 days causes variations of the solar radiation incidence angle which manifests in different shadowing of vertical objects in the multi-temporal image pair.
In general, the taxonomy presented in Fig. I-1 can be customized to specific applications and available VHR images while irrelevant parts can be removed for proper modeling of the change detection problem and facilitation of a highly accurate change detection approach. However, especially for unsupervised and highly automated implementation of the change detection methodology, appropriate preprocessing methods must be applied in order to separate non-relevant radiometric differences and enable proper identification of changes that are relevant to the specific application (Bruzzone and Bovolo 2013).
2.2 Methods for change detection using VHR remote sensing
To date, numerous change detection techniques have been proposed based on optical remote sensing imagery with moderate and high spatial resolution (Coppin et al. 2004; Lu et al. 2004; Radke et al. 2005; Singh 1989).
However, not all of these methods are capable of proper identification of changes due to the complexity of VHR remote sensing image analysis (Bruzzone and Bovolo 2013; Hussain et al. 2013; Lu et al. 2014a).
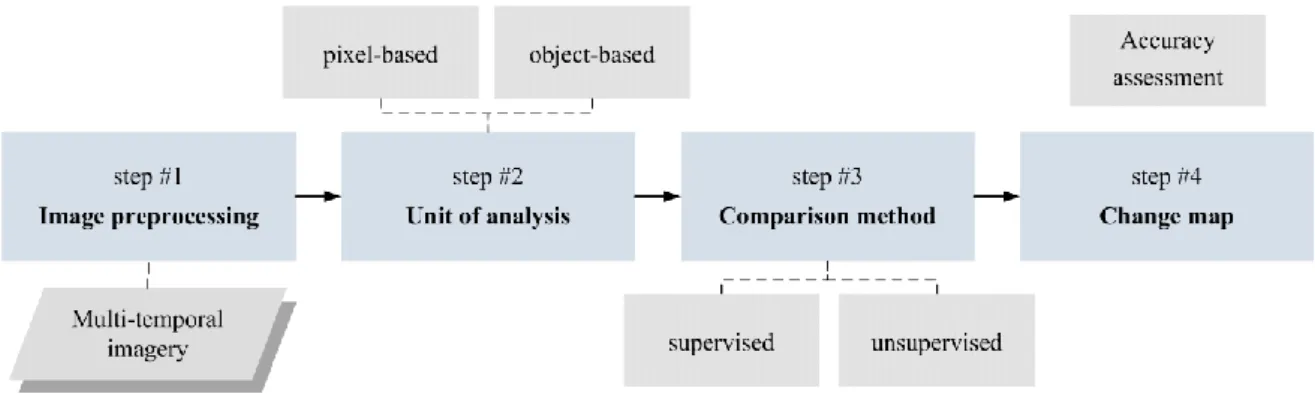
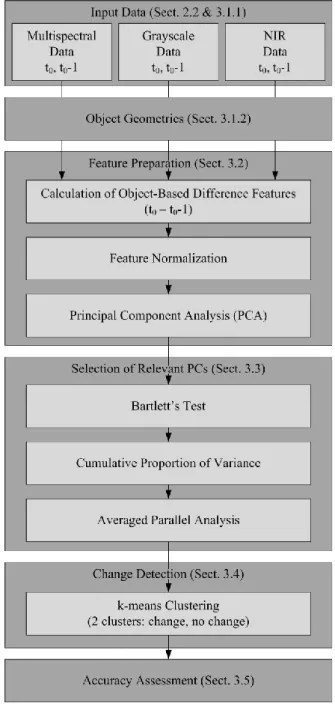
In general, the change detection workflow can be divided into four steps according to Fig. I-3. First, the multi- temporal remote sensing imagery must be preprocessed in order to mitigate differences in atmospheric conditions or to ensure exact spatial matching of the data. Second, the selected unit of analysis is commonly separated in pixel- and object-based approaches at the most general level. At this stage, the input features for change detection are derived and prepared based on the unit of analysis. Third, the comparison method for determination of changes can be applied depending on the availability of prior knowledge on the change detection task, which generally divides techniques into supervised and unsupervised methods. Finally, the resulting change map may either hold binary information on the occurrence of changes only or contain more detailed characteristics on the magnitude and/or type of changes. This step also includes the mandatory assessment of the change detection accuracy.
Fig. I-3 General change detection workflow (modified based on Tewkesbury et al. (2015)).
step #1 - Image preprocessing
According to Webb (2011), proper preprocessing of the input data is one of the most relevant tasks in any data analysis task. Preprocessing does not only increase the accuracy of change detection results, but also decreases the algorithmic complexity as well as computing time (Kantardzic 2011). Foremost, preprocessing applies to the multi-temporal remote sensing imagery which must be geometrically aligned accurately. In addition, differences in atmospheric conditions between the multi-temporal acquisitions due to changing weather conditions and variations in atmospheric transmittance can be mitigated by means of atmospheric correction. The importance of preprocessing with respect to change detection algorithms is highlighted by Radke et al. (2005), its particular relevance for unsupervised object-based methods is discussed by Bruzzone and Bovolo (2013).
step #2 - Unit of analysis
At the second stage of the change detection workflow (Fig. I-3), methods can be categorized according to the unit of analysis, which is most commonly separated in pixel- and object-based approaches (Hussain et al. 2013).
Although object-based methods for change detection are recommended in general over pixel-based methods for VHR images in recent review studies (Hussain et al. 2013; Lu et al. 2014a), pixel-based approaches remain frequently proposed. Furthermore, many change detection techniques are almost identical and vary only by the unit of analysis (e.g., change vector analysis (CVA)) which results in a significant technical overlap between pixel- and object-based methods (Warner and Almutairi 2009) and any pixel-based change detection technique could be applied to objects and vice versa (Tewkesbury et al. 2015). However, in multi-temporal VHR data settings accurate change detection results based on pixel-based methods are mostly only possible with identical or very similar parameters of the acquisition system (ΩSys) and exact spatial matching of the data. By implication, object-based change detection methods offer the capability of mitigating differences in the
acquisition system (ΩSys) or inaccuracies of georeferencing by exploiting the object-based paradigm using appropriate object boundaries and object-based features (Blaschke 2010). Especially for VHR imagery, object- based methods are beneficial in general since the considered image objects largely consist of a set of pixels that are reasonably analyzed together (Blaschke 2010). Furthermore, object-based image analysis enables the utilization of additional features (e.g., first-order statistics, texture, or spatial context) for change detection besides pure reflectance values of individual pixels (Chen et al. 2012).
Dependent on the general principle of image object generation and consequent analysis, two major categories of object-based change detection approaches were consistently identified (with slightly different terminologies and few modifications) by the review studies of Chen et al. (2012), Hussain et al. (2013), Lu et al. (2014a), and Tewkesbury et al. (2015).
The first category describes image objects that are initially generated in each multi-temporal image separately and subsequently compared between acquisition dates. This technique enables the most accurate representation of objects in each individual image. In addition, also features with respect to the size or shape of objects can be compared for change detection. However, proper establishment of spatial and temporal links between image objects is challenging and may introduce so called sliver objects in case of polygon intersections (Tewkesbury et al. 2015). Early examples of separate image objects for change detection are Niemeyer et al. (2008) and Lefebvre et al. (2008), who employed QuickBird and aerial images for detection of land cover changes. More recently, Liu et al. (2018a), Xiao et al. (2017), and Zhang et al. (2017) performed change detection of building in VHR imagery based on separate segmentations while focusing on the spatio-temporal linkage of multi-temporal objects. A modified technique from this category of image object generation is the segmentation of one image and subsequent overlay on another image. For example, Listner and Niemeyer (2011) use this concept for change detection in multi-temporal QuickBird imagery.
The second category of change detection approaches is based on multi-temporal image object generation, where common object geometries are employed for all images. In general, these geometries are created by segmentation of a stack of multi-temporal images. This technique provides the advantage of image objects that are consistent in size and shape over time (Hussain et al. 2013). In addition, multi-temporal image objects are spatially consistent while highlighting key multi-temporal boundaries (Tewkesbury et al. 2015). However, differences due to acquisition conditions (ΩAcq) (e.g., atmospheric conditions, sensor view angles etc.) between the images might blur the segmentation result (Chen et al. 2012). The first important research studies who analyzed changes in natural landscapes based on multi-temporal image objects were Bontemps et al. (2008),
detection in urban areas, while Zhang et al. (2018b) extended this concept to a multi-temporal multi-scale representation of image objects for change detection. A special case of the second category is the utilization of vector polygons that are superimposed as multi-temporal image objects for change detection. In this context, it is crucial that the spatial scale of objects as well as the spatial reference matches the multi-temporal imagery (Tewkesbury et al. 2015). Frequently, this technique is used for map updating, where remote sensing imagery is used for the identification of changes based on existing vector polygon maps. Examples of such approaches are Bouziani et al. (2010) and Durieux et al. (2008), who detected building changes in VHR imagery due to construction and urban growth. Opposed to this, Sofina and Ehlers (2016) and Ye et al. (2017) employ this technique for building damage detection after an earthquake.
In addition, Chen et al. (2012) as well as Tewkesbury et al. (2015) include hybrid approaches that combine pixel- and object-based analysis as a special category for change detection. Examples from this special category are Lv et al. (2019) and Xiao et al. (2016), who employ object-based post-processing methods on initial pixel- based change detection results.
step #3 - Comparison method
According to the third step of the change detection workflow depicted in Fig. I-3, an important feature for the categorization of change detection algorithms is the availability of prior knowledge which separates supervised and unsupervised techniques. The choice of the change detection strategy in this regard is foremost dependent on the availability of reliable multi-temporal training samples in temporal accordance with the multi-temporal remote sensing imagery (Richards 2012). In addition, supervised methods classify the input data according to the provided labels while unsupervised techniques aim to identify the inherent structure of the data, which is a conceptually different approach in general (Webb 2011). Considering this fundamental methodological difference and in view of transferability and automatization, the necessity of collecting proper a priori information (i.e., labels for training) in case of supervised change detection techniques complicates this task. In contrast, the absence of a priori information in case of unsupervised change detection approaches requires proper preprocessing of the input data in order to supplant irrelevant radiometric differences for accurate detection of changes with respect to the specific application (see Section 2.1).
Review studies on change detection provide exhaustive lists and categorizations of supervised and unsupervised algorithms that can be employed for multi-temporal comparison of pixels or image objects. For example, Lu et al. (2004) distinguish 31 different techniques, and Bhagat (2012) discriminates 29 distinct methods for change detection. In order to provide a concise summary within the scope of this dissertation, the
most important and recently applied techniques are summarized into two major categories while less used methods are not described in detail.
The first category of comparison methods can be characterized as arithmetic and algebraic methods that compare the multi-temporal imagery based on radiometric differences between the images. These methods utilize spectral values of the image bands or derived indices, such as the Normalized Difference Vegetation Index (NDVI). The most straightforward way of change identification in this regard is image differencing, which reflects the magnitude of change by subtracting one image from another. Examples based on this techniques are Bovolo and Bruzzone (2007a), or Hall and Hay (2003). In particular for object-based change detection, the consideration of texture and spatial context extends the capabilities of arithmetic method for change detection (e.g., Klaric et al. (2013), Zhu et al. (2017)). For determination of a binary change map, these methods are frequently combined with unsupervised as well as supervised decision functions like thresholding (Falco et al.
2013), k-means clustering (Tang and Zhang 2017), the expectation–maximization (EM) algorithm (Li et al.
2017b), support vector machines (SVM) (Volpi et al. 2013), or deep learning methods (Cao et al. 2017; Mou et al. 2019). Another popular change detection method that can be attributed to algebraic methods is CVA. Besides its magnitude, this technique also enables the assessment of the type of change by the direction of the change vector (Bovolo and Bruzzone 2007b). CVA was frequently applied for both, pixel- and object-based change detection, as well as in terms of supervised and unsupervised comparison. For example, supervised CVA was employed in a pixel-based manner by Varshney et al. (2012), while Liu et al. (2018a) utilized this technique on objects. In addition, Thonfeld et al. (2016) implemented unsupervised pixel-based CVA, and Chen and Chen (2016) proposed this method in an object-based way. A recent example using a combination of different methods is Bullock et al. (2019), who employ an ensemble of algorithms for change detection.
The second category of comparison techniques for change detection is based on classification methods, which either classify the multi-temporal image stack directly or perform a comparison of multi-temporal classification maps in terms of post-classification change detection (Hussain et al. 2013). For this purpose, a variety of classification approaches was utilized in literature. For example, Xian et al. (2009) and Brunner et al. (2010) introduced threshold-based classification methods on pixels as well as image objects for multi-date direct classification. Other commonly used classification techniques to mention in this regard are SVM (e.g., Li et al.
(2010), Shah-Hosseini et al. (2017)) or random forest (RF) (e.g., Li et al. (2015)). Recently, also deep learning was applied for change detection based on multi-date direct classification (Zhang et al. 2019b; Zhang et al.
2016). These techniques were equally employed for post-classification change detection (e.g., Lefebvre and
Corpetti (2017), Ye et al. (2016)). In addition, other approaches like rule-based classification (Zhou et al. 2008), or clustering (Li et al. 2017a) were proposed for classification based change detection.
step #4 - Change map
The fourth and final step of the change detection workflow depicted in Fig. I-3 is the change map, which directly results from the previous step. Dependent on the change detection approach, the change map may hold binary information on the occurrence of changes or more detailed characteristics on the magnitude and type of changes. The confusion or error matrix, which opposes classified against reference areas (i.e., pixels or objects) for each class, is most frequently established for mandatory accuracy assessment (Congalton 1991). Common measures of accuracy which can be delineated from the confusion matrix are, among others, the overall accuracy (Congalton 1991), Cohen’s kappa coefficient κ (Foody 2002), the F-score (Van Rijsbergen 1979), the True-Skill- Statistics (TSS) (Allouche et al. 2006), or Receiver Operator Characteristics (ROC) as well as Precision-Recall (PR) curves (Davis and Goadrich 2006).
2.3 Fields of application for change detection based on VHR data in cities
The increasing availability of VHR remote sensing imagery (Section 2) in combination with an appropriate methodology for the reliable identification of changes (Section 2.2) enables a wide range of fields of application for change detection in cities. First, as proposed by Bruzzone and Bovolo (2013) in Fig. I-1, changes that occurred on the ground (ΩGrd) can be analyzed for urban applications. Second, applications that combine changes of land cover from the first category with ancillary data (e.g., statistical data, census counts, etc.) allow a more detailed characterization of intra-urban dynamics and their geographical implications. Finally, a high potential for the development of new fields of multi-temporal applications exists for both categories and will be outlined based on existing mono-temporal studies in this regard.
First, applications based on changes of land cover in urban areas have been proposed in literature since the early 1970s (Dueker and Horton 1972). Based on remote sensing imagery with high spatial resolution, several case studies were developed at different spatial scales from city level to nationwide analyses of urban growth (e.g., Huang et al. (2017), Li et al. (2015), Taubenböck et al. (2012), Taubenböck and Wiesner (2015), Wang et al. (2012a)). In addition, first global multi-temporal applications on urban growth were published based on HR data (Esch et al. 2018; Liu et al. 2018b). With regard to VHR remote sensing imagery, similar applications on urban growth were established (Xiao et al. 2016). However, due to a lack of VHR data at medium and small
spatial scales, these studies were only conducted locally (mostly for single VHR scenes) but at high level of detail (i.e., at the level of individual buildings) (Wang et al. 2018b; Xiao et al. 2017). To value the unique capabilities of VHR data in terms of classification of the intra-urban morphologic configuration of urban areas, several more detailed urban growth studies have been developed. For example, Gruebner et al. (2014) and Kit and Lüdeke (2013) conducted the multi-temporal detection and assessment of informal settlements as a special morphologic appearance in urban areas, while Lefebvre and Corpetti (2017) aim at the identification of morphologic transformations (i.e., intra-urban structural changes). In contrast to urban growth, Thompson and de Beurs (2018) tracked the removal of buildings and consequent shrinking of cities. Another application in this regard is monitoring of impervious surfaces, which was demonstrated by Zhang and Huang (2018). Concerning vegetation cover, Handayani et al. (2018) and Wang et al. (2018a) explored the multi-temporal dynamics of urban green based on VHR remote sensing data. Another important and well-established field of application with regard to changes of land cover based on VHR remote sensing is the detection of damages as a result of a natural disaster. Frequently, multi-temporal VHR imagery was utilized for the detection of damages to the built environment after an earthquake (e.g., Brunner et al. (2010), Falco et al. (2013), Li et al. (2010), Yeom et al.
(2017)) or a tsunami (e.g., Olsen et al. (2013), Pesaresi et al. (2007), Shah-Hosseini et al. (2017), Tanathong et al. (2008)). Other applications of damage detection by means of VHR imagery were conducted in the aftermath of landslides (Gong et al. 2008; Park and Chi 2008), typhoons (Gueguen and Hamid 2016), or different situations of armed conflicts (Klonus et al. 2012; Knoth and Pebesma 2017; Kranz et al. 2017).
Additional potential for applications based on changes of land cover lies in the analysis of the intra-urban morphologic configuration, where the mono-temporal classification of urban functional zones based on VHR remote sensing imagery was conducted at different levels of detail (Li et al. 2016; Lin et al. 2016; Zhang et al.
2018a). Similar classification approaches targeting urban morphologic structure and function were implemented by Li et al. (2018) as well as Luo et al. (2019) in the application context of urban ecology. Huang et al. (2013) estimated the mono-temporal distribution as well as volume of urban green, whereas a detailed typology of the urban vegetation was performed by e.g., Rougier et al. (2016) and Tigges et al. (2013). In this context, the carbon storage (Schreyer et al. 2014) as well as the water consumption (Di et al. 2019) of urban vegetation were investigated based on VHR data. The urban morphology was also utilized for wind speed estimation in the context of urban meteorology (Kent et al. 2019), which is also a relevant parameter for noise modeling (Nega et al. 2012) as well as in urban temperature studies (Bechtel et al. 2015; Stewart and Oke 2012). In this context, the urban heat island effect was investigated by several studies employing information from mono-temporal VHR
supply (Geiß et al. 2011) or photovoltaic energy generation (Santos et al. 2014) was also proposed based on VHR data. Finally, the potential of VHR imagery for vehicle detection and traffic monitoring was demonstrated by Kopsiaftis and Karantzalos (2015) as well as Li et al. (2019).
Second, the category of multi-temporal applications based on VHR data that combine changes of land cover with ancillary data have hardly been investigated recently (Si Salah et al. 2019). In this context, Veljanovski et al. (2012) explored multi-temporal population estimation based on multi-temporal VHR imagery and census data in informal settlements.
With regard to applications that combine VHR land cover from remote sensing with ancillary data, several mono-temporal studies exist. For example, the dwellings of a refugee camp were determined by Aravena Pelizari et al. (2018) and Spröhnle et al. (2017), whereas the water consumption of informal settlements was estimated by Niebergall et al. (2008). The analysis of vulnerability and risk against natural disasters is an important field of application based on VHR remote sensing and was demonstrated in the context of earthquakes (Geiß et al.
2015a; Pittore and Wieland 2013), tsunamis (Eckert et al. 2012; Römer et al. 2012), or flood events (Sowmya et al. 2015; Taubenböck et al. 2011). Several socio-economic parameters have been related to the urban morphology based on mono-temporal VHR satellite images, for example the economic status of residents (Wurm and Taubenböck 2018), the value of housing (Taubenböck et al. 2009), land rent (Wu et al. 2019), or incidents of crime (Patino et al. 2014; Sathyakumar et al. 2018). Quality of life in general was estimated using VHR remote sensing data by Cabrera-Barona et al. (2016), among others. Finally, population estimation is an important field of application in urban areas where VHR remote sensing was frequently utilized (Biljecki et al. 2016;
Taubenböck et al. 2007; Wu and Murray 2005).
Although this list of studies with regard to the two categories of applications may not be exhaustive, it becomes evident that the capabilities of multi-temporal VHR imagery have not been exploited in all possible fields of application. The wealth of mono-temporal studies demonstrates the potential for multi-temporal analysis using VHR remote sensing data and appears feasible in many regards (Lu et al. 2004; Miller and Small 2003; Qin et al. 2016). Against this background, a multi-temporal analysis could introduce additional relevance and a different perspective to the investigated topic of urban geography and enable new fields of application.
3. Study area and background
The global trend of urbanization is particular dynamic in China, which possesses among the highest urbanization rates worldwide (Seto et al. 2011; Taubenböck et al. 2014). Based on 1.4 billion inhabitants in 2017, China is the most populous country of the world (United Nations 2017). However, area-wide, homogeneous, and up-to-date data and derived information on urbanization is still lacking in many regards. In addition, the political system of China and urban planning provide a globally unique framework condition for urban development (Gar-on Yeh and Wu 1999; Wu 2015). In this regard, several studies have investigated urban growth in China based on remote sensing data with medium and high spatial resolution at different spatial scales, e.g., individual cities (Chen et al. 2014; Li et al. 2015), urban agglomerations (Tan et al. 2005; Taubenböck et al.
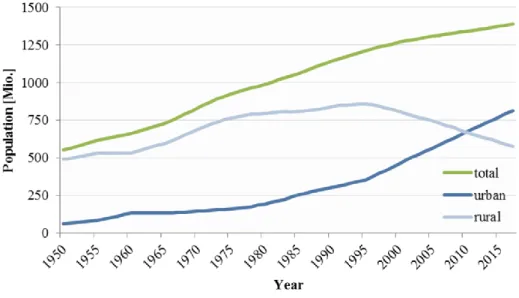
2014) as well as at national scale (Wang et al. 2012a; Xiao et al. 2014). However, research studies based on remote sensing beyond the application of urban growth are still in the minority. In accordance with the expansion of urban areas, population numbers have generally increased massively, especially in relation to the urban population (Ruibo and Linna 2013). As shown in Fig. I-4, for the first time around the year 2010, more people were living in urban areas than in rural areas in China.
Fig. I-4 Urban and rural population development in China from 1950 to 2017 according to National Bureau of Statistics of China (2018).