Research Collection
Journal Article
Insight into elevated temperature and thin membrane
application for high efficiency in polymer electrolyte water electrolysis
Author(s):
Garbe, Steffen; Futter, Jonas; Schmidt, Thomas J.; Gubler, Lorenz Publication Date:
2021-05
Permanent Link:
https://doi.org/10.3929/ethz-b-000475848
Originally published in:
Electrochimica Acta 377, http://doi.org/10.1016/j.electacta.2021.138046
Rights / License:
Creative Commons Attribution-NonCommercial-NoDerivatives 4.0 International
This page was generated automatically upon download from the ETH Zurich Research Collection. For more information please consult the Terms of use.
ETH Library
ContentslistsavailableatScienceDirect
Electrochimica Acta
journalhomepage:www.elsevier.com/locate/electacta
Insight into elevated temperature and thin membrane application for high efficiency in polymer electrolyte water electrolysis
Steffen Garbe
a, Jonas Futter
a, Thomas J. Schmidt
a,b, Lorenz Gubler
a,∗aElectrochemistry Laboratory, Paul Scherrer Institute, 5232 Villigen PSI, Switzerland
bLaboratory of Physical Chemistry, ETH Zürich, 8093 Zürich, Switzerland
a rt i c l e i nf o
Article history:
Received 30 October 2020 Revised 22 February 2021 Accepted 22 February 2021 Available online 3 March 2021 Keywords:
Proton exchange membrane (PEM) water electrolysis
Water splitting
Polymer electrolyte water electrolysis Elevated temperature
Overpotential analysis High efficiency Thin membrane
a b s t r a c t
Wepresentastudyofaliquidwaterfedpolymerelectrolytewaterelectrolyzer(PEWE)atcelltemper- aturesofupto120°Cusingthin membranesof50 μmthickness.Further,weshow thatunder these conditionsconversionefficiency increasesby upto14%at3Acm−2 incomparison totoday’sstateof theart(60°C,180μmmembrane).Alternatively,anincreaseofthecurrentdensity byafactorof3at anefficiencyof75%ispossible.Adetailedvoltagelossanalysisisprovidedthathelpstounderstandto whichextenttheoverpotentialcontributionsarereduced.Fromhydrogenpermeationmeasurements,we determinefaradicefficiencyandthesafetylimitsofcelloperationrevealingthatoperatingtemperatures higherthan100°Cwiththin membranesarenot possibleatcurrentdensitieslowerthan0.8Acm−2 duetothesafetylimitof2%hydrogeninoxygenintheanodecompartment.Thedecreaseinoverpoten- tialallowstosignificantlyreducetheenergyrequirementortoincreasetheproductionrateofhydrogen.
Theresults canhelptobenchmarkfuture efficiencytargetsand pointstowardsnextgeneration PEWE materialsandcomponentstofurtherreducelosscontributions.
© 2021TheAuthor(s).PublishedbyElsevierLtd.
ThisisanopenaccessarticleundertheCCBY-NC-NDlicense (http://creativecommons.org/licenses/by-nc-nd/4.0/)
1. Introduction
Greenhousegases, especiallytheirmostprominentrepresenta- tive CO2, are responsible foran increasing temperature on earth andaretargetedto bereducedsignificantlyby 2050accordingto the ParisAgreementoftheUnitedNations. 98%oftoday’shydro- gen production is generatedfrom fossilenergy sources responsi- ble foran emission of 830Mt CO2 per year[1].Less than 1% of theworld’shydrogendemandisproducedfromrenewablesources (green hydrogen).Onekeytechnologyfortheproductionofgreen hydrogenispolymerelectrolytewaterelectrolysis(PEWE)[2],pro- videdthattheelectricityusedhasalowcarbonfootprint.Amajor obstacle ofthetechnologytoenterlarge-scale markets,forexam- ple for hydrogen based mobilityor the chemical industry, isthe highhydrogenproductioncostincomparisontotraditionalmeth- ods from gas and coal. It has been shown that e.g. in Germany green hydrogen fromPEWE can be produced atan average cost ofabout5$kg−1 [3].TheInternationalRenewableEnergyAgency (IRENA) publisheda report showingtoday’s hydrogen production cost to range between 2.7 to 6.3 $ kg−1, depending on location
∗Corresponding author.
E-mail address: lorenz.gubler@psi.ch (L. Gubler).
andrenewable energysource[4].In contrast,hydrogenfromfos- sil feedstock is produced at a cost of 1.2 to 2.4$ kg−1 [4]. The costofhydrogeniscomposedofthecapitalexpenditures(CAPEX), i.e.the cost of investment,and operational expenditures (OPEX), whichisdominatedbythecostofelectricity.Recently,Ayersetal.
[5]showedthatthe capitalexpenditureofPEWEcouldbe signif- icantlyreduced throughthe useofnewmaterials. TheOPEX will be presumably furtherreduced dueto the estimateddecrease in renewable energycost.However, theefficiencyofPEWEneeds to beincreasedtoreachcompetitivegreenhydrogenprices.
Theoperation ofaPEWEatelevated temperatureandtheuse of thin membranes would be one possibility to increase conver- sionefficiency[2].Ontheonehandanincreaseinoperatingtem- perature favors reaction thermodynamics as well as kinetics on theother handa decreaseinmembranethicknessreducesohmic losses[6].
Inpolymerelectrolytefuelcells(PEFCs)operatingtemperatures above80°Cleadtoconductivitylossoftheprotonexchangemem- braneduetodryout,whichhastobecounteractedwithincreasing gaspressureandhumidification[7].InPEWEthesupplywithliq- uidwaterinsteadofhumidifiedgasesleadstoahighercontentof water in the polymer electrolyte. Industrial PEWEs are currently operated at about 60 °C, 30 bara differential pressure, current
https://doi.org/10.1016/j.electacta.2021.138046
0013-4686/© 2021 The Author(s). Published by Elsevier Ltd. This is an open access article under the CC BY-NC-ND license ( http://creativecommons.org/licenses/by-nc-nd/4.0/ )
densities of upto 2 Acm−2,anduse perfluoroalkylsulfonic acid (PFSA)membranesof150to200μmthickness,attainingatypical efficiency
ε
HHV of72% (HHV= higherheatingvalue)[8].The US DepartmentofEnergy(DOE)publishedadocumenthasbeenpro- posedε
HHV of92%by usingoperatingcelltemperaturesof90°C andtheuseof50μmthick membranestoachieve agreenhydro- genpriceof2$kg−1[9].In the following, we give a short review on past studies on elevated temperature PEWE. Linkous et al. were the first to our knowledgetoinvestigatePEWEatelevatedoperatingtemperatures of up to 100 °C using hydrocarbon membranes [10]. Antonucci etal.reporta3to4-fold increaseincurrentdensityatequalpo- tential with a metal oxide doped composite PFSA membrane in PEWE by increasing the operating temperaturefrom 60to up to 120 °C [11, 12]. Metal oxide doped composite PFSA ionomer is known from elevated temperature PEFCs to improve membrane humidification[13].WithapristinePFSAmembrane,theyobserved adecreaseinperformanceofthecelluponincreasingthecelltem- peraturefrom100to120°C.Theauthorsattributedtheimproved performancewiththecompositemembranetoanincreasedreten- tion ofwaterionthe ionomer.Xuetal.showeda PEWEcell po- tentialdecreaseof0.3Vat1Acm−2 by increasingthe operating temperaturefrom80to 120°Candincreasing operatingpressure from0.5barato3barawithametaloxidedopedcompositemem- brane[14].Theyexplainedthatanincreaseinliquidwaterpressure at elevated temperatures would mitigate the tendency of mem- brane dryout and, consequently, conductivity loss. Ailiet al. and Hansen et al. used phosphoric acid doped PFSA, polybenzimida- zole(PBI)andaPFSA/PBIblendmembraneinsteamfedPEWE[15, 16]. However, the performance wasstill considerably lower than thatofstate-of-theartlowtemperatureliquidfedPEWE.Morere- centstudiesreportincreasedperformanceofaPFSAmembranein PEWEwhenpressurizingfrom1to3baraat120°Coperatingtem- perature[17–19].Theauthorsexplaintheincreaseinperformance by theincreased concentration of liquidwater above 100 °C un- der pressure.PressurizedoperationofelevatedtemperaturePEWE seems to benecessary toprovideenough liquidwaterandretain membraneconductivity.Leeetal.furtherarguethattheimproved supply of liquid water under pressure to the catalyst layer and fewer bubbles increasesthe numberof activesites and, thus,re- duceskinetic overpotentials [17].However, an overpotentialcom- parison to lower temperature PEWE or a detailed loss contribu- tion breakdown isneededto understand theoriginof thediffer- ence. Suermann et al.showedan overpotentialanalysis foroper- ating temperatures from 30to 70 °C inPEWE [6].Despite these studies,therearestillconsiderableinconsistenciesintheliterature abouttheunderstandingoflosscontributionswithrespecttoele- vatedtemperatureoperation,especiallyabove80°C.
HydrogenpermeationinPEWEisamajorsafetyissuethatcan lead toexplosive hydrogen-oxygen gasmixtures. Elevatedoperat- ing temperaturesandtheuseofthinmembranespromotehydro- gen permeation. Trinke et al. found that an increase from30 to 80°Cat1Acm−2 increasesthehydrogenpermeationbya factor of2[20].Inourrecentstudyweinvestigated thinmembranes in PEWE under differential pressures at 60 °C [21]. PEWEoperabil- ityisfoundtobelimitedtohighcurrentdensitiesatelevateddif- ferentialpressures.However,gaspermeationhasnotbeeninvesti- gated attemperaturesabove80°C andwiththecombineduseof thinmembranes.
In order to fulfil the above-mentioned efficiency and hydro- gen cost goals in PEWEby hightemperature operation and thin membraneuse,abenchmarkattemperaturesabove100°Cwould be helpful to estimate possible benefits. Furthermore, an under- standingofthecontributionofthedifferentlosstermsisrequired to identifyfurther development needs. Investigation ofhydrogen
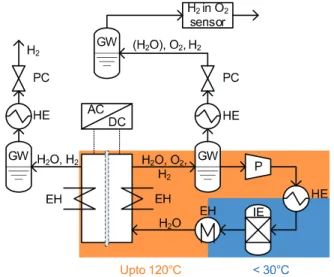
Fig. 1. Two-temperature level PEWE test setup for elevated temperature operation of up to 120 °C (EH = electrical heater, GW = gas-water separator, HE = heat ex- changer, IE = ion exchanger, P = pump, PC = pressure controller). Cf. main text for a detailed description of the working principle.
gaspermeationisnecessarytoensuresafetystandardsanddeter- mine the faradaic efficiency. Finally, an overall efficiency assess- ment needs to be conducted to evaluate the profitability of ele- vatedtemperatureoperationinPEWE.
In this study, we investigated a PEWE using commercial cell componentsatelevated temperatures(60 to120°C)todetermine cell efficiencies andcell overpotentials by galvanostatic polariza- tion curves. Hydrogen gas crossover was determined by a ther- malconductivity analyzer.The study aimsto fill gapsin the un- derstandingofhightemperatureliquidPEWElosscontributions.It providesapossiblepathwayforfurtherdevelopmentofPEWEma- terialsandcomponents forincreasedefficiencyandlowercost of greenhydrogenproduction.
2. Experimental
2.1. Electrolysistest-station
Experiments were performed with a home-built electrolysis testbenchcomprisingananodeandcathodegas/waterloop(Fig.1).
PTFEtubeswereusedtoemitaminimumofions.Deionizedwater (18.2 MOhm cm) waspumped into the anode gas/water separa- torandthewaterlevel waskeptconstant viaa levelsensor dur- ing experiments. The water was circulated(1200 mL min−1) us- ingagearpump(ISMATEC,REGLO-ZSDigital)intoaplateheatex- changer(Alfa Laval,AlfaNova14–10H) cooling downthe waterto atemperature ofabout30°C.Arelatively highwaterflowrateof 1200 ml min waschosen to keep the temperature gradient over thecell ataminimum.An ionexchange resin(BWT, max.opera- tiontemperatureof50°C)wasplacedinlinetoensurethepurity of the water. From there the water was fed via a fluoropolymer inlineheater (Process Technology,TIH3) into thecell. All experi- mentswereperformedatabalancedpressureof3baraappliedby a pressureregulationsystem(Bronkhorst) locateddownstream of thegaswaterseparators.Condensedwaterwastrappedinan in- linegas/waterseparatorontheanodeside afterthepressurereg- ulation.The content ofH2 inO2 wasmeasured atthe gasoutlet using an Eaton K1550gas analyzer (calibrated inO2, 0.1% H2 in O2, 1% H2 in O2, 2% H2 in O2). The electro-osmotically dragged water was discarded periodically from the cathodic gas-water separator.
Thewaterandcellhousingtemperaturesweremeasuredusing Pt100 flexible resistance thermometers (Electronic Sensor GmbH, Pt100A 10/25). The watertemperaturewasmeasured attheinlet and outletof the cell withthermometers inserted intoSwagelok fittings(ElectronicSensors,SW-Druck-Pt100A-M6).Thecellhous- ing temperature wasmeasured in a holedrilled into the current collector directly behind the flow fields of anode and cathode.
The inlet water temperature was controlled by the inlet of the cell.Thecellhousingtemperatureoneachelectrodesidewascon- trolledseparatelywithtwoheatingcartridgesinsertedintotheend platesofanodeandcathode.Amulti-zonetemperaturecontroller (Elotech, R2400S)wasused to regulatethe waterheater andthe cartridges.
2.2. Electrolysiscell
A PEWEsingle cellwith an active area of 25cm2 comprising a titanium parallel flow field (FF) on both sides wasused to ac- commodateacommercialsinteredtitaniumporoustransportlayer (PTL,Sika T10,GKN SinterMetalFilters) of1mm thicknessfrom GKNontheanode.Acarbongasdiffusionlayer(GDL,2050A-6060, SPECTRACARB) of 1.5mm thicknesswas used on the cathode.A catalystcoatedmembrane(CCM)within-housespray-coatedcata- lyst layerswassandwichedbetweenanodeandcathode.Theend- platesofthecellweretightenedwithatorqueof15Nmgivingan averagecompressiveforceofabout2MPa.
2.3. Preparationofcatalystcoatedmembrane
NafionR N117 andNR212 membranes (Ion Power) were used in thisstudy.In ordertoremove impurities,NafionR membranes were pretreatedin32.5%nitricacidat90°Cfor1handthenim- mersed three times in deionized water at90 °C for 1 h. Before spraying, membranes were left to dry in air. The anode catalyst ink waspreparedby mixing0.85 mLisopropanol, 2.70 mL miliQ water, 2.54mL Nafion Solution (Ion Power D521, 5w% NafionR) and 1 g of IrO2/TiO2 catalyst (ElystIr75 0480,Umicore). Forthe cathodecatalystink0.070gPt/Ccatalyst(TEC10E50E,TanakaKik- inzoku Kogyo),1.16mLethanol,0.71mLmiliQwaterand0.66mL Nafion solution(IonPower D521,NafionR) weremixed.Bothcat- alystinkmixturesweresonicatedfor30min.FortheCCMprepa- ration an automatic spraycoating machine (Sonotek,ExactaCoat) with an ultrasonic nozzle wasused. The inks were filled into a syringe containinga magnetic stirrer.The membranes were fixed inpolyoxymethyleneframesandplacedona 50°Chot plate.The inks were sprayed onto themembranes withan ink flowrate of 0.05 mlmin–1, anozzle height of10 mm anda nozzle speed of 80 mm s–1. Inorder to achieve the desiredloadings, a PTFE ref- erence sheet wassprayed in parallel to every sprayed layer, and the loadingwascheckedperiodically.The CCMsweredried inair for24 handsubsequently weighed.The ink-sprayingpreparation methodyieldedanodeloadings of2.0±0.1mgIr cm−2 andcath- ode loadings of0.4± 0.05mgPt cm−2. Thecellswere assembled withthe CCMsina wetstateafter immersioninmiliQ waterfor 12h.
2.4. Celltests
TwoPEWEcellswere equippedwitha N117membraneanda NR212membrane.ExperimentswereperformedusingaSP-150po- tentiostatandaVMP3B80AboosterfromBiologic.Cellswerecon- ditioned at60°Cby holdingthe currentdensityat2 Acm−2 for 48 horuntilthevoltagevaried lessthan1% perhour.After hav- ing reached, the desiredtemperaturethecurrentdensitywasset to2Acm−2for2h.Priortopolarizationcurvemeasurements,the current density washeld at 0.008 A cm−2 for15 min to ensure
astablecell potentialandtemperature. Afterreachingthedesired temperature,temperaturecontrolofthecellwassuspendedforthe time of polarization curve measurement and heatingpower was maintained. The polarization curves were measured by galvanos- tatic current density steps from 0.008to 0.010 A cm−2 in0.001 Acm−2 steps,from0.010to0.120Acm−2 in0.010Acm−2 steps, from0.150to0.250 Acm−2 in0.050 Acm−2 steps, andfrom0.5 to3.0Acm−2in0.25Acm−2steps.Eachcurrentdensitystepwas heldfor10sbeforerecordingthecellvoltage.Ateachcurrentden- sity,5galvanostaticelectrochemicalimpedancepointswithanAC frequencyof10kHzandanamplitudeof0.1Acm−2wasrecorded todeterminethehighfrequencyresistance(HFR).
The electrical resistance of the cell setup and the cabling Rel wasdetermined accordingtoSchuleretal.by assemblingthecell withouttheCCMandmeasuringthevoltageresponseatacurrent of 1, 2, 3, and 4 A [22]. Hydrogen gas crossover measurements were performed at five galvanostatic steps between 2.0 A cm−2 and3.0Acm−2.Lowcurrentdensitieswere omittedtoavoidthe riskofexplosivegasmixturesontheanodeside.Thecurrentden- sitieswereappliedfor30minandthehydrogencontentinoxygen wasaveragedoverthelast5min.
3. Theoryandcalculations
Theelectricefficiencyofaliquid-waterfedPEWEcell
ε
HHV can be quantified based on the energy (HR(T,p)>0) with T the temperatureand pthepressure neededtosplit liquidwateralso called the higher heatingvalue (HHV), andthe electrical energy neededtopowerthecellEcell:ε
HHV =HR
(
T,p)
2FEcell (1)
withF theFaradayconstant.Intheliteraturealsothelowerheat- ingvalue (LHV),theenergytosplitwatervapor,isusedto calcu- latetheefficiency,becauseitallowsabetterevaluationoftheover- allprocess chainofhydrogenincomparisonwithother hydrogen productionprocesses[8].However, sinceinthisreportwe specif- icallyrefertothesplittingofliquidwateritseemsappropriate to usetheHHV.
As soon as a current is applied to the cell, the cell voltage increases due to loss mechanisms. The voltage loss terms are summedupinthefollowingequationasafunctionofthecurrent density j:
Ecell
(
j)
=Erev+η
iR(
j)
+η
kin(
j)
+η
rest(
j)
(2)whereErev isthereversiblecellvoltage,
η
iR theohmicoverpoten- tial,η
kinthe kinetic overpotential, andη
rest the overpotential at- tributedtoremaininglosses.The reversible cell voltage can be calculated according to the Nernstequation:
Erev
(
T)
=Erev0(
T)
+RT 2F lnaO2
(
T)
·aH2(
T)
(3)
withE0rev(T)thetemperaturedependentthermodynamiccellvolt- age,Rtheuniversalgasconstant,aO2 theactivityofO2 inthean- ode compartment andaH2theactivity ofH2 in the cathodecom- partment.The reversible cell voltage is plottedin Figure S2 as a functionoftemperatureintherangeused inthiswork. Itcan be seen that the potential is reduced by about 70 mV when going from60to120°C.
Thelossterm
η
iRconsiderstheohmicoverpotentialsinthecell thatcanbedeterminedbyhighfrequencyresistance(HFR)[22]:η
iR(
j)
=j·HFR= j(
Rmem+Rel+Rint)
(4)withRmem the resistance of the membrane, Rel the electrical re- sistance ofthe celland thecabling,Rint the interfacialresistance
betweentheCCMandthediffusionmediaaswellasthediffusion mediaandtheflowfieldplate.TheiR-freecellvoltageisobtained bysubtractionoftheohmicoverpotentialsfromthecellvoltage.At lowcurrentdensities(<120mAcm−2),masstransportoverpoten- tialscanbeneglectedandtheiR-freecellvoltageshowsaTafelbe- havior[6,23]. Thekinetic overpotential
η
kin describesthe voltage lossduetothechargetransferreactionattheelectrode-electrolyte interface.η
kin isdeterminedbysubtractingthereversiblecellvolt- agefromtheiR-freecellvoltageandextrapolatingtheTafellinein thelowcurrentdensityregime(30– 120mAcm−2).η
kin(
j)
=b·log(
j)
−b·log(
j0)
=a+b·log(
j)
(5)where j0 [Acm−geo2]istheapparent(i.e.,geometric)exchangecur- rentdensity,a theinterceptat1A cm−2 andb=2.3α··RF·T the Tafel slopewith
α
thetransfercoefficient.Inthecaseofwaterelectrol-ysis, j0 ismuchlower fortheoxygen evolutionreaction(OER)on theanodecatalystthanforthehydrogenevolutionreaction(HER) on the cathode catalyst. Therefore, the cathode overpotential is usually neglected.The temperaturedependenceof j0 isdescribed byanArrheniusexpression:
j0=rf·j0∗·10
−2E.3A·R
(
1T−T1∗)
(6)where rf [cm2real·cm−geo2]is the roughnessfactorof theelectrode, j∗0 [Acm−real2]is thespecific exchangecurrentdensity(interms of A cm–2 ofcatalyst surfacearea) atthe reference temperatureT∗, andEAtheapparentenergyofactivation[24,25]Theapparentex- change current density j0 at the reversible cell voltage is deter- minedbytheinterceptoftheTafellineatzerooverpotential.How- ever, theextrapolation overseveraldecades incurrentdensityto determinej0leadstolargeerrors.Berntetal.proposedtobench- marktheactivityofOERcatalystsinPEWEatan iR-freecellvolt- ageof1.45V[23].However,inordertocomparecatalystactivityat differenttemperaturesitisnecessarytoaccountforthechangein the reversiblevoltage.Therefore,we proposeto comparethecat- alystactivity inthisstudyascurrentdensityata kinetic overpo- tentialof0.26V(jη
kin=0.26V).Theapparentenergyofactivationat akineticoverpotentialof0.26V,EηAkin=0.26V,canbeobtainedfrom anArrheniusplotof jη
kin=0.26Vandthetemperature.Fordetailson thederivationofEAηkin seetheSI.
The remaining overpotentials
η
rest after subtraction of the above-mentioned lossterms (η
iR andη
kin)fromthe cellpotential Ecellcanbeattributedtothefluidtransportlimitations,tothecat- alytically activesites aswell asthe protontransport throughthe anodeandcathodecatalyst layers.The originandthemajor con- tributionstotheremainingoverpotentialsinPEWEarenotyetwell understood[22].The faradaicefficiencyisthefractionofthecharge inan elec- trochemical process that is goinginto thedesired reaction(here:
hydrogen evolution). Water electrolysis constitutes the two half- cell reactions HER and OER, yet the oxygen product is of minor importance inmostcases.Wecanthereforewrite thefaradaicef- ficiencyasfollows:
ε
HF2=N˙Hout2 j 2F
=1−N˙Hperm
2 j 2F
−2N˙Operm
2 j 2F
(7)
withN˙Hout
2 thehydrogengasflowattheoutletand 2jF thehydrogen production rate(in mol/s). Usinga Pt basedcatalyst atthe cath- ode the content ofoxygen in theproduced hydrogen can be ne- glected[26].Assumingaleak-tightsystem,hydrogenlossoccursby the permeation throughthe membraneN˙Hperm
2 andby catalytic or electrochemicalreactionofhydrogenandpermeatedoxygenN˙Operm onthecathodecatalyst[26,27].The rateofhydrogenpermeation2
through themembranecan becalculatedfromtherateofoxygen
production 4jF andthecontentofhydrogenintheoxygenproduct streamXH2inO2:
N˙H2perm=
j
4F ·XH2inO2
1−XH2inO2 (8)
Thehydrogenpermeationincreaseslinearlywithcathodepres- surepc,andtemperaturedependencefollowsanArrheniusbehav- iorwithan activationenergyofEA =20kJ mol−1 forwetNafion [20,28]:
N˙Hperm
2 =KHTre f
2exp
EA R 1Tre f −1 T
pct (9)
withKHTre f
2 themembrane specific permeabilitycoefficient for hy- drogen atthereferencetemperatureTre f=353K,Ea thematerial specificactivationenergyandtthemembranethickness.Theloss ofhydrogenthroughreaction withoxygen onthecathodecan be estimated by assuming a 2 fold lower oxygen permeation N˙Operm
2
thanhydrogenpermeationN˙Hperm
2 [28,29].Bymultiplicationofthe faradaic efficiency
ε
FH2 with the electric efficiencyε
HHV the total hydrogenproductionefficiencyε
totH2 canbecalculated:ε
totH2 =ε
HF2·ε
HHV (10) 4. Results&discussionThe polarization curves of an electrolysis cell with a Nafion N117 (N117) and a Nafion NR212 (NR212) membrane were mea- sured ata temperature rangingfrom 60to 120 °C (Fig.2). With increasing current density, the cell voltage increases due to the currentdependentoverpotentials.Anincreaseintemperatureflat- tens theslope of thepolarization curve and lowersthe polariza- tion curve, while the use of a thinner membrane only flattens the curve. The change incell voltage decreases for each temper- aturestep, yetthe change islesspronounced than wouldbe ex- pected from an Arrhenius process. The cell voltage of 1.97 V at a currentdensity of2 A cm−2 for N117 at80 °C operatingtem- peratureisattheupperendofvoltagesreportedintheliterature (1.80– 2.01V,SupplementaryInformation,FigureS7)[30–33].The cell voltage at a current density of 2 A cm−2 for NR212 at 120
°C inour study isabout 120 mV higherthan thecell voltage of Leeetal.,who operatedaPEWEcell withaNR212membraneat 2.5bara [17]. Thismight be due to thehigh electrical resistance Rel=65Ohmcm-2ofthePEWEcellusedinthisstudy(discussed innextsection).Theimpactofabalancedoperatingpressureof3 baracanbeconsideredasnegligibleonthecellperformance [34]. Inthefollowing,we willanalyzehowtheoverpotentialcontribu- tionsaffectthecellvoltageatdifferenttemperatures(60°C– 120
°C)and membranethicknesses and compare theseresults to the literature.
4.1. Ohmicoverpotential
According toEq.(4) thearea resistance ofan electrolysis cell, whichisgivenbytheHFR,isthesumofthemembraneresistance, the electronic resistance andthe contactresistance betweencat- alyst layer andPTL and betweenPTL andflow field plate. Fig. 3 showsthe HFR (area resistance) plottedagainst the currentden- sity for different temperatures and membrane thicknesses. With increasing cell temperature and decreasing membrane thickness, thearea resistance isdecreasing.It isknown that themembrane resistance accounts for the largest share of the total area resis- tance[2].Thearearesistanceofthemembraneisinverselypropor- tionalto its conductivity. Fora polymerelectrolyte membrane,it followsanArrheniustypebehavior[35].FigureS4displaystherel- ativeHFR(HFRnormalizedtothefirstdatapoint)asafunctionof
Fig. 2. Polarization curves for one Nafion N117 ((a), filled symbols) and one Nafion NR212 ((b), hollow symbols) PEWE cell at 60 °C (black), 80 °C (blue), 100 °C (green) and 120 °C (orange) at a balanced pressure of 3 bar a. The error bars represent the standard deviation of 5 measured voltage points. (For interpretation of the references to colour in this figure legend, the reader is referred to the web version of this article.)
Fig. 3. High frequency resistance (HFR) as a function of current density for a Nafion N117 (filled symbols) and a Nafion NR212 (hollow symbols) PEWE cell at 60 °C (black), 80 °C (blue), 100 °C (green) and 120 °C (orange) at a pressure of 3 bar a. The error bars represent the standard deviation of 5 measured HFR points. (For interpretation of the references to colour in this figure legend, the reader is referred to the web version of this article.)
thecurrentdensity.WithhighercurrentdensitytheHFRdecreases becausemoreJouleheatisgeneratedand,thus,theCCMbecomes hotter.Atverylowcurrentdensitiesandbelowthethermoneutral voltage (1.47– 1.48 Vintheconsidered temperaturerange),heat isabsorbedbythecell.ThedecreaseoftherelativeHFRwithcur- rentdensitybecomeslowerwithhighertemperature.Theobserved trend could be explained by the following points. First, the cell voltage and the overpotential contributions are decreasing with highertemperatureandthereforelessJouleheatisproduced. For N117 the cell voltage difference is about380 mV fora tempera- tureincreasefrom60to120°Cat3Acm-2,andforNR212about 170 mV. Second,withincreasing temperaturemore entropicheat isabsorbedtodrivethewaterspittingreaction(T SR,FigureS1), which accountsfor40mVfora temperatureincreasefrom60to 120 °C. The produced waste heat istherefore used to powerthe reaction.ThiscanalsobeseeninFigureS5,wheretheelectriceffi- ciencyexceeds100%forlowcurrentdensitiesat120°C.Third,the highertemperaturegradienttothesurroundingsresultsinalarger release of heat to the environment. At low currentdensities the PEWE operatingconditionscan therefore beconsidered asquasi- isothermal[22].
The cellHFR with N117decreases by 45% andwithNR212 by 25% ata currentdensityof 8mA cm−2 betweena cell tempera- tureof60°C and120 °C (Fig.4).The calculatedmembraneresis- tanceforNafiondecreasesby45%inatemperaturerangebetween 60 °C and120 °C according to an empirical formula of Kopitzke etal.withanactivationenergyof7.8kJmol−1[35].Assumingthat the membrane resistance is the only significant temperaturede- pendent contribution to the total area resistance asproposed in reference[22],thedecreaseinmembraneresistancewithtemper- atureisexpectedtobe higherthantheoneofthetotalohmicre- sistance. The larger the contributionof the membrane resistance to the total ohmic resistance, the highershould be the total de- crease in area resistance. As expected, our data reveals a higher decrease forthe N117 cell thanfor the NR212cell. However, the decrease for the N117 cell is 39 mOhm cm2 higher and for the NR212 cell 15 mOhm cm2 higher than the decrease of the cal- culatedmembraneresistance.Thiswouldimplya decreaseofthe non-membraneohmiccontributionswithtemperatureaswell.Fur- ther,itisinterestingthatthedecreaseis24mOhmcm2higherfor theN117cellthanfortheonewithNR212.Adeeperunderstanding ofthesefindingscanbegivenbylookingintotheohmiccontribu- tions.
Two approaches are found in the literature to determine the ohmiccontributions totheHFR.Suermann etal.performalinear fitoftheHFRfortwomembranethicknessesfordifferenttempera- turesandproposethattheinterceptrepresentstheelectronicarea resistance of thecell setup [6]. Schuler et al.experimentally de- terminedtheelectricalresistanceofthecellsetupwithoutaCCM to determine an electrical cell setup resistance [22]. It is argued that pureohmic resistances ofmetal andalloyshavea negligible temperaturecoefficientin therangeof10−3 °C−1.Further, acon- ductivity value taken fromthe literature is used to calculate the membraneresistance. In Fig.4 both methods are applied forthe twocellsusedinthisstudy.
The extrapolated HFR values of Fig. 4a using the method of Suermannetal.showa decreaseinthenon-membraneresistance from118to100mOhmcm2byincreasingthetemperaturefrom60 to120°C[6].Sincetheelectricalresistancecanbeconsideredcon- stantoverourtemperaturerange,theinterfacialresistancewould decrease by 18 mOhm cm2 between 60 and 120 °C. This value lies between the non-membrane resistances found earlier. How- ever, using this approach both cells would have the same non- membrane resistancefor the fourmeasured temperatures, which isunlikelywhencomparingthedifferencesintotalarearesistance decreasewithtemperature.
Fig. 4. (a) High frequency resistance (HFR) as a function of the membrane thickness for a Nafion N117 (N117) and a Nafion NR212 (NR212) PEWE cell at 60 °C (black), 80 °C (blue), 100 °C (green) and 120 °C (orange) at a pressure of 3 bar a. The lines represent a linear fit. (b) Ohmic contribution split into interface, membrane, and electrical resistance for a Nafion N117 and a Nafion NR212 PEWE cell at 60 °C, 80
°C, 100 °C and 120 °C at a pressure of 3 bar a. (For interpretation of the references to colour in this figure legend, the reader is referred to the web version of this article.)
Fig.4bshowstheohmicresistancecontributionscalculatedac- cording to the approach of Schuler et al. [22]. The electrical re- sistanceRel correspondstotheexperimentallydeterminedelectri- cal cell setup resistance.The membraneresistance Rmem wascal- culated usingthe empirical approach ofKopitzke et al.[35].The interfacialresistanceRint correspondstothedifferenceoftheHFR and the latter resistances (Rmem and Rel). The membrane contri- bution to the HFR decreases with higher temperatureand lower membrane thickness, asalready seen from Fig. 3. The interfacial resistance decreases by 44%forthetwo cellsover a temperature rangefrom60to120°C.Forbothcellsitcanbeobservedthatthe decrease ininterfacialresistance from60to 120°C becomesless foreachtemperaturestep.However,theabsolutedecreaseinHFR ishigherforN117thanforNR212.AccordingtoFig.4b,thediffer- encesinthedecreaseintheHFRbetweenN117andNR212mustbe relatedtoadifferenceinthedecreaseoftheinterfacialresistance.
Asalreadymentionedabovetheinterfacialresistanceiscomposed of thecontactresistance betweenthetwo porousmedia andthe catalyst layerandthecontactresistance betweenthe porousme- dia andtheFF plates.Achangein theinterfacialresistancemust therefore be associated to a structuralchange of the used mate- rial. Babicetal., usingthe samecell setupasinthisstudy,found no change inohmic overpotentialover a celloperation period of 300hatconstantcurrentapplyingatemperatureof60°C[36].A
decreaseininterfacialresistancebecauseofalossofcontactresis- tanceovertimeisthereforeratherunlikely.Thedropininterfacial resistancecanthereforeberelatedtoanincreaseinoperatingtem- perature.A higherpassivationrateof titaniumatthe FFand PTL surfacewasobservedtoappearatelevatedtemperatures[37],but thiswouldincreasetheinterfacialresistances[38] andcanthere- forebeexcluded.Reductionoftheinterfacialresistancewasfound to be triggered by optimized catalyst loading oruse of a micro- porouslayer (MPL)ontop ofthe PTL thatwouldincrease the CL utilization [22, 39-41]. We provide the following possible expla- nationforthedecreaseininterfacialresistancewithtemperature:
Increasedswelling ofthe membranewithincreasing temperature wouldincrease thecompression ofthecatalyst layertowards the PTL[42].Hinatsuetal.findanincreaseinwateruptakeby60%for N117membranesimmersedinwaterbyincreasingthewatertem- peraturefrom60to120°C[43].Thiswouldincreasethepressure ontheCL towardsthe PTLanddecreaseelectrical resistances be- tweenCL andPTL by fillingupthevoidvolume betweenthe PTL particles[44].Sincea thickermembraneswellsmorethanathin- nermembraneinabsoluteterms,itwouldexplain thehigherde- creaseininterfacialresistancefortheN117cellatelevatedtemper- atures.The decrease inthevalue of thevariableresistances with temperaturebecomeslesspronouncedthehigherthetemperature.
Thelowerdecreaseinvoltageinthepolarizationcurves(Fig.2)for eachtemperaturestepisconsistentwiththisexplanation.
4.2. Kineticoverpotential
The iR-freecell voltageis plottedasa functionof thecurrent densityinasemi-logarithmicplot(Fig.5a). Informationaboutthe electrochemical activity of the catalyst is obtained as a current densityatakineticoverpotentialof0.26V jη
kin=0.26V(Fig.5band Fig.5c).AcombinedArrheniusanalysisforbothmembranesyields an apparent activation energy of EAηkin=0.26V=59±15 kJmol−1 in the temperature range from 60 to 120 °C, and EηAkin=0.26V= 19±10 kJmol−1 in the temperature range from 80 to 120 °C.
From the literature, values extracted from polarization data at a kinetic overpotentialof 0.26 V show EAηkin=0.26V=70 kJmol−1 [45]andEAηkin=0.26V=47 ±5kJmol−1[24]inatemperaturerange between30and70°C.From thedataof Schuleretal.avalue of EAηkin=0.26V=15 ±3kJmol−1isfoundbetween70and80°C[25]. Inourdata,thereisanotabledeviationfromtheArrheniustrend- linebetween 60and 120°C. A hypothesis forthe jump from60 to80°C in jη
kin=0.26V couldbe an activationprocess oftheCCM whenincreasingthetemperature.Thiseffecthasalreadybeenob- servedinPEFCswhereelevatedtemperatureoperation(90°C)was reported to increase catalyst activation by increasing the utiliza- tionofthecatalyst[46,47],forexamplebytheopeningofblocked catalystsites,hydrationof Nafionnear thesecatalystsites,ores- tablishingofanionicorelectronicpathwaytothesesites[46,47].
Possibly,the increasedoperating temperatureresults ina change oftheroughnessfactor/catalystutilization(cf. Eq.(6)). jη
kin=0.26V
showsavalue that isconsistentlyhigherby a factorof2.0±0.4 forthe cell with N117 compared to theone withNR212 .As an explanation we propose the above-mentioned more pronounced swellingofN117inabsolutetermsduetoincreasedwateruptake atelevatedtemperature.Itwasfoundthathighercellcompression reducesthekineticoverpotentialsignificantly[44].Catalystutiliza- tion could be higherdueto higher compressionbetweenCL and PTL.
4.3. Remainingoverpotentials
Highattentionhasbeendevotedrecentlytowardstheinvestiga- tionoftheremainingvoltagelossesinPEWEandtheimpactofcell
Fig. 5. IR-free cell voltage (a) and kinetic overpotential (b) as a function of current density for a Nafion N117 (filled symbols) and a Nafion NR212 (hollow symbols) PEWE cell at 60 °C (black), 80 °C (blue), 100 °C (green) and 120 °C (orange) at a pressure of 3 bar a. (c) Natural logarithm of the current density at a kinetic overpo- tential of 0.26 V as a function of temperature for a Nafion N117 (black filled squares) and a Nafion NR212 (blue hollow circles) PEWE cell between 60 and 120 °C. (For in- terpretation of the references to colour in this figure legend, the reader is referred to the web version of this article.)
components anddegradation parametersontheir behavior [6,17, 22, 23, 40, 48–50].Theywere reportedto rangebetween20and 250mVatacurrentdensityof3Acm−2.Thelargespreadinthe datacould beexplainedbylossesthatvarysubstantially between the differentPEWEcellsused intheexperiments.The analysisof ourdataatdifferenttemperaturesyieldsremainingoverpotentials
η
rest intherangebetween20mVand35mVat3Acm−2 except for N117 at 120 °C (Fig. 6), which agrees well with most of the literature[17,23,40,49,50].Afewexperimentalreportsaredealingwiththeimpactoftem- perature onthe remaining losses[6,40,51]. Suermann etal.ob- serve a decreaseof remaining losseswithincreasing PEWEoper- ating temperaturefrom30to 70°C[6].It isargued that thede-
creasecould be causedby a flattening of the iR-freecell voltage atlower temperaturesandthereforerepresentsanartefact ofthe overpotentialbreakdown analysis.Leeetal.saw adecreaseofre- mainingoverpotentialfrom60°Cto80°Cby 45mVatacurrent densityof3Acm−2 [51].The decreasewasexplainedbya lower andrelatively uniform gas saturation anda lower dissolved oxy- genconcentrationneartheCL-PTLinterface.Asalreadymentioned above,remainingvoltagelossescomprisetwolossmechanismsof different nature: the proton resistance in the catalyst layers and masstransport lossesattributedto thefluid transport limitations tothecatalyticallyactivesites[23,40,48].Protonresistanceinthe cathodecatalystlayercan beassumedtobe verylow(< 7mVat 3V)[23].TheprotonresistanceintheanodeCLwasfoundtode- creasewithhighercelltemperaturesimilartotheionicresistance ofthe membrane[40].The resulting protontransport overpoten- tialincreaseslinearlywiththecurrentdensitybecauseitdisplays anohmic behavior.Fluidtransportlossesincrease withincreasing currentdensity becauseof a higherrate ofoxygen gas evolution [6].Oxygen bubbles could block the catalystactive sites.The in- creaseofwatervaporpressure(FigureS3)resultsina37%higher volumetricgasproductionrateat100°Canda69%increasedpro- duction rate at 120 °C in comparison to the cell operated at 60
°C.Theoxygenbubblescouldhinderwatertransporttotheactive sitesof thecatalyst layerresulting ina higher
η
mtx [52,53]. The contrarydependence on thetemperature ofthe proton transport resistanceandthefluidtransportlimitationcouldbea reasonfor itsmissingdependenceofη
mtxonthetemperaturebetween60°C and100°CinFig.6.Thefactthatforbothmembranesη
mtxishigh- estat120°Csuggeststhattheblockageofactivesitesbyproduct gasmightbethedominantlimitationatthistemperature.4.4. Gaspermeation
Fig. 7a and 7b shows the impact of temperature on the hy- drogen content in oxygen in the anode cell compartment for a PEWE cell assembly using a thick membrane (N117) and a thin membrane(NR212)atdifferentcurrentdensities.The datashows a lower hydrogen content withincreasing currentdensityas the rate of the oxygen production is higher [21]. Our results are in agreement with literature data for a cell operated at 80 °C, us- ingacathodicpressureof7baraandaN117membrane[27].Hy- drogenpermeationisalsoacellspecificparameteranddeviations couldbeduetoclampingpressuredifferencesthataffectthecom- pression of the carbonGDL and in consequencethe GDL-CL in- terface[54]. The behavior ofthe hydrogen content in oxygen on the anodecan be directly derived fromthe hydrogen permeabil- ity through the membrane (Fig. 7c and 7d) via Eq. (9). The hy- drogen permeationincreasesasthecurrentdensityincreases[20, 27].Anincreaseintemperatureandadecreaseinmembranethick- nessresultsinahigherhydrogenpermeationandinanincreasein theslopeofthehydrogenpermeation curve.Thesametrendwas observed by Trinke et al.in a temperature range between30 °C and80°C[20].Bylinearregressionofthe datapointsatagiven temperature the permeation at OCV was obtained by extrapola- tion [55]. The empty symbols at the ordinate represent the cal- culatedpermeabilityassuming permeabilitycoefficientsforNafion fromreference[28]andusingEq.(9).Forthethickmembranethe calculatedvaluesare lower thanthe intersectionofthefit ofthe experimentaldata,andforthethinmembranethecalculatedval- uesarehigherthantheexperimentaldata.Thedeviationfromthe experimentaldatacouldbeexplainedbytheerrorfromtheextrap- olationoveralargecurrentdensityrangeandanon-linearrelation ofthehydrogenpermeationwiththecurrentdensity[54].
Assuming a safetylimit of a concentration of 2% hydrogen in oxygen,theapplicablelowercurrentdensitylimitforathickmem- braneat60°Ctemperaturesignificantlyincreasesfrom0.36Acm-2
Fig. 6. Remaining overpotential as a function of current density for a Nafion N117 (a) and a NR212 (b) PEWE cell at 60 °C (black), 80 °C (blue), 100 °C (green) and 120 °C (orange) at a pressure of 3 bar a. The error bars represent the standard deviation of 5 measured voltage points. (For interpretation of the references to colour in this figure legend, the reader is referred to the web version of this article.)
Fig. 7. (a-b) Content of hydrogen in oxygen on the anode at 3 bar abalanced pressure as a function of the current density and (c-d) hydrogen permeation flux (left axis) / current (right axis) through the polymer electrolyte as a function of the current density, for a Nafion N117 (filled symbols) and a Nafion NR212 (hollow symbols) PEWE cell between 60 °C and 120 °C. The red crosses display literature values for a N117 PEWE cell at 80 °C and 7 bar abalanced pressure. The lines and dashed lines on all plots represent a fit retrieved from the hydrogen permeation flux for N117 and NR212, respectively. The stars at the ordinate show the calculated H 2permeation using Eq. (9) . The error bars represent the standard deviation for the hydrogen in oxygen fraction over the last 5 min of a 30 min current hold time. (For interpretation of the references to colour in this figure legend, the reader is referred to the web version of this article.)
to0.62Acm−2at120°C,andwhenadditionallyusingathinmem- braneto0.76Acm−2.
The faradaicefficiency forthe N117andNR212 cellsatdiffer- ent temperaturesandcurrentdensitiesis showninFig.8.Forall measuredtemperatures,theefficiencyliesabove98%foracurrent densityhigherthan1Acm−2.Onlyforcurrentdensitiesbelow0.1 Acm−2itdecreasesbelow90%.Normallycellsarenotoperatedat
theselow currentdensities duetosafetyissues,asmentioned in theprevioussection.Membranethicknessandtemperaturehavea minorimpactonthefaradaicefficiency:atacurrentdensityof2A cm−2,
ε
FH2 isreducedby0.5%comparingathickmembraneat60to athinmembraneat120°C.Athighcurrentdensitiesthehydrogen generationexceedsthehydrogencrossoverbyabouttwoordersof magnitude. At low current densities, thehydrogen permeation isF H2
F H2
i
Fig. 8. Faradaic efficiency εFH2of hydrogen production as a function of current den- sity for a Nafion N117 (N117, filled symbols) and a Nafion NR212 (NR212, hollow symbols) PEWE cell at 60 °C (black squares) and 120 °C (orange triangles) at a pres- sure of 3 bar a. Inset: Zoom on a faradaic efficiency between 98% and 100%.
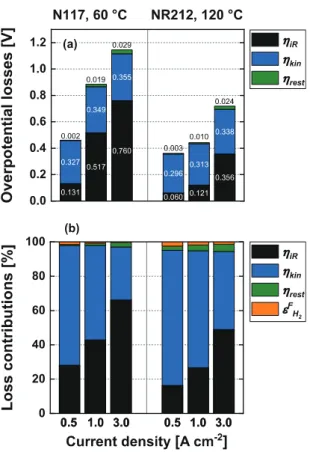
Fig. 9. (a) Ohmic ηiR, kinetic ηkin, and remaining ηrestoverpotentials at 0.5 A cm −2, 1.0 A cm −2and 3.0 A cm −2for a Nafion N117 PEWE cell at 60 °C (left) and a Nafion NR212 PEWE cell at 120 °C (right) at a pressure of 3 bar a. (b) ηiR, ηkin, ηmtxand faradaic loss contributions εFH2 at 0.5 A cm −2, 1.0 A cm −2 and 3.0 A cm −2for a Nafion N117 PEWE cell at 60 °C (left) and a Nafion NR212 PEWE cell at 120 °C (right) at a pressure of 3 bar a.
in thesame orderof magnitudeasthegenerated hydrogen,thus
ε
FH2dropstowardslowcurrentdensities.4.5. Totallosscontributions
Fig.9showstheoverpotentiallosses(Fig.9a)andthecellloss contributions(Fig.9b)usingathickmembraneat60°Candathin membrane at120 °C operating temperature. The major contribu- tions to the cell lossesare theohmic and kinetic lossesforboth cell configurations.Forthethick membraneandlow temperature,
tot HHV
Fig. 10. Total hydrogen production efficiency based on the lower heating value (HHV) efficiency and the faradaic efficiency as a function of current den- sity for a Nafion N117 at 60 °C (filled black squares, today’s state of the art) and a Nafion NR212 at 120 °C triangles PEWE cell at a pressure of 3 bar a, respectively. The pink diamonds represent a Nafion NR212 PEWE cell at 120 °C corrected for cell setup resistance. The golden star shows the DOE voltage target at 1.8 A cm −2[9] .
kineticlosses(55%at1Acm−2,31%at3Acm−2)dominateupto acurrentdensityof1Acm−2.At highercurrentdensities, ohmic losses(43%at1Acm−2,66% at3Acm−2)contributemosttothe celllosses. Forthethinmembraneandhightemperatures,kinetic losses(68% at 1 A cm−2,45% at3 A cm−2) are the most domi- nant losscontribution up to acurrent densityof 3A cm−2 and ohmiclosses(27% at1 Acm−2,49%at3Acm−2)are thesecond highest contribution. Losses due the transport of molecules and protonsareconsolidatedtoremaininglosses.Theremaininglosses andfaradaic lossesonly account fora minor fractionof the loss contributions.Faradaiclossescontributewith>50%onlyinavery lowcurrentdensityregime(<20mAcm–2)forbothcellconfigu- rationsinwhichthecellisnormallynotoperated(seeabove)and becomelowerwithincreasingcurrentdensity(<2%at1Acm−2).
Theremaininglossesarelowerat60°CforaN117(1%at1Acm−2, 3%at3Acm−2)than at120 °C fora NR212(3%at1Acm−2,4%
at3Acm−2).
4.6. Efficiencygain
Fig. 10 shows the total PEWE conversion efficiency plotted againstthecurrentdensityusingN117at60°CandNR212at120
°C.Thetotalconversionefficiency(Eq.(10))isaproductoffaradaic efficiency(Fig.8)andvoltaicefficiency(FigureS5).Atcurrentden- sitiesup to0.1Acm−2 faradaiclossesaredominant.Thetotalef- ficiencyreaches a maximum at about0.2 Acm−2 and decreases afterwards dueto an increase in voltagelossesat highercurrent densities.Atacurrentdensityof1.8Acm−2theefficiencywiththe thick membraneat60 °Cis 72%andwiththe thinmembraneat 120°C85%.ThetargetputforwardinaUSDOEfundedproject(cf.
Introdution)is92%at90°Cwithamembranethicknessof50μm.
Therefore,improvementsareneededonamaterialandcomponent leveltoreachthisgoal.
4.7. Waterheatingconsiderations
Thisworkfocuseson elevatedtemperatureoperationandthin membraneuseon acell level.However, consideringa PEWEsys- temlevel,approximatelytwotimesmorepowerisrequiredforthe feed water heatingto 120 °C than to 60 °C when startingfrom roomtemperature(cf.SupplementaryInformation,Section:“Power requirementforwaterheating”).Theenergytoheatupthewater
couldbesuppliedbythewasteheatthatisgeneratedduringPEWE operation. Currently,PEWEsystemsare cooled inordertoensure aconstanttemperatureatelevatedcurrentdensityoperation[56]. Due to a highervoltaicefficiency atelevated temperatureopera- tion less Jouleheat is generated. The heat generation ofthe cell exceeds the power requiredto heat thefeed waterusinga N117 membrane at60°C atcurrentdensities >0.1 Acm-2 andfor the NR212 membraneat120 °C atcurrentdensities >0.5A cm-2. By adequateengineeringofheatexchangeunitsonasystemlevelthe unusedJouleheatcouldbeusedtopre-heatthefeedwater.
4.8. R&Dneeds
More than 90% of thelosses over theapplicable current den- sityrangearecontributionsfromohmicandkineticoverpotentials (Fig.9). At hightemperatures andwithuse ofa thinmembrane, the ohmic contributionof themembranebecomes lessdominant (Fig.4). Here, the electrical resistancemakes up thelargest frac- tionoftheohmiclosses. Thecellusedforthisworkshowedhigh electrical resistances incomparison tocellsused inother studies [22, 23]. This can be related to the passivation of FFs and PTLs at voltages above 1.5 V that could haveoccurred already during the conditioning [33, 38]. It hasbeen shownthat coating of no- blemetals,e.g.gold,iridiumorplatinum,ontitaniumcellcompo- nentshelpsto improvetheresistance tooxidation [57].The pink line inFig. 10 showsthe totalefficiency fora thinmembrane at 120 °Ccorrected forelectrical ohmic lossesyielding an efficiency of 90% at 1.8A cm−2, which is only 2% short of the 92% target mentioned in the Introduction. However, the use of these mate- rials would also increase CAPEX. It is therefore necessary to in- troduceinexpensivecoatingmaterialswithhighoxidativestability, e.g. conductive nitrides[58].Interfacialresistancecan be reduced andcatalystutilizationenhanced usingmicroporouslayers(MPLs) onthePTLtoreducehighin-planeresistancesbecauseofalackof contactbetweenthecatalystparticles[39,59].Membranedevelop- mentshouldbeaimedattheuseofPFSAmembraneswithhigher conductivitywhilemaintainingmechanicalrobustness.Shortchain PFSAionomers,e.g.Aquivion,showedhigherperformancethanthe long sidechain ionomerNafion duetoa lowerequivalentweight (EW)andthereforeincreasedconductivity[60].Moreover,mechan- ical reinforcement provides resistance against creep and may al- lowafurtherdecreaseofmembranethicknessto30
μ
morbelow[61].This,however,requiresasmoothPTL withsurfaceporosity/ roughness that is much smaller than the thicknessof the mem- brane. The mechanical stress induced by the PTL under the cell clamping force dueto its largeporesize andthelocaldeviations from the nominal thickness leads to creeping of the membrane intothePTLvoidsandthinningoftheCCM[36].Applicationofan MPLshowedalowermechanicalstressandallowedtheuseoful- trathinmembranes(20μm)[39].Theuseofthinmembraneslimits theoperabilityathightemperaturesduetogas(mostlyhydrogen) crossover.Arecombinationcatalystcanbeintroduced,eitherinthe membrane or onother cell components,which reduces the con- tent of hydrogeninthe oxygen productgas via catalyticreaction of hydrogenwithoxygen[21,62].It hasbeenshownthat during PEWEoperationthepressureinthecathodecatalystlayerbecomes significantly higherthaninthecathodeflowfield[20,27].Away to reducehydrogenpermeationwouldbe thereforethe changeof thecathodecatalyststructureby variationofthecatalyst,catalyst supportortheionomer[49].BeyondtheuseofPFSAmembranes, alternative membrane materials with superior trade-off between conductivity and gas permeabilityholds great promise,e.g. radi- ationgraftedorpolyarylenetypemembranes[63,64].
Significant research has beendedicated towards newcatalysts inordertoreducekineticlosses[65].However,iridiumandiridium alloys are still considered to give the best compromise between
highactivityandstability.Itisessentialtomaximizetheutilization of thecatalyst by improvingthe interface between catalyst layer andPTL.IthasbeenshownthatanincreasedcontacttotheCLnot onlydecreasesohmiclossesbutalsoreduceskineticoverpotentials [22,39].
High temperature operation not only increases PEWE perfor- mancebutalsolowersdurability.Frenschetal.showedthatduring 500h constantvoltageoperationthe meanrateofvoltagedegra- dation increased by 2 decades when increasing the temperature from60to 90°C [66]. Itwasreported that especiallymembrane thinningandtitanium passivationare criticalatelevated temper- atures.Thetemperaturedependenceofthedegradationrateofall componentsandtheir combination needs tobe studied indetail, andagingmechanismshavetobeunderstoodto,ontheonehand, projectlifetime ofthe electrolyzer in thefield and, on theother hand,toenablethedevelopmentofnewgenerations ofmaterials.
Ultimately, the efficiency gains at elevated temperature and the concomitant reduction inoperating cost needs to be balanced in a techno-economicanalysisagainst the lifetimeof thecell under applicationconditionsandthe associatedcapitalexpenditureofa stackreplacementintheelectrolyzersystem.
5. Conclusions
Operation at an elevated temperature of 120 °C increases H2 conversionefficiency inPEWEbased onthe higherheatingvalue (HHV)byupto10%,andanadditionalthinmembrane(50μm)use byup to13%comparedtostate-of-the-artPEWEoperatingcondi- tions(60°C,180μmmembrane).Withtheapproachofpushingthe limitsoftheuseofstandardcellmaterials,aconversionefficiency of 90% ata current density of1.8 A•cm–2 seems achievable. The improvementofPEWEefficiencyrequiresanunderstandingofthe relationship between the cell voltage loss mechanisms, the used components and operating conditions. Kinetic and ohmic losses makeupforthemajorityoflossesinPEWEandkineticlossesbe- comethedominantlossmechanismathighoperatingtemperature (120°C)combinedwiththinmembraneuse (50
μ
m). Remainingand faradaic losses are negligibly small.Hence, catalyst research andimprovedcatalystutilizationaswellasapplicationofthinand robustmembranes withlowgas crossovershouldbe inthespot- lightoffurtherresearch anddevelopment.Theunderstandingand quantificationofdegradationandagingphenomenaisessentialto beabletobalancelifetimeofcomponentsandthecellagainstcon- versionefficiencygains.
DeclarationofCompetingInterest
Theauthorsdeclarethattheyhavenoknowncompetingfinan- cialinterestsorpersonalrelationshipsthatcouldhaveappearedto influencetheworkreportedinthispaper.
Creditauthorshipcontributionstatement
SteffenGarbe:Conceptualization,Methodology,Validation,For- mal analysis, Investigation, Writing - original draft, Writing - re- view &editing,Visualization. JonasFutter: Datacuration,Valida- tion, Writing - original draft. ThomasJ. Schmidt: Conceptualiza- tion,Datacuration,Formalanalysis,Writing-originaldraft,Super- vision,Resources.LorenzGubler:Conceptualization,Formalanaly- sis,Resources,Writing -originaldraft, Writing-review&editing, Supervision,Projectadministration,Fundingacquisition.
Acknowledgment
Funding by the Swiss Federal Office of Energy (SFOE, under grantno.SI/501603)isgratefullyacknowledged.