Report No. 43
South Asia Human Development Sector
Strengthening Mathematics Education in Sri Lanka July 2011
Discussion Paper Series
Public Disclosure Authorized Public Disclosure Authorized Public Disclosure Authorized Public Disclosure Authorized
64526
Report No 43
South Asia: Human Development Unit
STRENGTHENING MATHEMATICS EDUCATION IN SRI LANKA
July 2011
Discussion Paper Series
Discussion Papers are published to communicate the results of the World Bank’s work to the development community with the least possible delay. The typescript manuscript of this paper therefore has not been prepared in accordance with the procedures appropriate to the formally edited texts. Some sources cited in the paper may be informal documents that are not readily available.
The findings, interpretations, and conclusions expressed herein do not necessarily reflect the views of the International Bank for Reconstruction and Development / The World Bank and its affiliated organizations, or those of the Executive Directors of the World Bank or the government they represent.
The World Bank does not guarantee the accuracy of the data included in this work. The
boundaries, colors, denominations, and other information shown on any map in this work do not
imply any judgment on the part of the World Bank concerning the legal status of any territory or
the endorsement or acceptance of such boundaries.
Table of Contents
Acknowledgements ... - 1 -
List of acronyms ... - 2 -
Introduction ... - 9 -
Section one: learning achievements in mathematics ... - 10 -
Section two: the national education policy And curriculum reforms ... - 26 -
Section three: mathematics standards ... - 28 -
Section four: mathematics curriculum and teaching strategy ... - 30 -
Section five: pathways to the future... - 39 -
References ... - 44 -
Tables Table 1: Comparison of the NCTM standards and Sri Lankan standards ... - 28 -
Table 2: Primary Content Standards – A Comparison... - 30 -
Table 3: Performance in mathematics at the GCE O/L examination ... - 34 -
Table 4: Percentage of problems on each strand contained in the GCE O/L mathematics paper ... - 36 -
Table 5: Performance of school candidates in combined mathematics at the GCE A/L ... - 37 -
Figures Figure 1: The time trend of learning outcomes of grade 8 students for mathematics, ... - 11 -
Figure 2: The achievement levels in learning outcomes of the urban and rural sectors, grade 8, mathematics, 2005-2008 ... - 12 -
Figure 3: The achievement levels in learning outcomes by School Type, ... - 13 -
Figure 4: The learning outcomes by Sub-skills, grade 8, mathematics, 2005-2008 ... - 14 -
Figure 5: Performance of school candidates at the GCE O/L examination 2002 – 2009 ... - 15 -
Figure 6: Performance of students in mathematics at the GCE O/L examination ... - 17 -
Figure 7: Performance of students in mathematics at the GCE O/L ... - 18 -
Figure 8: Comparison of student performance in mathematics at the GCE O/L examination in
2009 at National and Provincial schools ... - 19 -
Figure 9: The zones with the lowest performance in mathematics at the GCE O/L examination
... - 21 -
Figure 10: Pass rate in Combined Mathematics at the GCE A/L, 2004 – 2009 ... - 22 -
Figure 11: Provincial performance at the GCE A/L examination, Physical Science ... - 23 -
Figure 12: Performance at the GCE A/L examination, Physical Science, by District, 2009 .... - 24 -
Figure 13: Provincial share of students, Physical Science, 2009 ... - 25 -
Figure 14: Performance of O/L Mathematics Teachers ... - 33 -
Authors
Harsha Aturupane (Lead Education Specialist, the World Bank),
Visaka Dissanayake (Consultant),
Romaine Jayewardene (University of Colombo),
Mari Shojo (Education Specialist, the World Bank), and
Upul Sonnadara(University of Colombo),
Team Support
Anita Fernando and Alejandro Welch
- 1 -
Acknowledgements
The authors acknowledge with sincere gratitude the assistance of several World Bank colleagues and Sri Lankan counterparts in the preparation of this study report. In particular, Amit Dar (Education Sector Manager, The World Bank), Michal Rutkowski (Sector Director, Human Development), Diaretou Gaye (Country Director for Sri Lanka and the Maldives), Mr. S.U.
Wijeratne, Additional Secretary, Planning and Performance Review, Ministry of Education, Ms.
Madura Wehella (Director, Policy and Planning, Ministry of Education), Dr. Jayantha Balasuriya (Deputy Director, Policy and Planning, Ministry of Education), Mr. H.W. Wijedasa (Director, Mathematics, Ministry of Education), Ms. Gayathri Abeygunesekera (Commissioner, Department of Examinations), Ms. Priyanthi Samaraweera, (Assistant Commissioner, Education and Publications Department), Dr. Jayanthi Gunasekera (Assistant Director-General, National Institute of Education), Mr. Lal Wijesinghe (Assistant Director-General, National Institute of Education), Mrs. Janaki Wijesekera (Director, Mathematics, National Institute of Education), members of the technical support unit of the Finance Commission who organized and supported field visits, the Provincial Education Authorities, Zonal Education Authorities and Principals and teachers of provincial schools who shared their ideas at various stages of the study.
The authors also wish to thank the Provincial, Zonal and Divisional Education Authorities and Principals and Mathematics Teachers in schools for their participation in discussions on Science Education and for sharing their ideas, and the National Education Research and Evaluation Centre (NEREC) of the University of Colombo for making available National Assessment results.
The study was financed by the World Bank and the Education Program Development Fund
(EPDF) of the Education for All: Fast Track Initiative. This financing is acknowledged with
gratitude.
- 2 -
List of acronyms
DOE Department of Examinations EPD Education Publications Department
GCE O/L General Certificate of Education, Ordinary Level GCE A/L General Certificate of Education, Advanced Level ICT Information and Communication Technologies
ISA In-service advisor
MOE Ministry of Education
NCOE National Colleges of Education
NCTM National Council of Teachers of Mathematics NEC National Education Commission
NEREC National Education Research and Evaluation Centre NIE National Institute of Education
PISA Program of International Student Assessment
SLAAED Sri Lanka Association for the Advancement of Education SLAAS Sri Lanka Association for the Advancement of Science TIM Teacher’s Instructional Manual
TIMSS Trends in Mathematics and Science Study
- 3 -
EXECUTIVE SUMMARY
Introduction
A well-informed and knowledgeable community is of vital importance for the economic and social development of a modern society. The knowledge and skills required for present day activities are much more complex than those required in the past. Today, many jobs require expert thinking and non-routine analytical skills, to identify and solve problems. Mathematics education focuses on developing a person’s analytical and problem solving abilities. Thus a high quality mathematics education will ensure that students develop the skills that are essential not only in science and technology, but also in everyday life and the workplace.
The government of Sri Lanka, recognizing the need for a high quality mathematics education has implemented several reforms in the recent past. Studies on these reforms have been carried out and measures have been taken to address the shortcomings. Although the progress achieved is commendable, there is still room for improvement in certain important aspects of the learning teaching process.
Learning Achievements in Mathematics
National cognitive achievement tests conducted by NEREC for Grade 8 students reveal a substantial improvement in mathematics learning outcomes in the middle school from 2005 to 2008. Among girls, the mean score increased from about 46 percent in 2005 to approximately 52 percent in 2008, and among boys, the mean score rose from about 44 percent in 2005 to approximately 49 percent in 2008.
Both urban and rural schools show an improvement in the achievement levels in mathematics learning outcomes. Although rural schools show a greater improvement between 2005 and 2008, there is still a disparity in the achievement levels of the two regions. In the urban areas, the mean score increased from about 52 percent in 2005 to approximately 53 percent in 2008. The mean score for rural areas increased from about 44 percent to approximately 49 percent during the same period.
There is a substantial difference between the test scores of students in Type 1AB schools and other schools, although all schools show an increase in test scores from 2005 to 2008. For Type 1AB schools, the mean score increased from 56.0 percent in 2005 to 58.4 percent in 2008. For Type 1C schools, the mean score increased from 45.3 percent in 2005 to 47.8 percent in 2008 and for Type 2 schools, the mean score increased marginally from 42.9 percent in 2005 to 43.1 percent in 2008. Most of the children from poor and disadvantaged communities attend Type 1C or Type 2 schools which cater to 60 percent of the students.
An improvement is seen in all five sub-skills in mathematics, namely, knowledge and skills,
communication, making connections, reasoning and problem solving. The test scores reveal that
communication is the best mathematical sub-skill. This has improved from a facility index of 52
percent in 2005 to 56 percent in 2008. The greatest improvement is seen in the sub-skill problem
- 4 -
solving for which the facility index increased from 48 percent in 2005 to 55 percent in 2008. For the two sub-skill ‘knowledge and skills’ and ‘making connections’, the facility index increased from 45 percent in 2005 to 50 percent in 2008. The weakest sub-skill in mathematics is reasoning, for which the facility index increased from 37 percent in 2005 to 42 percent in 2008.
Efforts should be made to improve these levels especially in the higher order skill of mathematical reasoning. Attention should also be paid to reduce the gap that exists between the test scores of type 1AB schools and other schools. The causes for regional disparities should also be considered and addressed.
There is an 11 percent increase in the GCE O/L pass rates in mathematics from 2002 to 2009.
Approximately 270,000 students from 6,600 schools sit the GCE O/L examination annually.
Since at least a simple pass grade in mathematics is required to qualify for the GCE A/L, an increase in mathematics pass rates positively affects the number who qualify for the GCE A/L.
Between the years 2005 and 2009, GCE O/L mathematics pass rates increased from 44 percent to 51 percent. In the year 2009, 49 percent of the students who sat the GCE O/L qualified for the GCE A/L.
Although there has been an improvement in the GCE O/L mathematics pass rates, the mean score has consistently been low up to 2009 (32±2). There are various factors contributing to the poor performance in mathematics at the GCE O/L examination. The subject knowledge of teachers is one of the major factors. Students passing from one grade to another without gaining the knowledge and skills that are essential to cope with the work in the higher grade is another contributing factor. However, the most important factor is that all students have to follow the same mathematics syllabus and sit the same mathematics examination paper at the GCE O/L.
There is a disparity in the GCE O/L mathematics pass rates of the provinces. For the year 2009, the highest pass rate of 60 percent was observed in the Western province which is the most economically advanced province, while the lowest pass rate of 42 percent was seen in the Uva and North Central provinces. The Eastern and Central provinces also performed relatively poorly, with pass rates of 45 percent and 44 percent respectively. The other four provinces, Northern, Southern, North-Western and Sabaragamuwa performed approximately equally, with pass rates between 51 percent and 54 percent. There is also significant disparity in pass rates between zones within provinces. For mathematics, most of the low performing zones are in the Northern, Central, Eastern, Uva and North Central provinces. The geographical distribution of the zones clearly indicates that the lower performing zones are mainly from conflict effected regions and plantation areas. Efforts should be made to reduce these differences by providing better education services to disadvantaged provinces and rural areas.
In 2009, the GCE O/L mathematics pass rates in national and provincial schools were 74 percent and 44 percent respectively. The ratio of those sitting for the GCE O/L mathematics paper from national and provincial schools is approximately 1:4. This means that 20 percent of the students contribute to a pass rate of 74 percent while 80 percent contribute to a pass rate of 44 percent.
Clearly, mathematics education in provincial schools needs to be improved greatly.
- 5 -
During the past five years, there has been high variation in the GCE A/L examination pass rates with respect to the main subjects. Annually, about 20,000 students sit as school candidates for the GCE A/L combined mathematics paper, while approximately 30,000 students sit for the biology paper. In 2009, the GCE A/L pass rate in combined mathematics was 44.9 percent. This is low, in comparison for instance to the pass rate of 75 percent in biology. Although a credit pass in mathematics at the GCE O/L examination is required to follow the physical science stream at the GCE A/L, the prescribed competency in mathematics may be insufficient to cope with the standard of mathematics expected at the GCE A/L. The present system where all students following the same mathematics syllabus at the GCE O/L prevents curriculum developers and teachers from catering to the requirements of students who wish to follow mathematics at the GCE A/L and beyond. Between 2004 and 2009, pass rates in combined mathematics have decreased by approximately 8 percent.
The National Education Policy and Curriculum Reforms
Sri Lankan policy makers since the 1930s have advocated the provision of widespread access to primary and secondary education. This has enabled the country to attain a high level of human development. In 1972, a common general curriculum was introduced and mathematics was taught to all students in grades 1 to 9. In 1991, the government established the National Education Commission (NEC) which formulated a National Education Policy. Reforms based on this policy were implemented in 1997.
Curriculum revisions were carried out in 2007 and at this juncture Sri Lanka adopted a competency based learning teaching assessment model. The reforms at this stage were introduced to address the issue that students were unable to demonstrate acceptable levels of achievement in applying their learning to everyday situations. Their skills in open ended problem solving and decision making were weak and few were able to demonstrate their ability to use higher order skills. The main aim of the mathematics curriculum under these reforms is to create individuals who are able to think mathematically and apply mathematical knowledge effectively and responsibly in problem solving and decision making. However, the early experience of curriculum implementation in grades 6 and 10, and in grades 7 and 11, was that there are shortcomings related to the design, planning, development and implementation of the curricula (NIE, 2009).
Mathematics Standards
International trends in mathematics education focus on developing individuals with the reasoning
abilities and communication skills required to solve everyday problems, by integrating the
traditional content of mathematics to make meaning of the real world. Many leading
international educational jurisdictions regard the Standards for School Mathematics as a global
benchmark (McCaul, 2007). The National Council of Teachers of Mathematics (NCTM) defines
standards as the mathematical content and processes that students should know and be able to
use as they progress through school. NCTM sets out five content standards which describe
explicitly the five strands of content that students should learn, and five process standards
highlighting the ways of acquiring and applying content knowledge. The Sri Lankan content
standards and process standards are aligned with these international standards.
- 6 - Mathematics Teaching Strategy
Primary Education (Grades 1 to 5)
The actions recommended by the Presidential Task Force in 1997 for primary education, based on the proposals of the NEC, included the following: an integrated curriculum incorporating the Mother Tongue, Religion, Mathematics and Environment Related Activities, a child centred approach, a learning teaching process based on guided play, activity and desk work, identification of entry level competencies and essential learning competencies, and continuous assessment throughout the learning teaching process (NEC, 2003).
These reforms were carried out successfully and the recommendation of the NEC in 2003 was that the curriculum developed in 1997 should be retained for primary education, but that the training of mathematics should be strengthened to raise the levels of attainment.
The Mathematics Teacher’s Instructional Manuals (TIMs) for the primary education cycle contain 10 common competencies to be developed in key stages 1, 2 and 3. Each TIM also specifies entry level competencies and essential learning competencies for each grade, the subject content and the learning teaching methodology. The syllabus has a spiral approach, and concepts are introduced in different grades with increasing depth. Textbooks which are aligned with the TIMs are provided to students in grades 3 to 5.
Junior Secondary Education and the GCE O/L Cycle (Grades 6 to 11)
The education reforms proposed in 1997 for junior secondary education were in contrast to the primary education reforms, weak, both conceptually and implementation-wise, lacking clear direction and cohesion. Several problems associated with mathematics education at the secondary level were identified and new proposals were put forwarded in 2003 to improve the quality of mathematics education at the junior secondary level (NEC, 2003).
A description of the aims of learning mathematics, the learning teaching process, the subject
content, competencies, competency levels, activity continuum and assessment criteria is
provided in the TIMs of grades 6 to 11. There are a common set of aims of learning mathematics
and 31 common competencies specified for grades 6 to 11. A study on the implementation of the
mathematics and science curricula revealed that although the curriculum strands and general
aims are aligned with international standards, there are several shortcomings in the TIMs. The
study revealed that the activities in the TIMs focus mainly on basic concepts and mathematical
skills and do not provide opportunities for open ended and creative problem solving. Learning
outcomes are not included for the process strands and specific criteria for assessing students
during each activity are not provided. Guidance is also not provided on how adjustments are to
be made to accommodate student needs or time constraints.
- 7 -
Mathematics is taught in the classroom through a series of activities. All activities are described in step-by-step detail, follow the same format, and prescribe the same teaching strategy. The activities are designed in a sequence according to the 5E learning cycle of engagement, explanation, exploration, elaboration and evaluation. Teachers use only the activities specified in the TIMs in their lessons and lack sufficient flexibility to develop their own lessons or use different teaching strategies.
The Education Publications Department (EPD) is responsible for the production and distribution of textbooks. The government provides mathematics textbooks to all students in grades 3 to 11.
The textbooks are based on the syllabi provided by the NIE. The present mathematics textbooks contain many errors. By investing in hiring a team of competent and qualified writers, the EPD can ensure that students are provided with high quality error free textbooks.
Teachers with sound mathematical knowledge and effective teaching practices are essential for imparting excellent mathematics education. There are approximately 2400 teachers without the required training who teach mathematics in the secondary education cycle. Studies conducted by the NIE and the DOE reveal the urgent need for a comprehensive teacher development program to enhance the knowledge and skills of mathematics teachers.
GCE A/L Cycle (Grades 12 and 13)
There are three mathematics courses offered by GCE A/L students. All Physical Science students offer combined mathematics. Higher mathematics is offered on average by less than 10 Physical Science students. Mathematics is offered on average by less than 75 Arts students.
Mathematics and science at the senior secondary education level are available at only 600 schools which account for about 25 percent of the schools with GCE A/L classes. Recognizing the need to expand science and mathematics education, the NEC proposed that GCE A/L science and mathematics streams be introduced in 1,745 Type 1C schools across the country in a phased program (NEC, 2003). However, there has been little success in following up on these recommendations. The number of school candidates offering combined mathematics as a subject at the GCE A/L has not increased during the past six years. There is a decreasing trend in mathematics pass rates during these years.
The syllabi and TIMs for the senior secondary education cycle are prepared by the NIE in
consultation with university academic staff. A competency based curriculum was introduced in
2009. The 5E learning teaching model is advocated in the TIMs. However, most teachers adopt
lecture style teaching due to lack of time. The government does not provide mathematics text
books for A/L students. The EPD has translated several English medium mathematics textbooks
of international standard which have assisted students greatly and this practice should be
continued.
- 8 - Avenues and Pathways for the Future
The cognitive capacities and the mental development of students vary. This needs to be taken into consideration when secondary school curricula are being formulated. Countries such as the U.K. and Singapore address this by providing different mathematics syllabi to cater to the varying needs and abilities of students. The Ministry of Education could consider adopting a similar practice and have two syllabi, an advanced mathematics syllabus for students intending to pursue mathematics-intensive subjects in high school, and a second practical mathematics syllabus for the others.
It is essential to ensure that all mathematics teachers are subject-competent and have sound teaching practices since they play one of the pivotal roles in providing students with a high quality mathematics education. In consequence, it is of vital importance that a comprehensive teacher development program which provides teachers with both the required subject knowledge and training in good teaching practices is initiated. The program should incorporate the objectives of the curriculum so that all teachers have a better understanding of the expectations of the curriculum.
Since there is no systematic monitoring to identify shortcomings in the curriculum, an on-going monitoring program needs to be designed and implemented to ascertain whether the objectives of the curriculum are being met.
To ensure that students are provided with quality textbooks, the EPD needs to invest in hiring a team of competent and qualified writers. Writers need to be made aware of the aims of the competency based curriculum so that the textbooks are aligned with these aims. Final evaluation of the textbooks needs to be undertaken by at least two subject experts.
To overcome shortcomings in the TIMs, learning outcomes need to be provided not only for the
content standards but for the process standards as well. The process standards reasoning and
problem solving need to be included in the activities. Clear guidelines need to be provided on
how the process standards are to be assessed. Attention needs also to be paid to the horizontal
integration of subjects and the use of technology. Teachers need to be encouraged to develop
their own lesson plans and to use different teaching strategies.
- 9 -
Introduction
A well-informed and knowledgeable community is of vital importance for the economic and social development of a modern society. The knowledge and skills required for present day activities are much more complex than those required in the past. Today, many jobs require expert thinking and non-routine analytical skills, to identify and solve problems. Mathematics education focuses on developing a person’s analytical and problem solving abilities. Thus a high quality mathematics education will ensure that students develop the skills that are essential not only in science and technology, but also in everyday life and the workplace. Mathematics is also an exciting subject which challenges the mind and offers opportunities for students to enhance their creative abilities.
The government of Sri Lanka, recognizing the need for a high quality mathematics education, has implemented several reforms in the recent past. Studies on these reforms have been carried out and measures have been taken to address the shortcomings. Although the progress made is commendable, there is still room for improvement in certain important aspects of the learning teaching process.
This paper is organized as follows. The first section presents the learning achievement of
students in mathematics at national examinations. The second section reviews how national
education policies and curriculum reforms have been developed in Sri Lanka. The third section
describes Sri Lankan mathematics standards. Then it discusses the mathematics curriculum and
teaching strategy at different levels of the education cycle. The paper ends with proposals for
improving mathematics education in Sri Lanka.
- 10 -
Section one: learning achievements in mathematics
The analysis presented in this section is based on the achievements of students in mathematics at 3 separate examinations; (1) the national assessment of learning outcomes of grade 8 students conducted by the National Education Research and Evaluation Center (NEREC), University of Colombo, (2) the GCE O/L examination at the end of grade 11 conducted by the Department of Examinations (DOE), and (3) the GCE A/L examination at the end of grade 13 conducted by the Department of Examinations. The national assessment of learning outcomes was a randomized sample based test administered to approximately 10,000 students in government schools who have completed grade 8. The GCE O/L examination is taken annually by approximately 270,000 students from 6,600 schools and the GCE A/L examination (science stream) is taken annually by approximately 50,000 students from 700 schools.
National Assessment at Grade 8 Time trend of learning outcomes:
The trends of the learning outcomes of Grade 8 students for mathematics are presented in Figure 1. There is an improvement in the achievement levels in mathematics between 2005 and 2008.
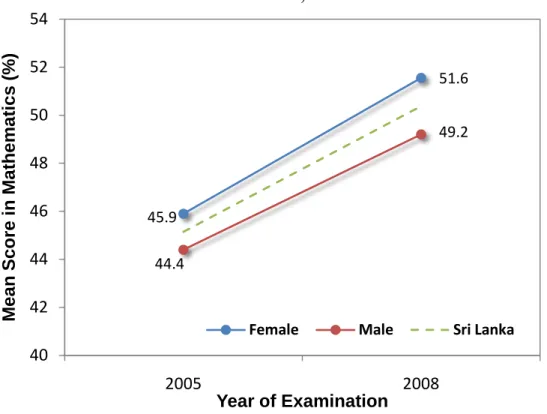
This improvement is seen for both males and females, although a slightly greater increase in mathematics scores is seen for females, compared to that of their male counterparts.
The national mean score for mathematics increased from 45.2 percent in 2005 to 50.4 percent in 2008. For females, the mean score increased from 45.9 percent in 2005 to 51.6 percent in 2008.
For males, the mean score increased from 44.4 percent in 2005 to 49.2 percent in 2008. The
difference between the 2005 and 2008 mean scores is statistically significant at 99 percent. The
increases shown here are quite substantial considering that the two evaluations were carried out
within a period of 3 years. Further national assessments are required to test the reliability and
magnitude of these highly positive findings.
- 11 -
Figure 1: The time trend of learning outcomes of grade 8 students for mathematics, males and females, 2005-2008
Source: National Assessments of Learning Outcomes, Grade 8, 2005 and 2008, National Education Research and Evaluation Center, University of Colombo.
Achievement levels in mathematics learning outcomes by Sector:
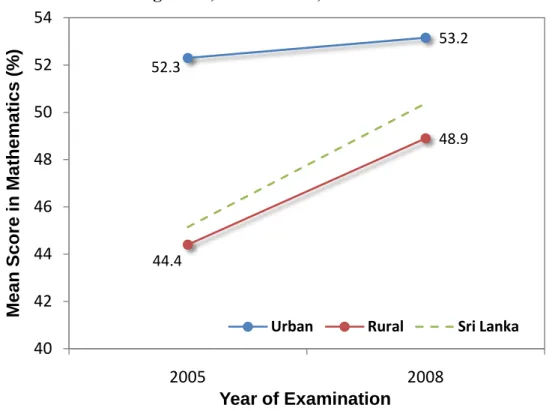
The achievement levels in mathematics learning outcomes for the urban and rural sectors are presented in Figure 2. An increase in the mean score is seen in both the urban and rural sectors.
In comparison to the urban sector, the rural sector shows a greater improvement in the mathematics learning outcomes of students, closing the gap between the two.
For the urban sector, the mean score in mathematics increased from 52.3 percent in 2005 to 53.2 percent in 2008. For the rural sector, the mean score increased from 44.4 percent in 2005 to 48.9 percent in 2008. During the years from 2005 to 2008, the gap between the two sectors has reduced from about 8 percent to approximately 4 percent.
45.9
51.6
44.4
49.2
40 42 44 46 48 50 52 54
2005 2008
M ean S co re in M at h em at ics ( % )
Year of Examination
Female Male Sri Lanka
- 12 -
Figure 2: The achievement levels in learning outcomes of the urban and rural sectors, grade 8, mathematics, 2005-2008
Source: National Assessments of Learning Outcomes, Grade 8, 2005 and 2008, National Education Research and Evaluation Center, University of Colombo.
Achievement levels in mathematics learning outcomes by Type of School:
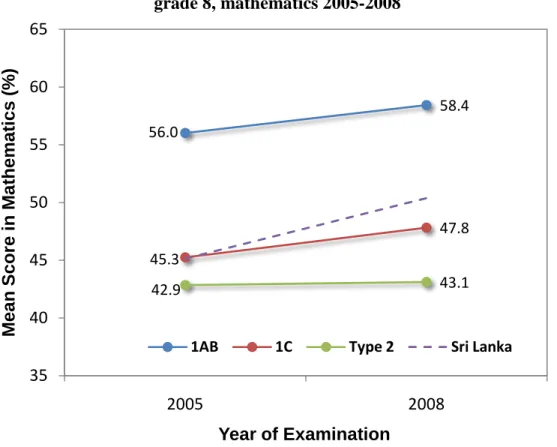
The increase in achievement levels in mathematics learning outcomes seen between 2005 and 2008 is desegregated further by type of school and presented in Figure 3. Type 1AB schools which are large and better funded have classes from grade 1 to 13 and offer the full primary, junior secondary and senior secondary school curriculum (Aturupane, 2009). A large number of these schools are National Schools managed directly by the Ministry of Education. Type 1C schools which are also large schools have grades from 1 to 13, and offer a full curriculum with the exception of Science for the senior secondary cycle (GCE A/L). Type 2 schools run from grade 1 to 11 and offer the school curriculum up to the junior secondary level (GCE O/L). All Type 1C and Type 2 schools are provincial schools managed by provincial education authorities.
For mathematics, Type 1AB schools perform the best, while Type 1C schools come next, followed by Type 2 schools. Type 1AB and Type 1C schools show significant improvement in student performance between 2005 and 2008. Type 2 schools show a very slight improvement which is not significant.
For Type 1AB schools, the mean score increased from 56.0 percent in 2005 to 58.4 percent in 2008. For Type 1C schools, the mean score increased from 45.3 percent in 2005 to 47.8 percent in 2008. For Type 2 schools, the mean score increased marginally from 42.9 percent in 2005 to 43.1 percent in 2008.
52.3
53.2
44.4
48.9
40 42 44 46 48 50 52 54
2005 2008
M ean S co re in M at h em at ics ( % )
Year of Examination
Urban Rural Sri Lanka
- 13 -
Figure 3: The achievement levels in learning outcomes by School Type, grade 8, mathematics 2005-2008
Source: National Assessments of Learning Outcomes, Grade 8, 2005 and 2008, National Education Research and Evaluation Center, University of Colombo.
The finding that the performance of students in Type 1C and Type 2 schools is worse than the performance of those in Type 1AB schools is important for policy decisions. There are approximately 6,000 schools which are either Type 1C or Type 2 schools catering to approximately 60 percent of the students. These schools are attended by children from poor and disadvantaged communities. Thus, more public resources need to be channelled to upgrade the level of these schools. On the other hand, if the level of education in Type 1C schools can be improved up to the level in Type 1AB schools by providing a better teaching learning environment and, if students studying in Type 2 schools can be given the opportunity to move into Type 1C schools after the primary education cycle, a larger percentage of students can be provided with a mathematics education equivalent to that in Type 1AB schools. This agrees with the government plan to develop 1000 secondary schools.
56.0
58.4
45.3
47.8
42.9 43.1
35 40 45 50 55 60 65
2005 2008
M ean S co re in M at h em at ics ( % )
Year of Examination
1AB 1C Type 2 Sri Lanka
- 14 -
Achievement levels in mathematics learning outcomes by Sub-skills:
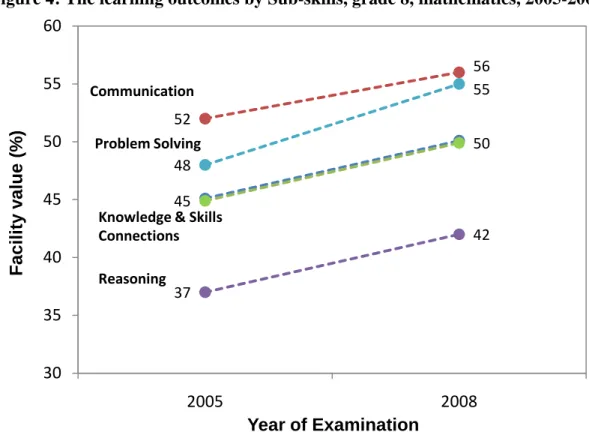
The test items of the grade 8 national assessments have been designed to test the learning outcomes specified by the curriculum developers of each subject (NEREC, 2008). In mathematics, knowledge and skills, communication, making connections, reasoning and problem solving abilities have been tested. The achievement levels of students under each of these sub- skills can be analyzed using the facility values (discrimination indices) of the test items. In calculating the facility value, NEREC has used the percentage of students who have been able to answer the given item correctly. Figure 4 shows the results for each of the above sub-skills for 2005 and 2008.
Figure 4: The learning outcomes by Sub-skills, grade 8, mathematics, 2005-2008
Source: National Assessments of Learning Outcomes, Grade 8, 2005 and 2008, National Education Research and Evaluation Center, University of Colombo.
On average, there is an improvement in all five sub-skills between 2005 and 2008.
Communication is the best mathematics sub-skill among students. This has improved from a facility index of 52 percent in 2005 to 56 percent in 2008. The greatest improvement is seen in the sub-skill problem solving for which the facility index has increased from 48 percent in 2005 to 55 percent in 2008. Both the sub-skill ‘knowledge and skills’ and the sub-skill ‘making connections’ have improved from a facility index of 45 percent to a facility index of 50 percent from 2005 to 2008. The weakest sub-skill in mathematics is reasoning. This is consistent with the performance of students at the GCE O/L examination, where the poorest performance is seen in geometry which tests the skills of reasoning to a high degree.
52
56
45
50
37
42 48
55
30 35 40 45 50 55 60
2005 2008
F a c ilit y v a lu e ( % )
Year of Examination
Communication
Knowledge & Skills Connections Problem Solving
Reasoning
- 15 - Performance at the GCE O/L examination Time trend of examination pass rates:
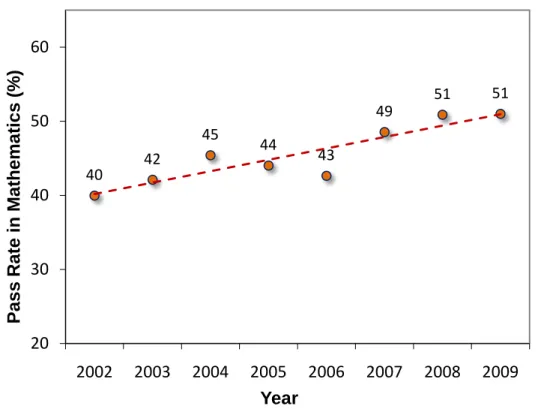
The GCE O/L pass rates in mathematics for school candidates in the country as a whole between 2002 and 2009 indicate an 11 percent improvement (see Figure 5).
Figure 5: Performance of school candidates at the GCE O/L examination 2002 – 2009
Source: World Bank estimates, based on Department of Examinations data, 2002-2009
As at least a simple pass grade in mathematics is required to qualify for the GCE A/L, an increase in mathematics pass rates at the GCE O/L positively affects the number that qualifies for the GCE A/L. The number that qualifies for the GCE A/L is now reaching 50 percent of those sitting the examination
1. However, when the GCE O/L mathematics mean scores of the past 5 years are compared, no significant change is seen. The mean scores are at a very low value (32±2). Thus, the positive trend seen may reflect the effects of adjustments made to examination pass marks rather than the actual achievement levels of students.
1
Since the time period given for answering the mathematics paper was increased by 30 minutes in 2010, a direct comparison with past data cannot be carried out.
40 42
45 44 43
49 51 51
20 30 40 50 60
2002 2003 2004 2005 2006 2007 2008 2009
P ass R at e i n M at h em at ics (% )
Year
- 16 - Regional disparities in examination pass rates:
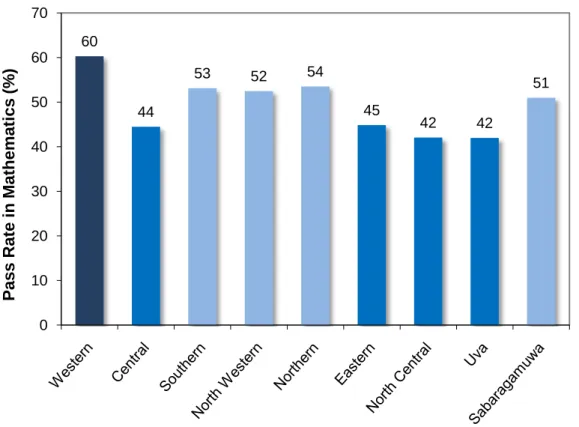
Figure 6 presents a comparison of GCE O/L mathematics pass rates in 2009, across all nine
provinces. The highest pass rate of 60 percent is seen in the Western province, while the lowest
pass rate of 42 percent is seen in the Uva and North Central provinces. The Eastern and Central
provinces also performed relatively poorly, with pass rates of 45 percent and 44 percent
respectively. The other four provinces, Northern, Southern, North-Western and Sabaragamuwa
performed approximately equally, with pass rates between 51 percent and 54 percent.
- 17 -
Figure 6: Performance of students in mathematics at the GCE O/L examination in 2009, by Province
Source: World Bank estimates, based on Department of Examinations data, 2006
As such, the provinces fall into three categories, with one group of four provinces at the bottom, a second group of four provinces clustered in the middle and the Western province an outlier at the top. The Western province is the most economically advanced and educationally developed region of the country. The Southern, North-Western and Sabaragamuwa provinces too have traditionally been educationally developed regions.
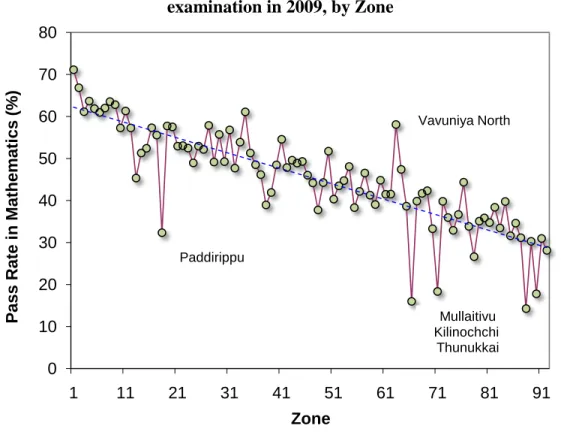
The provincial performance does not reveal the disparities within the provinces, especially the performance in disadvantaged areas, relative to the high performance in urban centres. The data shown in Figure 7 reveals the high disparity in examination pass rates in individual education zones. The zones are ranked according to their performance in 2006. Any zone depicted higher than the fitted line has an improved performance in 2009 compared to 2006 and vice versa.
60
44
53 52 54
45 42 42
51
0 10 20 30 40 50 60 70
P ass R at e i n M at hem at ics (% )
- 18 -
Figure 7: Performance of students in mathematics at the GCE O/L examination in 2009, by Zone
Source: World Bank estimates, based on Department of Examinations data, 2006 and 2009
Note: The zones are arranged in the order of highest performing zone to lowest performing zone relative to 2006 performance. Only the identities of a few selected zones are given.
For mathematics, in 2009, the highest pass rate is 71% in the Colombo zone whilst the lowest is 14% in Thunukai . Performance in the zones, Mullaitivu, Padirippu, Killinochchi and Thunukai has dropped by more than a 10 percent compared to the 2006 performance. Approximately 25 percent of the zones show more than a 10 percent improvement in performance with Vavuniya North showing the highest at a 26 percent increase. In general, for mathematics, a number of zones in the Northern and Eastern provinces have shown a decrease in performance possibly due to an increase in hostilities in these regions between 2005 and 2008. However, since less than 100 students sat the GCE O/L examination from each of these zones in 2009, statistically meaningful comparisons cannot be made. Many students from these zones may have been displaced and have taken the examination under disrupted circumstances.
Performance of National and Provincial schools:
Government schools are categorized into two types, national and provincial schools. While the national schools are managed by the Ministry of Education (line ministry), the provincial schools are managed by the individual provinces. Most of the national schools are well established schools. Better performing students from poor households are allowed to enter these schools through the Grade 5 scholarship examination. In general, compared to the provincial schools, the national schools are provided with better facilities and well trained teachers. Thus, students
0 10 20 30 40 50 60 70 80
1 11 21 31 41 51 61 71 81 91
P ass R at e i n M at hem at ics (% )
Zone
Paddirippu
Vavuniya North
Mullaitivu Kilinochchi
Thunukkai
- 19 -
entering national schools are of superior achievement and are exposed to a better teaching- learning environment, and hence perform well at the GCE O/L examination.
Figure 8: Comparison of student performance in mathematics at the GCE O/L examination in 2009 at National and Provincial schools
Source: World Bank estimates, based on Department of Examinations data, 2009
Figure 8 shows the performance of students in mathematics at the GCE O/L examination in 2009. For mathematics, pass rates in national and provincial schools are 74 percent and 44 percent respectively. Compared to the other provinces, the national schools in the Uva and Central provinces show relatively low performance. The ratio of the number of students sitting for the O/L mathematics paper from national and provincial schools is approximately 1:4. This means that 20 percent of the students contribute to a pass rate of 74 percent while 80 percent contribute to a pass rate of 44 percent. Clearly, mathematics education in provincial schools needs to be improved greatly. The same disparity is evident in the performance in science at national and provincial schools (Dissanayake & Sonnadara, 2011).
0 20 40 60 80 100
P ass R at e i n M at h em at ics (% )
National Provincial
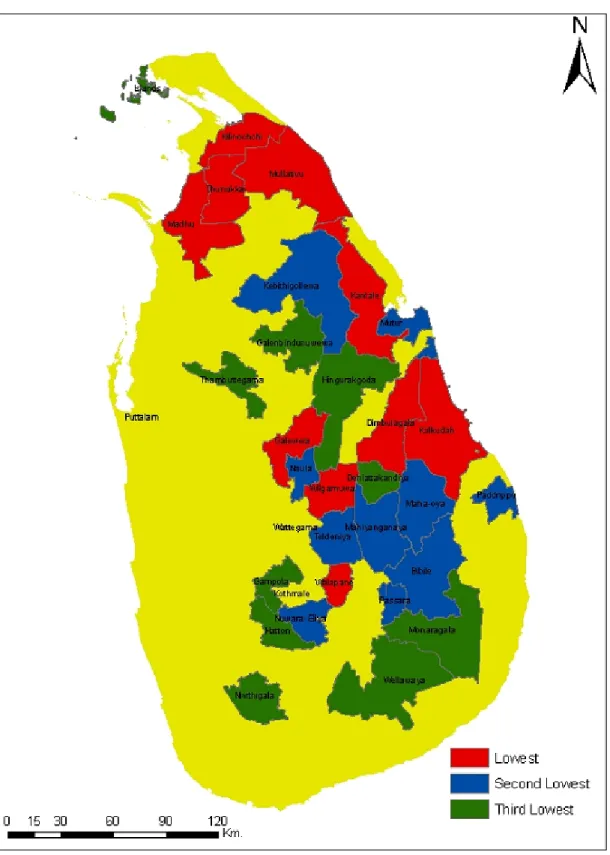
- 20 - Geographical distribution of low performing zones:
In order to analyze the geographical distribution of the low performing zones, the zones were ranked based on the performance in mathematics at the GCE O/L examination in 2009. Based on this rank, the lowest 30 zones were selected and overlaid on a map of Sri Lanka in three different colour codes to represent the performance level (see Figure 9).
For mathematics, most of the low performing zones are in the Northern, Central, Eastern, Uva and North
Central provinces. While all zones in the Western, Southern and North Western provinces seem to
perform well, the data reveal that except for Nivitigala all the other zones in the Sabaragamuwa province
too perform well. The geographical distribution of the zones clearly indicates that the low performing
zones are mainly from conflict affected regions and plantation areas. The fishing communities seem to
be performing better than expected. In general, the Western half of Sri Lanka which is economically
advanced performs better than the Eastern half.
- 21 -
Figure 9: The zones with the lowest performance in mathematics at the GCE O/L examination
Source: World Bank estimates, based on Department of Examinations data, 2009 Note Red: lowest 10%, Blue: lowest 11-20%, Green: lowest 21-30%.
- 22 - GCE A/L examination
Performance variations between the main subjects:
The school census reveals that there are about 30,000 students following the mathematics curriculum in the Grade 13 classes of government schools. Annually, about 50,000 students sit as school candidates for the GCE A/L physics and chemistry papers while approximately 20,000 sit for the combined mathematics paper.
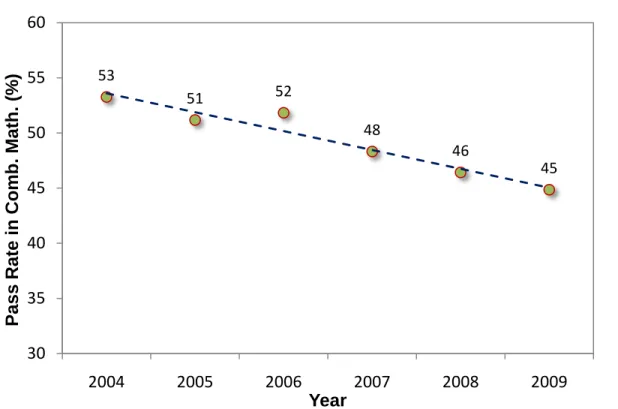
Figure 10: Pass rate in Combined Mathematics at the GCE A/L, 2004 – 2009
Source: World Bank estimates, based on Department of Examinations data, 2004-2009
In Figure 10, the performance of school candidates in combined mathematics at the GCE A/L examination is shown for the years 2004 to 2009. The data show that the pass rates in combined mathematics are low. Pass rates have also decreased by approximately 8 percent between 2004 and 2009. In 2009, while 63 percent and 59 percent of the students passed physics and chemistry respectively at the GCE A/L, only 45 percent passed combined mathematics. Although a credit pass in mathematics at the GCE O/L examination is required to follow the physical science stream at the GCE A/L, the prescribed competency in mathematics may be insufficient to cope with the competency level expected by the GCE A/L combined mathematics syllabus. The present system where all students follow the same mathematics syllabus at the GCE O/L may prevent curriculum developers and teachers from catering to the requirements of students who wish to follow mathematics at the GCE A/L and beyond.
This needs to be addressed by policy makers in order to bridge the gap between the GCE O/L and GCE A/L.
53
51 52
48
46 45
30 35 40 45 50 55 60
2004 2005 2006 2007 2008 2009
P ass R at e i n C o m b . M at h . ( % )
Year
- 23 - Regional disparities in pass rates:
In Figure 11, provincial-wise variation in the pass rates of physical science students who sat the GCE A/L examination for the first time in 2009 is shown. The overall pass rate for physical science is at 33 percent. As for biological science (Dissanayake & Sonnadara, 2011), the Northern Province shows the highest pass rate, at 47 percent. However, the number of candidates who sat for the examination from this province is at a very low value perhaps due to the internal displacements caused by the past conflicts. The lowest pass rate of 25% for physical science was reported in Sabaragamuwa.
Figure 11: Provincial performance at the GCE A/L examination, Physical Science
Source: World Bank estimates, based on Department of Examinations data, 2009
At present, the GCE A/L examination pass rates are not desegregated beyond the district level. District level data show further disparities in GCE A/L pass rates (see Figure 12). For physical science, pass rates vary from 12 percent in Mulaitivu to 57 percent in Vavuniya. The data reveal high variations in GCE A/L pass rates at the district level within the Northern province possibly due to low numbers of students sitting for the examination. The Eastern province which also had a number of disruptions due to internal conflicts shows a remarkable comeback.
33 31
37
47
36
28 27
33
25
0 10 20 30 40 50
P ass R at es in P h y si cal S ci en ce (% )
- 24 -
Figure 12: Performance at the GCE A/L examination, Physical Science, by District, 2009
Source: World Bank estimates, based on Department of Examinations data, 2009
Provincial share of students:
Figure 13 shows the provincial share of physical science students sitting as first time candidates for the GCE A/L examination in 2009.
For physical science, 40 percent of the students are from schools in the Western province. When the numbers from the Western, Southern, Central, Sabaragamuwa and North Western provinces are combined, the share is 83 percent. The better performing provinces are the economically stronger provinces which have better schools. Since the pass rates in these provinces are at a higher level, this phenomenon has a direct bearing on the production of a skilled labour force which can contribute to the enhancement of economically disadvantaged provinces. In addition, this is linked to teacher deployment issues. The smaller the pool of students who qualify in mathematics, the fewer the well qualified teachers in the area to contribute to improving the mathematics standard in the disadvantaged provinces.
26 29 3537
20 26 31 3839 51
15 35 57
12 181922 2729313132 35 39 47
0 10 20 30 40 50 60
Colombo GampahaKalutaraMataleKandy Nuwara EliyaHambantotaTrincomaleeKurunegalaKilinochchiBatticaloaMullativuVavuniyaPuttalamMannarAmparaMataraJaffnaGalle AnuradhapuraPolonnaruwaMonaragalaRatnapuraBadullaKegalle
Pass Rates in Physical Science (%)
- 25 -
Figure 13: Provincial share of students, Physical Science, 2009
Source: World Bank estimates, based on Department of Examinations data, 2009 WP 40%
SP 17%
CP 10%
SGP 7%
NWP 9%
UP 4%
EP 5%
NCP 3%
NP 5%
- 26 -
Section two: the national education policy and curriculum reforms
Sri Lankan policy makers since the 1930s have advocated the provision of widespread access to primary and secondary education. This has enabled the country to attain a high level of human development.
Realising the importance of science and mathematics education as early as in the 1960s, the then government established the Curriculum Development Centre, mainly to develop the curricula in science and mathematics. In 1972, a common general curriculum was introduced through a major curriculum revision and mathematics was taught to all students in grades 1 to 9. In 1991, the government established the National Education Commission (NEC) which formulated a National Education Policy after wide public consultation and debate. The reforms that were recommended based on this policy were implemented by the government in 1997. These reforms were subjected to a series of evaluation studies and in 2003 a new set of reforms were proposed and implemented from 2007 (NEC, 2003).
The actions recommended by the Presidential Task Force in 1997 for primary education based on the proposals of the NEC included the following: an integrated curriculum incorporating the Mother Tongue, Religion, Mathematics and Environment Related Activities, a child centred approach, a learning teaching process based on guided play, activity and desk work, identification of entry level competencies and essential learning competencies, and continuous assessment throughout the learning teaching process (NEC, 2003).
These reforms were carried out successfully and the recommendations of the NEC in 2003 were that the
curriculum developed in 1997 should be retained for primary education, but that the training of
mathematics should be strengthened to raise the levels of attainment. The education reforms proposed in
1997 for junior secondary education were in contrast to the primary education reforms, weak, both
conceptually and implementation-wise, lacking clear direction and cohesion. Several problems
associated with mathematics education at the secondary level were identified and new proposals were
put forwarded to improve the quality of mathematics education at the junior secondary level (NEC,
2003).
- 27 -
Source: NEC (2003)
In 2007, a competency based learning teaching assessment model was adopted to address the issue that students were unable to demonstrate acceptable levels of achievement in applying their learning to everyday situations. It was found that their skills in open ended problem solving and decision making were weak and that few were able to demonstrate their ability to use higher order skills.
The main aim of the mathematics curriculum under these reforms was to develop individuals who are able to think mathematically, and apply mathematical knowledge effectively and responsibly in solving problems and making decisions.
Two studies were carried out on the curricula introduced in grades 6 and 10 in 2007 (NIE, 2008), and in grades 7 and 11 in 2008 (NIE, 2009). Several shortcomings in the design, planning, development and implementation of the curricula have been highlighted in these two reports. Some of the shortcomings highlighted are: (a) the new curriculum reforms were not based on research findings or weaknesses in the preceding curriculum; (b) no proper pre-testing was carried out with regard to appropriateness; (c) there is no horizontal integration of different subjects; (d) only the 5E model is used as the learning methodology; (f) dissemination and publicizing of ideas relevant to the new curriculum were not adequate; (g) the understanding of the implementation of the curriculum among teachers was inadequate; (h) there is no systematic monitoring to identify shortcomings in the curriculum.
Focus group discussions with teachers too revealed various problems in the implementation of the new curriculum. Teachers felt that the training they had received on implementing the curriculum was inadequate, that there was insufficient time allocated for all the activities proposed in the Teacher’s Instructional Manuals and that the 5E method is not the most appropriate teaching strategy in all situations.
Problems identified in relation to mathematics education under the 1997 reforms
1. The education system does not produce young people with basic mathematics skills and competencies required by the world of work.
2. The curriculum has not been modernized to suit the needs of the modern world.
3. There is a dearth of mathematics qualified personnel in the job market.
4. Modern techniques are not used in the learning teaching process.
5. Teacher guides are neither comprehensive nor adequate.
6. Teachers are neither adequately trained nor motivated.
7. Education software and other essential teaching materials are not available.
8. Textbooks are scarce or not available.
9. Monitoring mechanisms are not effective.
10. Mathematics education is too theoretical with little emphasis on applications.
The NEC proposals to improve the quality of mathematics education 1. Extensive revision or re-formulation of the curricula.
2. Modern learning-teaching methodologies such as an activity based student centred approach. Use of IT as a tool in the learning teaching process.
3. Preparation of textbooks and teacher guides based on the curricula.
4. Both pre-service and in-service teacher training in mathematics strengthened.
5. Promotion and popularization of mathematics.
- 28 -
Section three: mathematics standards
International mathematics education focuses on developing individuals with the reasoning abilities and communication skills required to solve everyday problems, by integrating the traditional content of mathematics to make meaning of the real world.
Many leading international educational jurisdictions recognize the Standards for School Mathematics developed by the National Council of Teachers of Mathematics (NCTM) as a global benchmark (McCaul, 2007). NCTM defines ‘standards’ as the mathematical content and processes that students should know and be able to use as they progress through school. They set out five content standards which describe explicitly the five strands of content that students should learn, and five process standards highlighting the ways of acquiring and applying content knowledge (see Table 1).
Table 1: Comparison of the NCTM standards and Sri Lankan standards
NCTM content standards Sri Lankan content standards
Number and Operations Numbers
Measurement Measurement
Geometry Geometry
Algebra Algebra
Data Analysis and Probability Statistics Sets and Probability
NCTM process standards Sri Lankan process standards
Communication Communication
Representation (Knowledge and ) Skills
Connections Relationships
Reasoning and Proof Reasoning
Problem Solving Problem Solving
Source: National Council of Teachers of Mathematics Sri Lanka.
Table 1 reflects that the Sri Lankan content standards and process standards are aligned with
international trends.
- 29 -
Source: Mullis et. al. (2008).
The Trends in International Mathematics and Science Study (TIMSS) is a continuing cycle of international mathematics and science assessments conducted every four years for fourth and eighth grade students. It assesses achievement in countries around the world and collects information on the educational contexts for learning mathematics and science. TIMSS data have been collected in 1995, 1999, 2003, and 2007.
In the years 1999, 2003 and 2007, the Asian Pacific countries, Singapore, the Republic of Korea, Chinese Taipei, Hong Kong and Japan have consistently had the highest average performance in mathematics amongst grade 8 students. In 2003, Singapore was the top performing country at both the fourth and eighth grades, having significantly higher average achievement in mathematics than the rest of the participating countries. In 2007, there was a significant gap between the average achievement in mathematics at grade 8 of the above five Asian Pacific countries and the rest of the participating countries. In the same year, the achievement of 40 to 45 percent of grade 8 students in China Taipei, Korea and Singapore were at or above the Advanced International Benchmark, which represents fluency on items involving the most complex topics and reasoning skills. The median percentage of students reaching this Benchmark that year was 2 percent.
Factors associated with higher achievement in mathematics include: (i) speaking the language
of the test at home, (ii) higher levels of parents’ education, (iii) positive attitude towards
learning mathematics (iv) higher educational expectations, (v) more educational resources and
books in the home, and (vi) attending a school where (a) satisfactory working conditions and
adequate resources are provided, (b) there are less attendance problems and fewer students
from economically disadvantaged homes, and (c) principals and teachers have a positive view
of the school climate.
- 30 -
Section four: mathematics curriculum and teaching strategy
The primary and secondary school mathematics curriculum of Sri Lanka is developed by the Department of Mathematics, Faculty of Science and Technology of the National Institute of Education (NIE), Sri Lanka.
Primary Education (Grades 1 to 5)
The mathematics Teacher’s Instructional Manuals (TIMs) for the primary education cycle contain ten common competencies to be developed in key stage 1 (Grades 1 and 2), key stage 2 (Grades 3 and 4) and key stage 3 (Grade 5). The TIMs also specify entry level competencies and essential learning competencies for each grade, the subject content and the learning teaching methodology. An assessment report card with the essential learning competencies is provided at the back of the TIMs. The syllabus has a spiral approach and concepts are introduced in different grades with increasing depth. Textbooks which are aligned with the TIMs are provided to students in Grades 3 to 5.
Table 2 compares the primary mathematics content standards of Sri Lanka with those of Singapore (MOE, 2007) which has scored well on recent international assessment studies such as Trends in Mathematics and Science Study (TIMSS) and Programme of International Student Assessment (PISA).
Table 2: Primary Content Standards – A Comparison
Sri Lanka Singapore
Grades 1 and 2
Numbers, Measurements,
Money, Shapes and Space
Grade 1 Whole Numbers Measurements
Geometry Data Analysis Grade 2 Grade 1 Standards &
Fractions Grades
3, 4 and 5
Numbers, Operations, Measurements,
Money, Shapes and Space Manipulation of Data
Grade 3 Same as Grade 2
Grade 4 Grade 3 Standards &
Decimals Grade 5 Grade 4 Standards &
Percentages, Ratios
Source: National Institute of Education, Sri Lanka & Ministry of Education, Singapore
The content standards of the Sri Lankan syllabi and the Singapore syllabi are similar. However, Sri Lanka introduces data analysis only in grade 3, whereas Singapore introduces it in grade 1. Singapore also introduces ratios and percentages in grade 5, while Sri Lanka introduces these concepts only in grades 6 and 7 respectively.
Three hours and thirty minutes are allocated per week for mathematics in key stage 1, while 5 hours are
allocated per week for mathematics in key stages 2 and 3. The learning teaching process in the primary
- 31 -
education cycle involves guided play, activity and desk work. In key stage 1, greater emphasis is placed on guided play. Equal emphasis is given to the three processes in key stage 2, and in key stage 3, greater emphasis is placed on activity and desk work. Teachers are encouraged to use mathematics activity rooms, competitions, projects, exhibitions etc., to kindle the interest of students in mathematics and develop their knowledge and skills.
Studies carried out by the Sri Lanka Association for the Advancement of Education (SLAAED) and the National Education Research and Evaluation Centre (NEREC) have revealed that the reforms in 1997 have had a positive effect on the quality of primary education (SLAAED, 2000, NEREC, 2002)
Junior Secondary Education (Grades 6 to 11)
A description of the aims of learning mathematics, the learning teaching process, the subject content, competencies, competency levels, activity continuum and assessment criteria is provided in the TIMs of grades 6 to 11. There are a common set of aims of learning mathematics and 31 common competencies specified for grades 6 to 11. Under the competencies, competency levels as well as subject content and learning outcomes are specified for each grade.
A study carried out on the implementation of the mathematics and science curricula in grades 6 and 10 revealed that the curriculum strands and general aims correspond to international standards (McCaul, 2007). However the study also highlighted several shortcomings in the TIMs. These are common to the grades 7 to 9 and grade 11 TIMs as well.
Source: McCaul (2007)