Research Collection
Journal Article
Quantitative investigation on the accuracy and precision of Scan- to-BIM under different modelling scenarios
Author(s):
Esnaashary Esfahani, Mansour; Rausch, Christopher; Sharif, Mohammad Mahdi; Chen, Qian; Haas, Carl;
Adey, Bryan T.
Publication Date:
2021-06
Permanent Link:
https://doi.org/10.3929/ethz-b-000477429
Originally published in:
Automation in Construction 126, http://doi.org/10.1016/j.autcon.2021.103686
Rights / License:
Creative Commons Attribution-NonCommercial-NoDerivatives 4.0 International
This page was generated automatically upon download from the ETH Zurich Research Collection. For more
information please consult the Terms of use.
Automation in Construction 126 (2021) 103686
Available online 31 March 2021
0926-5805/© 2021 The Authors. Published by Elsevier B.V. This is an open access article under the CC BY-NC-ND license
(http://creativecommons.org/licenses/by-nc-nd/4.0/).
Quantitative investigation on the accuracy and precision of Scan-to-BIM under different modelling scenarios
Mansour Esnaashary Esfahani
a,1, Christopher Rausch
a,*, Mohammad Mahdi Sharif
a, Qian Chen
b,*, Carl Haas
a, Bryan T. Adey
baDepartment of Civil and Environmental Engineering, University of Waterloo, ON, Canada
bInstitute of Construction and Infrastructure Management, ETH Zurich, Stefano-Franscini-Platz 5, Zurich 8093, Switzerland
A R T I C L E I N F O Keywords:
Building Information Modelling (BIM) As-built information
Scan-to-BIM Manual Modelling Semi-automated Modelling
Primary and secondary building objects Accuracy
Precision
A B S T R A C T
Accurate as-built information is required to operate, maintain, and adapt existing buildings. Scan-to-BIM has become a feasible approach for collecting and modelling 3D as-built information and has three phases: (1) scanning, (2) registration, and (3) modelling. This paper focuses on the modelling phase, which can currently be conducted either manually or semi-automatically. As-built conditions of a building are surveyed, and the ge- ometry is modeled in a series of modelling scenarios. For each trial, geometric dimensions of the BIMs are compared to ground truth dimensions. This paper assesses the impact of levels of automation and modeller training on the accuracy and precision of generated BIMs. Quantitative models are developed for modelling scenarios using empirical datasets. Lastly, the impacts of degrees of accuracy are discussed. This study provides insight into the dimensional certainty of BIMs generated by Scan-to-BIM and helps decision-makers assess the risk of decisions made based on this information.
1. Introduction
Owners and project teams need up-to-date, accurate and complete as-built information to conduct performance assessments of existing buildings, schedule maintenance and repair works, plan for adaptation projects, and perform decommissioning decision support for building’s end-of-life [1–4]. Despite its importance, as-built information is often unavailable and as-designed information is no longer representative of site conditions. This is because buildings and facilities are typically not built exactly to as-designed drawings due to construction errors, toler- ances, and scope changes during the design and construction phases.
Even though construction is completed in accordance with as-designed drawings, these drawings are not commonly updated to reflect the as- built status associated with renovation and maintenance works [5–9].
Besides, the traditional ways of collecting as-built information, such as tape measures, range finders, and total stations, are time-consuming, labor-intensive, and highly error-prone, especially when the geometry of a facility or building is complex. The difficulties to get updated, ac- curate and complete as-built information ultimately impose high costs for owners and project teams [1]. Automated data collection and
modelling methods are desired by owners and project teams to address the difficulties in obtaining and staying informed of accurate as-built information.
Although current practices heavily rely on 2D drawings to store and communicate as-built information, construction practitioners have managed to explore the potential of 3D Building Information Models (BIMs) as parametric representations and repositories of as-built infor- mation [10]. It has been shown that reviewing MEP designs can reduce the project cost by 2.91% by detecting more clashes during the design phase [11] and using 3D BIMs for selecting optimal economic con- struction alternatives can reduce project cost by 17% [12]. The addi- tional benefits of using 3D BIMs include decreasing the amount of Requests for Information (RFIs) over the project lifecycle, improving the communication and relationship between different stakeholders, and maximizing the reuse of existing materials during adaptation projects by facilitating the design for disassembly [5,13–17].
Despite the potential of using the 3D BIMs as a central data re- pository, significant challenges remain in the generation of accurate 3D BIMs to reflect the as-built status of projects. Using 3D as-built data acquisition technologies (e.g., laser scanners and range cameras) to feed
* Corresponding authors.
E-mail addresses: chris.rausch@uwaterloo.ca (C. Rausch), chen@ibi.baug.ethz.ch (Q. Chen).
1 Deceased Jan 8 2020.
Contents lists available at ScienceDirect
Automation in Construction
journal homepage: www.elsevier.com/locate/autcon
https://doi.org/10.1016/j.autcon.2021.103686
Received 19 December 2020; Received in revised form 24 February 2021; Accepted 22 March 2021
information into BIM modelling software provides opportunities of automatically and accurately generating 3D BIMs with reduced acqui- sition time and transcription errors [18]. They provide data in the form of 3D point clouds, which contain a higher level of detail, ensure an acceptable level of accuracy, and provide better visualization of as-built conditions. However, this raw data format does not inherently provide semantic information, topology, categories (e.g., walls, windows), or materials of building components [19]. To enrich the semantic infor- mation, subsequent processing is required for converting point clouds to objects recognized in 3D BIMs, also referred to as Scan-to-BIM. Many researchers have developed comprehensive Scan-to-BIM frameworks and streamlined it with three steps: (1) scanning (i.e., data collection), (2) registering scans into a unified global coordinate system, and (3) modelling [18,20,21]. These steps have been widely adopted as a standard practice in various case studies to enhance owners’ and project teams’ capabilities to obtain as-built information for different applica- tions. Example applications include indoor mapping [22,23], quality control [24], and progress tracking assessment [7,8]. Depending on the specific use cases and modelling purposes, the efficiency and accuracy of generated 3D models vary along with the level of modelling details.
Numerous studies have claimed an overall accuracy over 95% for 3D BIMs generated by Scan-to-BIM, but the inevitable errors remain an open challenge for the models with high detailing requirements and tight engineering tolerances [21,25]. Errors can be incurred at each step, influencing the accuracy of developed 3D BIMs as the final product of Scan-to-BIM [18]. Some researchers have investigated the impact of scanning and registration on the accuracy of generated BIMs, such as the negative discontinuity effect of the spatial information, mixed pixel phenomenon, scanning range, and sensor calibration [25]. These studies help identify the sources of error and establish an accuracy benchmark for precise defect detection or alignment tasks. However, the third step – the modelling phase – has not been scientifically assessed for its impact on model accuracy and precision. Modelling can be conducted either manually or semi-automatically; the former being influenced by mod- eller subjectivity, while the latter is limited in its ability for exhaustive generation of a BIM.
Considering that the majority of efforts during the Scan-to-BIM process are associated with this modelling step [19,20,26], evaluating the tradeoffs between manual vs. semi-automated modelling precision and accuracy is particularly important for gauging the overall quality and fidelity of as-built information. Since the accuracy and precision of manual modelling is directly tied to the skill and judgment of modellers [5], modeller training has the potential to reduce the subjectivity of decision-making and thus improve overall precision and accuracy. The impact of modelling subjectivity can also be seen in industry with the development of BIMs for manifold use cases. For instance, a BIM developed for rough building area quantification will have very different assumptions and subjective decision-making than a BIM developed for very precise and accurate representation of building features such as standoffs, tie-in points, etc. This dichotomy creates challenges in in- dustry due to a lack of comprehensive standards and guidelines for the creation of BIM from scan-to-BIM processes. Currently, existing studies lack research on evaluating the impact of different modelling scenarios concerning the different 3D object types. This research fills this gap by demonstrating and quantifying the inconsistency and levels of impre- cision for developing a BIM object by various users with various as- sumptions while using the identical input data.
To help work towards a unified system for standardizing the outputs of Scan-to-BIM, this paper evaluates the variances and inaccuracies associated with both manual and semi-automated modelling for typical building systems (e.g., walls and duct systems). The impact of modeller training is investigated as a metric for two distinct objectives: (1) to quantify expected accuracy and precision improvements that can be garnered through modeller training, and (2) to quantify the range of variation associated with BIMs produced under different modelling scenarios and assumptions. The first objective is intended to facilitate
improvements within a specific repeatable workflow (e.g., how a particular firm using Scan-to-BIM can improve the accuracy and preci- sion of their 3D models), whereas the second objective is a proxy for working towards industry-wide standardization of BIMs across different workflows (e.g., understanding the variations of two BIMs produced for the same asset but under different workflows). The research presented in this paper does not seek to solve the problem of modelling errors but rather seeks to improve project stakeholders’ understanding of the extent to which modelling errors can be when different modelling sce- narios are adopted to generate 3D models using Scan-to-BIM.
The remainder of the paper is organized as follows. Section 2 reviews the state-of-the-art developments in the area of Scan-to-BIM including the automated modelling techniques and performance evaluation. Sec- tion 3 describes the methodology of evaluating the impact of modelling scenarios on the accuracy and precision of generated 3D BIMs. Section 4 shows the results of evaluation and Section 5 discusses potential im- plications of modelling accuracy for the use of Scan-to-BIM in industry.
The conclusions and future work are presented in Section 6.
2. Related work
Advancements of Scan-to-BIM research can be broadly grouped in two areas: 1) the state-of-the-art automated data acquisition and modelling techniques for Scan-to-BIM, and 2) the evaluations of Scan-to- BIM performance. Leading automated data acquisition techniques include photo/video-grammetry, terrestrial laser scanning, 3D video camera ranging, and Simultaneous Localization and Mapping (SLAM).
When the data is collected, manual modelling and semi-automated modelling techniques have been used to generate parametric models.
Depending on the model complexity, the choice of the modelling tech- niques vary, and the accuracy and precision of generated models vary accordingly. Despite the current advancements, no studies to date have provided viable and accurate assessments of the impact of the modelling procedure on the accuracy and precision of generated 3D BIMs. The detailed review is provided in the following subsections.
2.1. State-of-the-art techniques for Scan-to-BIM
2.1.1. Automated data acquisition techniques for Scan-to-BIM
State-of-the-art 3D as-built data acquisition techniques are typically non-contact and optical techniques that can collect required point data in a relatively short time for construction and civil engineering projects [27]. Examples of well-known acquisition techniques include photo/
video-grammetry, terrestrial laser scanning, 3D video camera ranging, and Simultaneous Localization and Mapping (SLAM).
Photo/video-grammetry features 3D reconstruction based on the 2D location of a point in two different images, position and orientation of the camera, and distortion of the camera’s lens [2,27,28]. Zhu and Brilakis [27] concluded from a comparison study that photo/video- grammetry is a relatively low cost, portable, and low-skill option for data acquisition for civil infrastructures. However, this technique typi- cally only generates a sparse point cloud which proves challenging for generating a detailed geometrical as-built model. In contrast, a terres- trial laser scanner (TLS), e.g., a phase-based scanner or a time-of-flight scanner, has sufficient capability to provide dense point clouds for complex geometry by surveying the 3D coordinates of the points on objects’ surfaces within the scanner’s view range (line-of-site), as demonstrated in numerous studies [5,27–29]. It can be used to capture objects as far away as hundreds of meters, while keeping the accuracy on the order of few millimeters. Several experimental studies have shown that TLS is much too costly, requires heavy computation to process dense point cloud data [30], and cannot capture transparent surfaces (e.g., building facades) or dynamic scenes [31].
To address the challenge of capturing dynamic scenes, 3D video camera ranging can be used to record images with data update rates more than 25 frames/s and is faster than TLS [16,27]. Nonetheless,
Kalantari and Nechifor have claimed in their studies that it does not provide sufficient density of the point cloud and is rather limited in the reading range (less than 10 m), which makes it impractical for capturing as-built conditions of building exteriors [22]. By combining these techniques with mobile platforms, Kim et al. have adopted Simultaneous Localization and Mapping (SLAM) to further allow continuous scanning and registration [32]. Typical performance of existing SLAM systems is on the order of a few centimeters accuracy.
Since buildings are usually large, long-range measurements and a dense point cloud are required to capture their as-built conditions. With these known techniques, it is widely accepted that the most suitable and available technique for collecting as-built data of buildings with acceptably high accuracy and speed is from TLS [29].
2.1.2. Modelling techniques for Scan-to-BIM
Manual and semi-automated modelling techniques have dominated Scan-to-BIM modelling practices, almost all of which depend on human intervention to ensure the quality of generated models. Depending on the modelling purpose (e.g., modelling indoors or outdoors and modeled object types), the choice of the modelling techniques vary, and the ac- curacy of generated models vary accordingly.
Manual modelling is often conducted in BIM authoring software (e.
g., Autodesk Revit®, and Tekla®) that allows users to manually fit 3D geometric primitives directly to the point clouds [5]. Mainstream studies [5,19,33] have presented two fitting approaches: one is the use of pa- rameters for fitting objects to the point clouds based on visual corre- spondence of the 3D projections of the cloud and the object on the 2D screen to the 3D point cloud and the other is the use of 2D shapes (e.g., rectangle, circle, etc.) fitted to the points visually corresponding to the perimeter of a certain object in horizontal or vertical cross-section views. Those studies also indicated the considerable labor-intensive work to be done in terms of specifying how long the shapes should be extruded to create volumetric objects, which are visually aligned to the objects’ corresponding points in the 3D scene. A recent study by Agapaki et al. [20] have found that although manual modelling is very simple for modellers and its computational cost is relatively low, errors can be introduced when modelling objects that do not follow the ideal or per- fect geometric shapes (e.g., skewed or out of plumb walls).
In contrast to manual modelling that relies heavily on visual align- ment, automated modelling makes use of many advanced algorithms from computer vision domain. Numerous studies have reported three main tasks of automated modelling: (1) spatial correlation (meshing or grid generation) - creating a 3D surface model representative of the overall topology of the scanned facility [19], (2) object feature recog- nition - detected objects in the point cloud using shape-based approach (by detecting object shapes [21,33–36]) or material-based approach (by detecting objects’ texture and structure [37]) and (3) object classifica- tion and size fitting - using automated algorithms to search along the available bank of parametric elements (e.g., walls, windows, doors, pipes, and structural elements) and fitting the best element to the recognized object the maximum conformance [5,19,33]. The perfor- mance of object recognition is directly tied to the accuracy and density of the 3D surface model (input), which in turn influences which repre- sentation scheme needs to be used. Since current automated modelling techniques still rely on manual inputs to complete the generation of a BIM, its efforts can be described as “semi-automated” at best [38].
2.2. Evaluation of Scan-to-BIM performance
For building facilities, point clouds with high accuracy and density are required to describe the detailed information of building compo- nents. There are many inaccuracies and inefficiencies associated with each of the Scan-to-BIM steps that lead to an inaccurate deliverable: the generated as-built 3D BIM. Errors accrued during scanning and data processing stages cause a higher registration error, which in turn leads to inaccuracies during the modelling stage. Regardless of the different
capabilities of data acquisition techniques, the complex environment in the construction site causes outliers, occlusions, and uneven density of points and disturbances in a point cloud. A number of existing related studies discuss how scanning and registration affect the quality of generated models [2,18,27,39,40]. However, there are no known sub- stantive studies that investigate the impact of different modelling sce- narios on the accuracy and precision of generated 3D BIMs.
The accuracy of sensed 3D data is tied to different factors during the scanning step. The calibration of the TLS is an influential factor. Devices should be calibrated periodically to keep their accuracy at the same level as the manufacturer’s claims [18]. In addition, the accuracy is usually subject to environmental conditions including windy weather, high amount of light, reflective surfaces (e.g., windows), and dynamic scenes [2,18,27]. Displacement of the scanner (while the scanner is operating) caused by wind or human interaction, has a dramatic effect on the ac- curacy of the scanning phase. The mixed-pixel phenomenon is another factor influencing the scanning accuracy, which happens when corners of objects are scanned or an object is thinner than the laser beam [18,41]. Errors associated with the registration phase are either related to recognizing the common targets between the consecutive scans or are based on the distribution of targets throughout the scanning site and their distance from the scanner [3,18].
Many researchers have used recall and precision as the two in- dicators to measure the accuracy of 3D BIMs produced from point clouds in TLS. Recall is usually understood as the true positive (correct) rate of the modelling results of the required objects and precision is defined in those studies as percentage of positive (correct) predictive values. For example, Rabbani et al. [39] detected pipes in two sample datasets with 60% recall and 89% precision. Perez-Gallardo et al. [40] detected cyl- inders with 86% precision and 92% recall. Agapaki et al. assessed the recall performance of EdgeWise® for modelling cylindrical objects.
Based on their experiment, the average recall of this software for cy- lindrical objects is 75%. Recall can be decreased when the point cloud is noisy and cluttered, and the objects are occluded by some obstacles [20]. These studies (like others), though seminal and important, do not elaborate on the importance of different modelling techniques during the modelling step to affect the accuracy of 3D BIMs.
Geometry modelling is often the bottleneck of the modelling step, taking up to 90% of the total modelling time [26] and contributed significantly to the accuracy and precision of final modelling results.
Simple objects (e.g., walls, ceilings, floors) are modeled parametrically, while objects with complex geometry (e.g., decorative carvings) are modeled either non-parametrically using triangle meshes or based on a database of known objects which were already modeled [42]. To finalize 3D BIMs, material properties and specifications are linked to geometry and the topological relationships (e.g., connectivity, adjacency, and membership) between objects and between objects and spaces are established [5,19]. The errors accrued during these activities can affect the accuracy of the created model, however, no studies to date have provided viable and accurate assessments of the impact of the modelling procedure on the accuracy and precision of generated 3D BIMs.
In addition, inaccurate BIMs can influence the accuracy of con- struction progress tracking, and the reliability of structural health monitoring to assess the risks associated with infrastructures [43,44].
Other impacts of BIM inaccuracies can include structural integrity issues (e.g., if walls, components or other load-bearing objects are analyzed/
assessed based on inaccurate BIM information), poor aesthetics (e.g., if objects are installed according to inaccurate BIM information, leading to undesirable joints and connection details), and time wasted to properly locate objects and components that were not digitized into a BIM soft- ware with the required accuracy. Therefore, there is a need to assess and verify modelling accuracy for unique needs and cases.
2.3. A summary of related work
Although high-precision scanning devices and automated algorithms
have been developed for Scan-to-BIM, building objects cannot be all categorized with adequate accuracy nor can object topology be perfectly established. The assistance of human modellers is nevertheless required to model missing objects, modify or replace incorrectly modeled objects, categorize objects, and correctly define topology [19,20]. Since the process of manual modelling is time-consuming, labor-intensive, often subjective, tedious, and needs skilled modellers, an alternate approach can be utilized [45]. Advanced recognition and fitting algorithms have been developed in the computer vision society to help automate the modelling step. However, this has not been fully realized yet to fit the construction domain and since different levels of human intervention is still required, this process is semi-automated at best [5,21,38]. This is due to the proliferation of complex object geometry, clutter and occlu- sions contained in many construction environments. Manual and semi- automated modelling techniques still dominate the current Scan-to- BIM applications and thus the accuracy and precision of generated 3D BIMs need to be carefully studied.
It is still unclear exactly how different modelling techniques and scenarios can affect the final deliverable of Scan-to-BIM. Therefore, quantitative analysis of the impact of modelling is needed by owners and project teams to ensure the adequate accuracy and precision of 3D BIMs generated from the appropriate modelling techniques. Furthermore, since BIMs can be produced for manifold use cases and according to a range of different modelling approaches, gauging a typical range of variations associated with Scan-to-BIM deliverables is likewise impera- tive and valuable to investigate.
3. Methodology
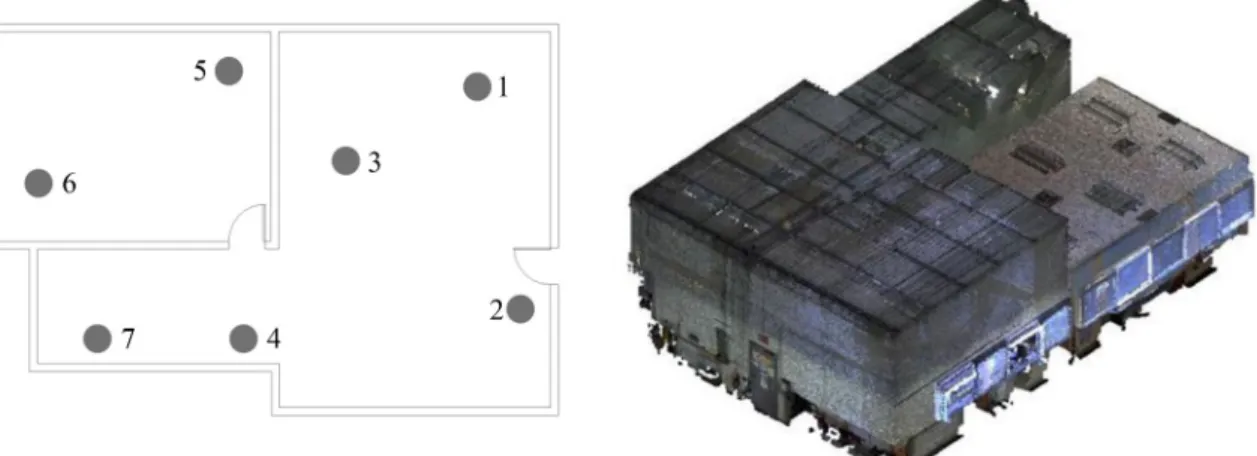
The proposed methodology consists of conducting a quantitative analysis of different Scan-to-BIM outputs for a simple building assembly comprised of primary building objects (e.g., floor, walls, ceiling) and secondary building objects (e.g., ducts and pipes). A test-case was used, whereby a point cloud of a small laboratory in the University of Wa- terloo (Fig. 1) was captured by a terrestrial laser scanner (Faro Focus M70 which has a ranging accuracy of ±3 mm and includes RGB coloring of the point cloud for visualization) and used to develop BIMs in five unique modelling scenarios [46]. These scenarios correspond to different manual and semi-automated techniques as described in the proceeding subsections.
The ground truth dimensions of the walls and duct system were measured by a laser distance meter (the manufacturer’s stated accuracy is 1 mm up to a range of 20 m) and considered as a baseline for assessing the modelling error. In particular, the ground truth dimensions of the walls were measured using the interior surfaces (i.e., visible surfaces as seen when standing within the room). Likewise, the ground truth di- mensions of the duct system were measured using the outer surfaces (i.
e., again, visible surfaces as seen when standing within the room). The purpose for using visible surfaces (as seen when standing within the room) as ground truth metrics is to coincide with the data produced by the TLS – which also captures these visible surfaces when standing within the room. Once the dimensions of the models are compared to ground truth dimensions, the difference is taken as the modelling error.
The standard deviation and average absolute modelling error associated with a model are used to infer precision and accuracy, respectively. As
such, the higher the average absolute error and standard deviation, the lower the accuracy and precision. Fig. 2 and Fig. 3 show the ground truth dimensions of the walls and ceiling elevation, and duct system, respectively.
3.1. Data collection 3.1.1. Manual modelling
In this study, manual modelling is defined as the process of visually superimposing parametric objects onto their corresponding locations in the scan point cloud. To manually model an object in Autodesk Revit® 2019 (software package used by the participants of this study), the following three steps need to be performed: (1) selection of the object of interest (e.g., a wall with a 300 mm thickness), (2) positioning the part in section view, and (3) positioning of the object in the plan view. The sequence of steps 2 and 3 can be iterated as needed. A sample of 25 modellers was tasked with developing BIMs in three modelling sce- narios. Modellers were selected among graduate and undergraduate students within the Department of Civil and Environmental Engineering, all of whom had a proficient understanding of BIM, Revit software, and point cloud analysis and manipulation. The University of Waterloo Of- fice of Research Ethics oversaw and provided approval for the process of carrying out this experiment. The following three subsections describe the details of each modelling scenario.
3.1.1.1. Scenario one: manual modelling of primary objects before training the modellers. In this scenario, modellers were provided with the point cloud of the case study and asked to model the walls and set the ceiling elevations (no training or modelling instruction was provided). Mod- ellers were, however, instructed to use a specific wall object with a consistent thickness in order to keep variability of modelling confined to the primitive fitting process. The ground truth thickness of the interior walls (walls KL and LI from Fig. 2) was measured as 200 mm. Therefore, a default wall object with 200 mm thickness was used by all the modellers.
3.1.1.2. Scenario two: manual modelling of primary objects after training the modellers. In this scenario, modellers were provided with training and then tasked with re-modelling the same objects as scenario one. The instructions given included a step-by-step video guide including setting up user-defined coordinate systems, best practices in defining proper section/plan views, and best practices for visually placing objects onto point clouds.
3.1.1.3. Scenario three: manual modelling of secondary objects. In this scenario, modellers were tasked with modelling the duct system. The diameter of ducts was provided to modellers prior to development of BIMs, so that the only factor being assessed was the length of each component. The sizes of ducts in this duct system were (1) the large main duct with 400 mm diameter, and (2) the small ducts connected to the large duct with 250 mm diameter. This scenario also involved up-front training with best practices for defining proper section/plan views and visual placement of objects on the point cloud. Due to the similarities between the training for the primary and secondary objects, this sce- nario was not preceded by an initial pre-training dataset since the modellers could not be objectively considered to have the same degree of “non-training” as in the first scenario. As such, the purpose for this scenario was to compare manual to semi-automated modelling of sec- ondary (i.e., more geometrically complex) objects.
3.1.2. Semi-automated modelling
EdgeWise® software was used in this study for semi-automated modelling. This software uses iterative algorithms (e.g., RANSAC) to remove outlier points from the point cloud and to find the parameters associated with objects (e.g., the thickness of the walls and diameter of Fig. 1. Panoramic view of the interior of the case study (upper) and captured
point clouds (lower).
the cylindrical ducts). Given the stochastic nature with which BIM object extraction occurs within this software (like many other algorithmic approaches), the authors ran this software numerous times to assess the dimensional variance of results. A total of 25 trials were conducted for both primary and secondary objects, to correspond to the size of the manual modelling dataset.
3.1.2.1. Scenario four: semi-automated modelling of the primary objects.
In this scenario, the point cloud of the case study was used to develop a sample of 25 BIMs from primary objects. “Level of detail” (ranging from low to high) is the parameter within Edgewise® that changes the quality of planar surface extraction. Tuning this parameter does not impact planar object extraction in a point cloud with predominately flat and simple features. On the other hand, this parameter produces very different results for bespoke architectural objects that are not perfectly flat or have random shapes jutting out from the objects. Setting a higher level of detail will force the software to extract fine details of the objects, while setting a low level of detail will force the software to dimension- ally “smooth out” the objects. In this study, a medium level of detail was used for extracting the planar surfaces since primary object features were predominately flat.
3.1.2.2. Scenario five: semi-automated modelling of the secondary objects.
The duct system point cloud was used to develop a sample of 25 BIMs for secondary objects in this scenario. The minimum number of points to detect a cylindrical object, and distance tolerance are two parameters that should be set to extract cylindrical objects. The minimum threshold of the software is 50 points to extract cylindrical objects. Setting a low value for this parameter causes noisy and erroneous features to be
detected as cylindrical objects [73]. Therefore, the default value (80 points) was used for this parameter to reduce noisy results and maintain the accuracy of extracted objects. The distance tolerance is the maximum distance from a cylinder at which a 3D point can be still considered as a point related to the cylinder. Since a terrestrial laser scanner with a high level of accuracy and low noise was used in this study, the default value, 0.7 mm, was used for this parameter.
3.2. Quantitative model
After creation of BIMs, the dimensional error of objects of each trial (i.e., BIMs produced by either manual or semi-automated approaches) were calculated. Previous studies quantifying dimensional errors in construction have relied upon using the normal distribution function as a starting point [47,48] and further justify or refute this fit according to a regression analysis. The coefficient of determination, R2 (0 ≤R2 ≤1) indicates how well a particular distribution can be fit to a data set. The closer R2 is to 1, the higher reliance that a dataset can be predicted using a given distribution, assuming such data is represented by random explanatory variables [49]. In this study, the trial datasets had an R2 of 0.93, indicating the normal distribution has a sufficient level of accuracy for predicting the observed modelling error. The average probability of each sample (i.e., 25 trials of each scenario) was calculated for the error ranges starting from ±5 mm and increased by 5 mm increments (e.g.,
±10 mm, ±15 mm), up to an error range of ±300 mm since this range captures the entire cumulative probability range. The average sample probability of a given error range is calculated by
Pavei,j ( − 5j≤Ed≤5j) =
∑25
k=1
(pi,j,k(Ed≤5j) − pi,j,k(Ed≤ − 5j))
25 (1)
where Pi, jave is the average sample probability of scenario i (0 <i <5), and error range interval j (1 <j <60), Ed is the error of a given dimensional measurement and k is the number of trials in each scenario from 1 to 25.
To extend the application of this quantitative model to the entire statistical population of each scenario (i.e., all human modellers or semi- automated software runs), statistical tests are conducted. These tests predict the upper and lower confidence limits of the interval where the mean of the entire population can be fitted based on the mean of a given sample (Pi, avej). Since the sample size (25 trials) is less than 30, and the standard deviation of the population is unknown, a t-test is used to calculate the probability limits corresponding to each error range in each scenario. A 95% confidence interval was considered in this study and the following quantitative metrics are enumerated: (1) the mean of the error range (Pi, jave), (2) the upper limit of the error range (Pi, jmax), and (3) the lower limit of the error range (Pi, jmin). The upper and lower limits of each error range are calculated by
Fig. 2. Ground truth dimensions of the walls and ceilings elevation.
Fig. 3. Ground truth dimensions of the duct system.
Pmaxi,j =Pavei,j − t.inv((1− α),n− 1)*Si,j̅̅̅
√n Pmini,j =Pavei,j − t.inv(α,n− 1)*Si,j̅̅̅
√n
(2)
where n is the sample size (n =25), t. inv is the inverse of t function, α is the confidence interval and Si, j is the standard deviation of probabilities of each sample associated with scenario i and error range interval j, which is calculated by
Si,j=
̅̅̅̅̅̅̅̅̅̅̅̅̅̅̅̅̅̅̅̅̅̅̅̅̅̅̅̅̅̅̅̅̅̅̅̅̅̅̅̅̅̅̅̅̅̅̅̅̅̅̅̅̅̅̅̅̅̅̅̅̅̅̅̅̅̅̅̅̅̅̅̅̅̅̅̅̅̅̅̅̅̅̅̅̅̅̅̅̅̅̅̅̅̅̅̅̅̅̅̅̅̅̅̅̅
⎛
⎜⎜
⎝
∑25
k=1
((pi,j,k(Ed≤5j) − pi,j,k(Ed≤ − 5j))
− Pavei,j )2
n− 1
⎞
⎟⎟
⎠
√√
√√
√√
√ (3)
Conducting a statistical assessment is particularly useful for addressing the objective of this research since it establishes a rough level of confidence associated with the accuracy of BIMs that are produced under the following scenarios: untrained modellers, trained modellers, and semi-automated modelling software. It should be noted that while the generation of BIMs by untrained modellers within industry may not be prolific, a far more likely scenario is BIMs produced under different methodological assumptions with respect to level of accuracy. By beginning to quantitatively discriminate between the approaches used for scan-to-BIM, it will be possible to establish rough benchmarks for accuracy, precision and associated levels of confidence.
4. Results
This section presents experimental results associated with different modelling scenarios. The results of each scenario are compared together to describe the impacts of modeller training and levels of automation on the accuracy and precision of developed BIMs for primary and secondary objects.
4.1. Experimental results
Dimensional error graphs are constructed for the modelling error of each wall or duct element obtained from different scenarios. The range of error associated with each wall or duct is visualized using box and whisker charts (included in Appendix). Average absolute error, and standard deviation are also calculated for each dataset and shown on the box and whisker chart as an indicator of the modelling accuracy and precision.
Quantitative assessment of modelling scenarios proceeds with enumeration of the following key metrics (as introduced in Section 3.2):
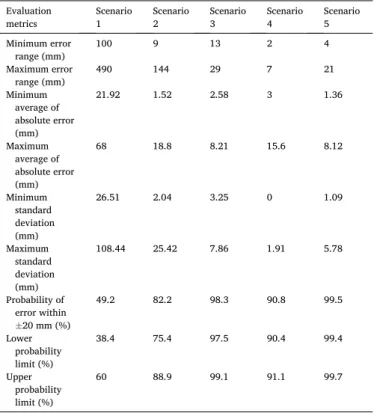
error range, average absolute error, standard deviation, and level of confidence intervals. Since each scenario has 25 datasets (i.e., 25 distinct BIMs generated), maximum and minimum values are reported for error range, average absolute error, and standard deviation. Level of confidence measures is computed for the entire population, for which it is desirable to quantify the probability that a random element dimension from a BIM is contained within an error range of ±20 mm. Level of confidence is reported in terms of the average probability that a BIM element dimension is contained within this threshold (i.e., Eq. (1)), and upper and lower 95% confidence limits (i.e., Eq. (2)).
A summary of these key metrics is presented in Table 1, which functions as a quick overview of the impacts of different modelling scenarios on the accuracy and precision of generated BIMs. Take the first scenario as an example; the range of modelling error varies from 100 mm for ‘level 1’ dimension to 490 mm for the wall DE, respectively. The highest and lowest average absolute error is 21.92 mm (level 1) and 68 mm (wall EF), respectively. The modelling accuracy is the highest for
‘level 1’ is the lowest for wall EF. The standard deviation of the modelling error is between 26.51 mm (‘level 1’) and 108.44 mm (wall EF), which corresponds to the highest and lowest precision, respectively.
The probability that a primary object is modeled within a ±20 mm error range is equal to 49.2% with upper and lower confidence limits of 60%
and 38.4%, respectively.
4.2. Comparison of Modelling scenarios
To compare the modelling scenarios and assess the impacts of modeller training and levels of automation on the precision and accu- racy of BIMs, the average absolute error and standard deviation asso- ciated with wall and duct elements are graphically depicted (see Fig. 4 to Fig. 7).
The results of the first and second modelling scenarios were compared to investigate the impact of modeller training on the accuracy and precision of the BIMs developed for primary objects. According to this comparison, training significantly improved the accuracy and Table 1
Evaluation metrics for different modelling scenarios on the accuracy and pre- cision of the generated BIMs.
Evaluation
metrics Scenario
1 Scenario
2 Scenario
3 Scenario
4 Scenario
5 Minimum error
range (mm) 100 9 13 2 4
Maximum error
range (mm) 490 144 29 7 21
Minimum average of absolute error (mm)
21.92 1.52 2.58 3 1.36
Maximum average of absolute error (mm)
68 18.8 8.21 15.6 8.12
Minimum standard deviation (mm)
26.51 2.04 3.25 0 1.09
Maximum standard deviation (mm)
108.44 25.42 7.86 1.91 5.78
Probability of error within
±20 mm (%)
49.2 82.2 98.3 90.8 99.5
Lower probability limit (%)
38.4 75.4 97.5 90.4 99.4
Upper probability limit (%)
60 88.9 99.1 91.1 99.7
Fig. 4.Average absolute error for primary object modelling.
precision of the models, as would be expected. On average, modeller training decreased the standard deviation and average absolute modelling error by 330% and 260%, respectively. Fig. A.6 (in Appendix) illustrates the average absolute modelling error related to each modeller before and after training. Although the impact of this training was considerable for most of the modellers, the effects were notably negli- gible for some of them (e.g., modellers 3, 9, 10, 11, 12, 23). In these cases, the instructions given to modellers likely corresponded to the same approach used in the initial modelling and these modellers likely already had more extensive experience with scan-to-BIM processes.
Although the impacts of modeller training were not directly investigated for secondary objects (i.e., training instructions were given upfront for this experiment, without conducting a pre- and post-training evaluation as was done for primary objects), it can be reasonably expected that modeller training would follow a similar trend for improving the accu- racy and precision of modelling. Again, it should be noted here that while training of modellers is explicitly investigated in this case study, training is also used as a proxy for quantifying the range of error asso- ciated with different modelling assumptions (and that there always be some variability in the final BIM depending on the modeller’s judgment).
Since point clouds inherently have noise, and since no as-built con- struction elements prescribe to a perfect parametric representation, the assumptions made for modelling have a direct impact on resulting ac- curacy2 and precision across modeller datasets. For instance, the modelling of a wall element might be based on the assumption that the
‘innermost point of the wall’ is used to fit a plane, whereas other similar assumptions could be made based on the ‘outermost’ or ‘average’ points of the wall. As depicted in Fig. 8, the choice between the outermost and innermost wall points can result in a 40 mm difference for wall EF. This difference is enough to describe the range of error observed in most of the modelling datasets. As such, training may not only correspond to how well a wall element is modeled, so much as it functions as a way to establish a consistent modelling approach. In other words, while the benefit of modeller training may be an obvious way to improve the ac- curacy and precision of BIMs, it is also used in this research to showcase the range of error expected in different modelling approaches.
For the primary objects, using semi-automated modelling software considerably increased the accuracy and precision of the BIMs in com-
parison with manual modelling before training (see Fig. 4 and Fig. 5). On average, accuracy and precision were increased by roughly 335% and 6570%, respectively. In contrast, the difference was not as significant when semi-automated modelling results were compared with manual modelling after training. The accuracy of semi-automated modelling was only 20% higher on average than manual modelling after training.
On the other hand, the precision of semi-automated modelling was 1455% higher than manual modelling after training, which presents a significant improvement. For the secondary objects, the accuracy and precision of the semi-automated and manual modelling were relatively similar, though semi-automated modelling showed slightly higher ac- curacy and precision (see Fig. 6 and Fig. 7). The average accuracy and precision of semi-automated modelling were 9% and 36% higher than manual modelling, respectively.
In general, the accuracy and precision of semi-automated modelling are higher than manual modelling. This advantage is more dominant when adopting a semi-automated method for modelling the primary objects. This is primarily because semi-automated modelling employs mathematically derived processes which are iteratively tested and cali- brated. However, it is worth noting that the semi-automated method is not always perfect in providing high precision. The randomness of point cloud data can translate into the randomness of employing the mathe- matical functions, leading to dimensional errors in the generated 3D BIMs. In some cases, human neural systems can be more precise than a semi-automated or mathematically derived method. Factors that could make a semi-automated approach less precise include randomness in point cloud down-sampling or the degree of stochasticity in the func- tions. For example, if the function rand() is multiplied by a function, it will be less precise than if a deterministic term or a factor is multiplied by that same function. Additionally, in the context of construction, many elements still cannot be reliably modeled using semi-automated methods.
According to the overall average absolute error and standard devi- ation of each modelling scenario (Fig. 9), both the manual and semi- automated modelling approaches had higher accuracy in modelling the secondary objects. This likely stems from the quality of the point cloud. Since there were obstacles (e.g., shelves, tables and furniture) close to the walls (primary objects), the point cloud was very noisy and cluttered. This is also in line with the experimental results; according to Fig. 9, the accuracy of manual and semi-automated modelling of the secondary objects was on average 112% ((10.65–5.03)/5.03 =1.12) and 93% ((8.85–4.59)/4.59 = 0.93) higher than primary objects, respec- tively. Regarding manual modelling (after training), the precision of modelling the secondary objects was 162% ((13.77–5.26)/5.26 =1.62) higher than precision of the primary objects. In contrast, the duct system (secondary objects) is hung from the ceiling where there were no ob- stacles in the general vicinity. Therefore, the point cloud for these ob- jects was less noisy, making it easier to reconstruct the 3D objects. For manual modelling, the precision of modelling the secondary objects is higher than that of primary objects. The reason is related to the dimensional variability of objects. Walls have more dimensional vari- ability (particularly the difference in scale) than ducts, which makes it difficult for the modellers to have a consistent interpretation from the point cloud. For semi-automated modelling, the precision of modelling the secondary objects is less than that of primary objects. Part of the reason is related to the performance of the type of algorithm that EdgeWise® uses for detecting and modelling the walls and cylindrical objects. It can be interpreted that the algorithm used for modelling the walls is more rule-based and less iterative than the algorithm used for modelling cylindrical objects.
5. Implications
3D BIMs are favored as a single centralized digital collection of geometric and semantic information. However, in practice the genera- tion of models is often subject to varying levels of accuracy and precision Fig. 5.Standard deviation of error for primary object modelling.
2 The term accuracy is used loosely here, since constitution of ground truth can be subjective – e.g., ground truth could be the innermost, outermost, average, or other feature of wall object. However, the proceeding term precision is an objective measure since it does not directly depend on which ground truth measure is constituted.
which can lead to problems in project decisions when using this infor- mation. The experimental results and comparison of five distinct modelling scenarios quantitatively showed the extent to which the ac- curacy and precision of generated 3D BIMs can vary, which can be used for industry practitioners to better understand important aspects asso- ciated with scan-to-BIM.
First of all, the results of this study indicate that the precision of modelling secondary objects was higher than primary objects when manual modelling processes were adopted. The precision of manually modelling secondary objects was also satisfactory when compared with a semi-automated method. Therefore, for most practical cases, the owners of industrial facilities (i.e., which have prolific existence of cy- lindrical objects) should not ignore the importance of manual modelling processes when they require very accurate details on critical assets and equipment. More importantly, training sessions should be conducted for modellers as a unified way of creating a BIM when manual modelling techniques are adopted. This is an obvious conclusion; however, a much more significant factor lies not solely with modeller training (so as to
distinguish between good and poor modelling practices), but with establishing a consistent modelling approach. In other words, while the benefit of modeller training may be an obvious way to improve the ac- curacy and precision of BIMs, it is also used in this research to showcase the range of error expected in different modelling approaches. This is to ensure that each BIM produced by a given modeller is subject to a higher degree of precision and accuracy with respect to a constituted basis of ground truth.
From a multi-stakeholder coordination point of view, it is essential to establish a clear consensus on the required level of dimensional accuracy and detail (e.g., LOD 400 for fabrication and assembly). Selecting a consistent modelling method – either a manual or semi-automated method – can help stakeholders unify level of details and maintain the accuracy of 3D BIMs within an appropriate error range. For instance, clashes between subsystems can be avoided if 3D BIMs are modeled with the same level of details with high accuracy, which eliminates signifi- cant time and material waste for rectifying issues during the construc- tion stage. Ideally, if as-built data can be readily generated with a high Fig. 6. Average absolute error for secondary object modelling.
degree of accuracy (e.g., sub-millimeter), then nearly all the needs of stakeholders can be met.
In addition to precision and accuracy, it is worth noting that recall of semi-automated method (i.e., EdgeWise®) is lower than manual method (i.e., recall of human modellers is assumed as 100%) although its ac- curacy and precision are higher. However, the modelling time by EdgeWise® is considerably shorter than manual modelling. Considering the tradeoffs between the two methods, a hybrid modelling approach comprising both manual and automated modelling techniques could be an optimal solution for ensuring the inherent strengths of both methods can be harnessed.
6. Conclusion
Up-to-date and complete as-built information is required for oper- ating and maintaining existing buildings and designing for building adaptation projects. With the development of new technologies, scan-to- BIM has become a feasible approach for collecting updated as-built in- formation. The modelling phase is a current bottleneck in scan-to-BIM
and takes up the majority of the time required for this process. Model- ling can be conducted either manually or semi-automatically. This paper investigated the modelling phase and the impact that modelling of pri- mary and secondary building objects has on the dimensional accuracy and precision of BIMs. During this assessment, the impacts of human modeller training and levels of automation were investigated. Besides this main contribution, a preliminary quantitative assessment was con- ducted to estimate the probability of a given BIM element dimension that is contained within a pre-defined error range.
Based on the results of this research, modeller training was found to improve the average accuracy and precision of the BIMs of primary objects by 260% and 330%, respectively. Although the impact of mod- eller training was not investigated for secondary objects, it can be reasonably expected that modeller training would have a similar impact on improving the accuracy and precision of modelling the secondary objects. Semi-automated modelling software (EdgeWise®) was shown to increase the average dimensional accuracy and precision of modelling the primary objects by 20% and 1455% in comparison with manual modelling after modeller training, respectively. This improvement was Fig. 7. Standard deviation of error for secondary object modelling.
however only equal to 9% and 36% for accuracy and precision of the secondary objects, respectively. In addition, the accuracy of manual and semi-automated modelling of the secondary objects was on average 112% and 93% higher than primary objects, respectively. Regarding manual modelling (after training), the precision of modelling the sec- ondary objects was 162% higher than precision of the primary objects.
While this paper explicitly studied the impact that modeller training has on the accuracy of developed BIMs, this impact also translates into the distinct approach modellers use in different scan-to-BIM applica- tions. While the authors do not imply that most BIMs are prepared by novice or untrained modellers, they do contend that this training is re- flected in the assumptions (or approaches) various groups, companies or modellers use when preparing BIMs from point clouds. For instance, two very different BIMs (in terms of dimensional variation) can be developed from the same point cloud, based on different assumptions made during the modelling process. One BIM could be developed by a modeller who fits wall elements to the outermost wall points, while another modeller might fit walls according to innermost wall points. Depending on the intended purpose for such a BIM (e.g., one BIM may be used to establish
the maximum standoff length for installation of façade components, while the other BIM could be used to establish the maximum interior floor space), both approaches could be equally correct (i.e., accurate). As such, even if both modellers are adequately trained, the different ap- proaches and assumptions employed in each BIM can have widely different dimensional outcomes. This paper provides rough metrics for quantifying how much variation can be accrued in scan-to-BIM under different modelling scenarios for relatively simple BIM objects (e.g., walls, ceilings, pipes). There is a need for future research to unify or standardize factors that affect the accuracy and precision of BIMs. Such factors are critical when working towards a unified system for certifying scan-to-BIM outputs, which is becoming an increasing need within in- dustry. There is also a need to assess the impact of hybrid modelling (i.e., using manual and semi-automated software approaches) on the accu- racy, precision, and time required for modelling the BIMs and investi- gate the performance of this modelling approach on improving the recall rate.
In summary, the following recommendations are made from this work. First, there is significant value in standardizing manual modelling Fig. 8. Depiction of different assumptions used to model a wall element. The selection of points E and F in the model can be chosen based on outermost wall points (a) and (b), or innermost wall points (c) and (d), which result in significantly different final dimensions for wall EF as shown in (e).
processes in scan-to-BIM (which can be obtained through training, as addressed in this research, but also through process standardization within design firms). Second, for modelling primary building objects, automated modelling approaches can provide significant improvements to both accuracy and precision (along with time savings). Third, the difference between manual and semi-automated modelling of secondary building objects produced very little differences in terms of accuracy and precision. As such, the value for pursuing automation of such modelling tasks should be based predominately on time savings. Finally, there is a need for the industry to develop a unified process for certifying the outputs of scan-to-BIM in order to improve both accuracy and precision.
Declaration of Competing Interest
The authors declare that they have no competing financial or per- sonal interests that have influenced the research work reported in this paper.
Acknowledgement
The authors would like to acknowledge and dedicate this work to all passengers of Ukraine flight 752, including Mansour Esnaashary Esfa- hani. This research was supported by the Natural Sciences and Engi- neering Research Council (NSERC) along with Mitacs.
Appendix. Dimensional Error Charts for Modelling Scenarios
Fig. 9. Overview of the accuracy and precision of the modelling scenarios.
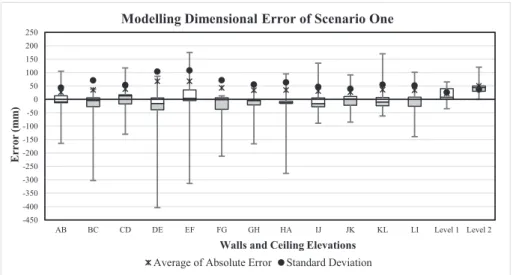
-450 -400 -350 -300 -250 -200 -150 -100 -50 0 50 100 150 200 250
AB BC CD DE EF FG GH HA IJ JK KL LI Level 1 Level 2
Error (mm)
Walls and Ceiling Elevations Modelling Dimensional Error of Scenario One
Average of Absolute Error Standard Deviation
Fig. A.1.Dimensional errors associated with manual modelling of primary objects before training the modellers (scenario one).
-150 -100 -50 0 50 100
AB BC CD DE EF FG GH HA IJ JK KL LI Level 1 Level 2
Error (mm)
Walls and Ceiling Elevations Modelling Dimensional Error of Scenario Two
Average Absolute Error Standard Deviation
Fig. A.2. Dimensional errors associated with manual modelling of primary objects after training the modellers (scenario two).
-30 -20 -10 0 10 20 30
d1 d2 d3 d4 d5 d6 d7 d8 d9 d10 d11 d12 d13
Error (mm)
Ducts
Modelling Dimensional Error of Scenario Three
Average of Absolute Error Standard Deviation
Fig. A.3. Dimensional errors associated with manual modelling of secondary objects (scenario three).
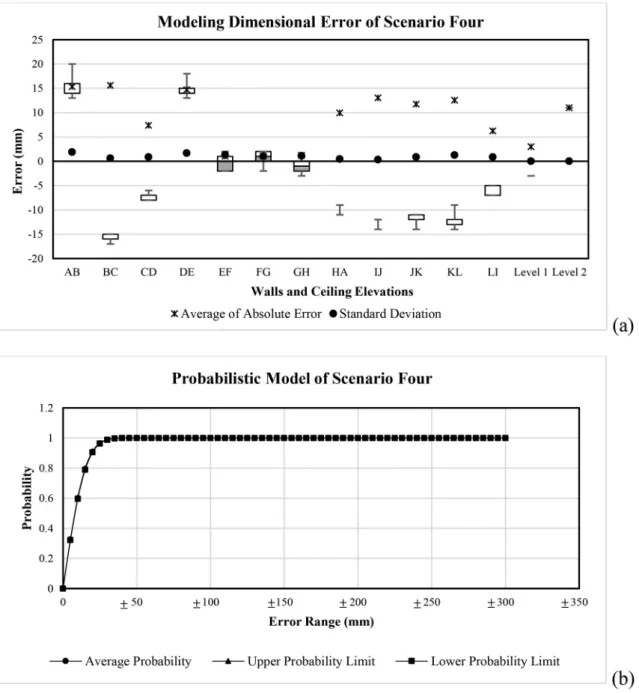
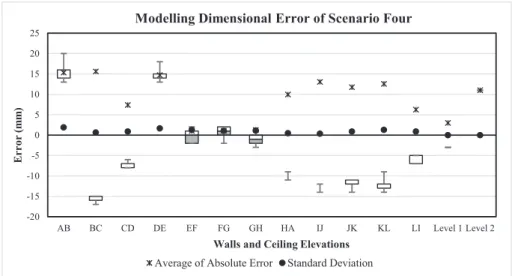
-20 -15 -10 -5 0 5 10 15 20 25
AB BC CD DE EF FG GH HA IJ JK KL LI Level 1 Level 2
Error (mm)
Walls and Ceiling Elevations
Modelling Dimensional Error of Scenario Four
Average of Absolute Error Standard Deviation
Fig. A.4. Dimensional errors associated with semi-automated modelling of primary objects (scenario four).
-15 -10 -5 0 5 10 15 20
d1 d2 d3 d4 d5 d6 d7 d8 d9 d10 d11 d12 d13
Error (mm)
Ducts
Modelling Dimensional Error of Scenario Five
Average of Absolute Error Standard Deviation
Fig. A.5. Dimensional errors associated with semi-automated modelling of secondary objects (scenario five).
0 20 40 60 80 100 120 140
1 2 3 4 5 6 7 8 9 10 11 12 13 14 15 16 17 18 19 20 21 22 23 24 25
Absolute Error (mm)
Modellers
Before Training After training
Fig. A.6.Effect of training on reducing absolute average error for primary object modelling.
Appendix. Supplementary data
Supplementary data to this article can be found online at https://doi.org/10.1016/j.autcon.2021.103686.