Essays on Economic Laboratory and Field Experiments
Inaugural-Dissertation zur
Erlangung des Doktorgrades der
Wirtschafts- und Sozialwissenschaftlichen Fakultät der
Universität zu Köln
2013 vorgelegt von
Diplom Volkswirt Felix Ebeling
aus Uelzen
Referent: Prof. Dr. Axel Ockenfels
Korreferent: Prof. Dr. Gerlinde Fellner
Tag der Promotion: 03.06.2013
Acknowledgements
The writing of this dissertation has been one of the greatest intellectual and personal challenges I have faced. It would not have been completed without the support, motivation and guidance of the following persons.
First, I thank my supervisor Axel Ockenfels for giving me the opportunity to work in an excellent academic environment and for guiding my research. His ideas, his knowledge and his commitment to the highest methodological standards inspired and challenged me and deepened my understanding of science.
I also thank Gerlinde Fellner for her valuable comments.
I thank my co-authors Gary Bolton, Gerlinde Fellner, Christoph Feldhaus, Johannes Fendrich, Axel Ockenfels and Johannes Wahlig for fruitful discussions and for close collaboration in our joint research projects.
I thank my present and former colleagues Julian Conrads, Christoph Feldhaus, Lyuba Ilieva, Jos Jansen, Sebastian Lotz, Johannes Mans, Julia Stauf and Peter Werner for the great working atmosphere, for countless discussions of academic, general and personal matters, and for making research fun.
I thank our student helpers, especially those supporting me conducting my field experiments. Furthermore, I would like to thank Krümel.
Finally, I am deeply grateful to my parents Lutke and Dorothee, my brother Florian, his
wife Alexandra and my brother Philipp for their support, patience and confidence. This
work is dedicated to you.
Table of contents
Part 1 Motivation and Research Questions 1
Part 2 Why do Defaults Work? - Evidence from a Natural Field Experiment
12
Part 3 Peer Pressure and Multi Tasking 40
Part 4 Follow the Leader or Follow Everyone – Evidence from a Natural Field Experiment
85
Part 5 On the role of endowment heterogeneity and ambiguity on conditional cooperation
125
Part 6 Information Value and Externalities in Reputation Building 145
Part 1
Motivation and Research Questions
The core theory used in (neoclassical) economics builds on simple but powerful assumptions on individual behavior. Individuals maximize their utility (function) which only depends on their own payoffs in a time consistent, framing independent manner.
Thereby, they accurately use all available information. 1 The core of behavioral economics is to refine these assumptions. It helps generate more realistic theories, make better predictions of field phenomena, and develop better policy suggestions. 2 This thesis is about behavioral economics. More precisely it is about experimental economics which represents a subarea of behavioral economics. In each part of my thesis, the main research method used to explore economic decision making is an experiment. Despite this methodological similarity, there is only a loose connection between different parts.
Parts differ in characteristics as (a) systematic behavioral anomaly explored, (b) exact experimental method used to explore the anomaly, and (c) application. In the following, I will give a short overview about my thesis by illustrating the mentioned characteristics as well as the basic results for each part. Before starting, I will first elucidate characteristics in more detail.
Even if individuals do not always respond to incentives in a way predicted by standard (neoclassical) theory, their behavior is not foolish. Rather, their deviations from standard theory follow their own (bounded) rationality and have certain patterns – they are systematic (Bolton & Ockenfels 2012). Systematic deviations / anomalies can be explored scientifically and in turn be categorized. DellaVigna (2009) suggests three types of anomalies: (a) nonstandard preferences e.g. fairness, (b) nonstandard beliefs e.g. overconfidence, and (c) nonstandard decision making e.g. framing dependency. I will also use these types for anomaly classification.
1
See DellaVigna (2009) p. 315.
2
See Camerer & Loewnenstein (2004) p. 3.
Behavioral economists can analyze individual decision making theoretically, empirically, or even by simulations (for an introduction to simulation see e.g. Peichel 2009). The majority of my thesis is empirical research. As mentioned previously, experiments as a special form of data collection are at the core of each of my research projects. There are different forms of experiments. Following Harrison & List (2004) there are four types of experiments: (a) conventional laboratory experiment, (b) artifactual field experiments, (c) framed field experiments, and (d) natural field experiments. However, other researchers use a different taxonomy, e.g. Falk & ichino (2006). 3 I will not stick to any predefined taxonomy, but will simply explain our experimental design.
Experimental economics does not have to be applied. Experimental decision situations can be extremely stylized and far from realistic settings. Considering Roth’s (1995) categorization of experiments by motivation, application strongly depends on the motivation. Roth differentiates between “Speaking to Theorists”, “Searching for Facts”, and “Whispering in the Ears of Princes”. While the first is rather unapplied, the latter, which is a paraphrase for policy / firm advisory, has a stronger focus on the application. 4 My research is rather applied as practical applications (the “whispering”) are not a byproduct, but the main motivation. 5 The starting point for each research project was an open question from an applied research field. As an example, consider my joint work on peer pressure with Gerlinde Fellner and Johannes Wahlig. On the one hand, previous economic literature on peer pressure revealed the opportunity to harness peer pressure as an incentive to increase productivity of workers. On the other hand, previous literature on monetary incentives revealed drawbacks on incentives at the workplace. In multi-tasking work environments, monetary incentives on single benchmarks lead to a
3
Falk & Ichino (2006) use the term controlled field experiment in their paper, which is alike a framed field experiment in the taxonomy from Harrison & List (2004).
4
However, even “Speaking to Theorists” can be applied, as several theories have important applications.
5
The research article with Gary Bolton and Axel Ockenfels represents an exception. The basic purpose of
the paper is to test game theoretical prediction of individual behavior in the laboratory.
crowding out of effort in other dimensions. Our work answers the naturally occurring question whether peer pressure as an alternative incentive is connected to similar problems and how employers should deal with it. I will present for each of my projects a corresponding application.
The presented parts are sorted in reverse chronological order. The first parts contain the latest research.
Part 2 is concerned with nonstandard preferences. More precisely, “default effects”
arising due to the “status quo bias” (Samuelson & Zeckbauer 1988) are examined.
Therefore, a randomized field experiment was conducted within a firm. On the company’s website, households could enter into a typical consumer electricity contract.
Website visitors were randomly allocated to one of the two treatments. Depending on the treatment, the 100% green energy check box was activated by default, or not. The results show a remarkable difference in consumer choice between treatments. When the check box for 100% green energy was activated by default, 69% of all consumers opted for the green contract. When the check box was not activated by default, only 7% opted for the green contract. Furthermore, the “conversion rate” (concluded contracts/
website visitor) does not differ between treatments. Hence, for the enterprise it makes
no difference which treatment they implement. However, the important contribution of
the paper is not the evidence that defaults influence decisions, but that the experimental
environment allows examining why defaults work. Previous field evidence, especially
from 401(k) saving plans (e.g. Madrian & Shea 2001, Caroll et al. 2009), suggests that
defaults work due to time-inconsistent preferences. In contrast, my experiment suggests
that defaults can also evoke strong effects due to other reasons. Even if the experiment
does not allow identifying a single result driver, it indicates that defaults provide
information or construct preferences. While such explanations were already known
from non-incentivized laboratory experiments on defaults (e.g. McKensie et al. 2006, Dinner et al. 2011), to my best knowledge, this the first evidence indicating that defaults also trigger mentioned psychological processes in the field.
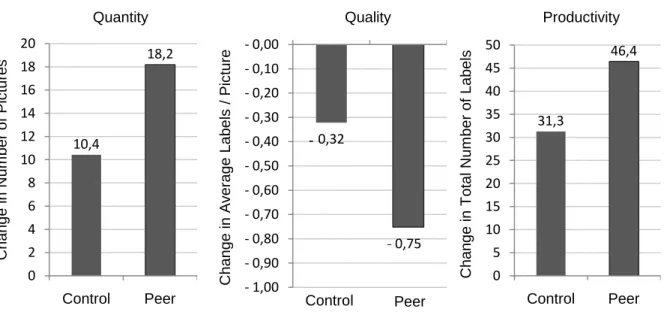
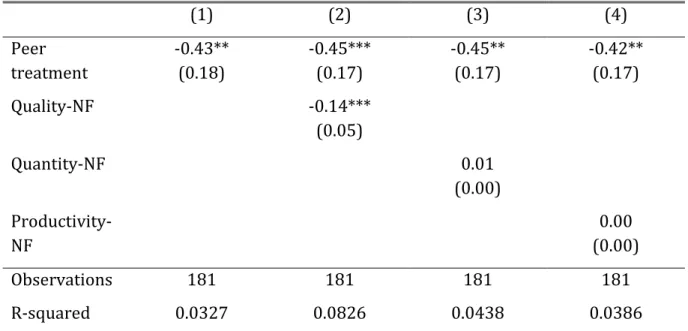
Part 3 presents a joint work with Gerlinde Fellner and Johannes Wahlig on peer pressure. 6 In a laboratory experiment we explore the role of peer pressure at the work place. DellaVigna (2009) defines individuals’ behavior adjustment when observed by peers as nonstandard decision making. Following DellaVigna’s argumentation, peer pressure or (more general) social pressure is considered as a pressure to conform, which, in turn, is considered as a result of the excessive impact of others’ beliefs on individual behavior. 7 In our experiment participants had to describe pictures. For example, a picture of a garden with a lawn, some garden furniture and different kinds of flowers, trees etc. They could allocate up to ten labels to each picture. The number of labels / descriptions allocated to a picture represents the quality, while the number of pictures they described represents the quantity of work. In one treatment, we tried to harness peer pressure as an incentive to increase productivity. 8 We exposed participants to peer pressure by informing them about the work quantity (number of pictures) of a co-worker. In line with the prediction of a short theoretical model we developed for the project, the peer incentive in the quantity dimension increases the provided work quantity and productivity, but decreases quality. Beside this core result, data analysis revealed further insights with practical implications. Although peer pressure increases productivity, workers exposed to peer pressure show no higher
6
Contributions: Idea & Theory: Ebeling; Experimental Design: Ebeling & Fellner; Experiment- implementation: Wahlig; Result-analysis & Writing: Ebeling & Fellner.
7
Alternatively, it is also possible to consider individuals’ effort adjustment due to peer pressure as a nonstandard preference for conformity (Bernheim 1994). Individuals do not want to be perceived as lazy and therefore increase work effort when exposed to peer pressure. Furthermore, in our experiment more egoistic individuals react stronger to peer pressure. Such systematic reaction patterns indicate the relevance of nonstandard (social) preferences for decision making under peer pressure. However, this example shows the close relation between behavioral anomalies.
8
Productivity was measured by total number of labels.
stress levels in self-evaluations. This result might have implications for employers:
Satisfaction of workforce does not change, but productivity rises when peer pressure is systematically exploited. Furthermore, our analysis sheds light on the optimal composition of workforce and thereby contradicts recommendations of previous literature from Falk & Ichino (2006) and Mas & Moretti (2009).
Part 4 is concerned with fundraising and altruism. It is a joint work with Christoph Feldhaus and Johannes Fendrich. 9 Most probably, fundraising is the economic research area most heavily drawing knowledge from field experiments. We also conducted a field experiment. In our experiment, we explored the role of the first giver’s status in a fundraising campaign. There already exists theory and laboratory evidence on individuals concern for status. Ball et al. (2001) shows that individuals sacrifice consumption to associate with high status individuals in a laboratory market place.
Kumru & Vesterlund (2010) transfer Ball et al.’s theory into a fundraising context. In a laboratory public good game they find similar results. When high status individuals donate first, low status individuals are more prone to donate to the public good. Despite the numerous field experiments on fundraising and the frequent anecdotal evidence about the role of celebrity donors in fundraising campaigns, there exists no scientific field evidence showing that potential donors indeed donate to associate with high status first givers. We provide field evidence for this nonstandard preference. For two weeks we trailed a homeless person asking for donations within Cologne's metro trains. Thereby we systematically varied the status of the first giver in the train. In the control treatment we did not intervene. In the low status treatment the first giver was always a (poor looking) low status person from our team and correspondingly in the high status treatment a (rich looking) high status person. The experiment provides two core results.
9
Contributions: Idea & Experimental Design: Ebeling; Experiment-implementation: Fendrich; Result-
analysis: Feldhaus; Writing: Ebeling.
First, in line with numerous previous research (e.g. Fischbacher et al. 2001, Kocher et al.
2008, Fischbacher & Gächter 2010) metro passenger are conditional cooperative and are more prone to give as soon as another metro passenger gives. Second, the probability of subsequent giving in the high status treatment is significantly higher than in the low status treatment. The practical application of our results is straight forward.
Designers of fundraising campaigns should search for a high status first donor as it seems to be an advantageous method to increase subsequent giving.
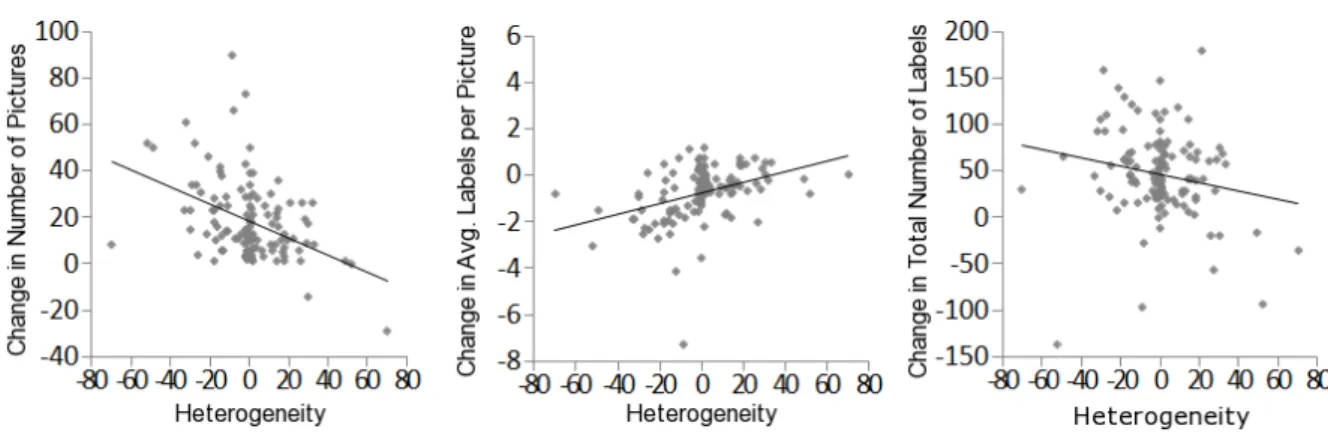
In part 5, I further analyzed conditional cooperative behavior. As already shown in the previous part, conditional cooperation is one of the most persistent behavioral patterns in public good games and charitable giving. Nevertheless, there is rather little knowledge how heterogeneous incomes / endowments of potential donors affect conditional cooperation. The only existing results from laboratory public good games find that absolute amount of giving does not depend on endowment (see e.g. Buckley &
Croson 2006), which is surprising, as it is intuitively appealing that those with higher endowments should give more (and those with lower endowments should give less).
Furthermore, there is no research scrutinizing how ambiguity about other donors’
endowment affects conditional cooperation. The experiment presented in part 5 tries to
gain further insights on these two topics. Furthermore, the paper can be considered as
groundwork for the paper in part 4, as income and status are closely related – those with
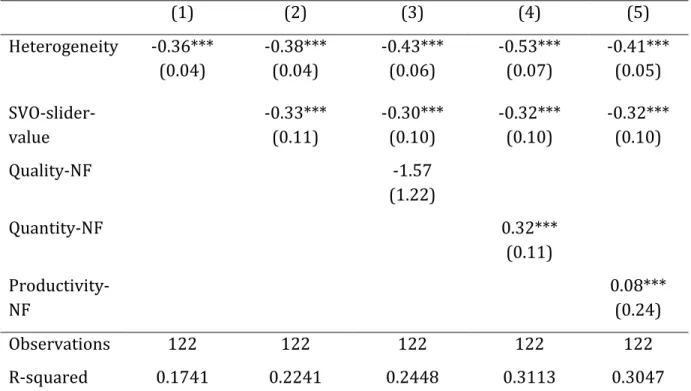
higher status are often richer. The experimental results show that endowment
heterogeneity affects conditional cooperation but ambiguity does not. Individuals
donate less, when they think that other donors have a higher endowment. However,
they do not deliberately overestimate others endowment in case of ambiguity to justify a
lower donation. This result on endowment heterogeneity differs from existing literature
which does not detect any effect of endowment on giving in laboratory public good
games. A reason might be the different environment (classical public good game versus charitable giving environment) or the different methods used to detect the effect of endowment heterogeneity. Furthermore, it is interesting to compare this result with the result of part 4. While in part 4 a first giver with higher status (and also higher income) positively affects subsequent giving, in part 5 a higher endowment of previous givers lead to lower giving of subsequent donors. This comparison suggests that in the experimental environment in part 4 the status matters more than the income.
The last research article of my thesis in part 6 is a joint work with Gary Bolton and my supervisor Axel Ockenfels. 10 I am only a co-author of this article. In this research project we test predictions of the game theoretical model of Kreps & Wilson (1982) in a laboratory experiment. In their seminal paper, Kreps & Wilson (1982, p. 266) build a game theoretical model showing that the same reputation building equilibrium applies regardless of whether the incumbent is protecting a chain store monopoly from entry by one, repeat challenger or a series of one-shot challengers. This result only applies when reputation builder’s record is freely available and agents comply with equilibrium strategy. But previous research showed actual behavior to be somewhat of the equilibrium path. In this case, repeated challengers might have additional incentives to test reputation. In our laboratory test, we find that individuals indeed show nonstandard decision making and systematic deviations from the equilibrium path. Most important, repeated challengers test reputation more often. This is intuitively appealing as they internalize potential gains from tests while this is not the case for one-shot challengers.
While this result does not have direct applications, it might be helpful to better understand reputation / feedback systems as used by eBay.
10
Contributions: Experiment-implementation: Ebeling; Result-analysis: Ebeling & Bolton; Remainder:
Bolton & Ockenfels.
References
Ball, Sheryl, Catherine Eckel, Philip J. Grossman, and William Zame. 2001. “Status in Markets.” Quarterly Journal of Economics, 116(1), 161-188.
Bernheim, B. Douglas. 1994. “A Theory of Conformity.” Journal of Political Economy.
102(5), 841-877.
Bolton, Gary E. and Axel Ockenfels. 2012. “Behavioral economic engineering”. Journal of Economic Psychology. 33, 665–676.
Buckley, Edward, and Rachel Croson. 2006. “Income and wealth heterogeneity in the voluntary provision of linear public goods.”Journal of Public Economics, 90 (4-5), 935–55.
Camerer, Coln and GeorgLoewenstein. 2004. “Chapter 1: Behavioral Economics: Past, Present, Future”. Advances in Behavioral Economics. Eds. Camerer, Colin F., Georg Loewenstein and Matthew Rabin .
Caroll, Gabriel D., James J. Choi, David Laibson, Brigitte C. Madrian, Andrew Metrick.
2009. “Optimal Defaults and Active Decisions” Quarterly Journal of Economics,124(4), 1639-1674.
DellaVigna, Stefano. 2009. “Psychology and Economics: Evidence from the Field”. Journal of Economic Literature. 47 (2), 315-372.
Dinner, Isaac, Eric J. Johnson, Daniel G. Goldstein, Kaiya Liu. 2011. „Partitioning Default Effects: Why People Choose Not to Choose.“ Journal of Experimental Psychology:
Applied, 17(4), 332-341.
Falk, Armin and Andrea Ichino. 2006. “Clean Evidence on Peer Effects.” Journal of Labor
Economics, 24(1), 39-57.
Fischbacher, Urs and Simon Gaechter. 2010. “Social Preferences, Beliefs, and the
Dynamics of Free Riding in Public Good Experiments.”American Economic Review, 100(1), 541–56.
Fischbacher, Urs, Simon Gachter, and Ernst Fehr. 2001. “Are People Conditionally
Cooperative? Evidence from a Public Goods Experiment.”Economics Letters, 71(3), 397–404.
Harrison, Glenn W. and John A. List. 2004. “Field Experiments”. Journal of Economic Literature, 42 (4), 1009-1055.
Kocher, Martin G., Todd L. Cherry, Stephan Kroll, Robert J.Netzer, and Matthias Sutter.
2008. “Conditional Cooperation on Three Continents.” Economics Letters, 101(3), 175–78.
Kreps, David M. and Robert Wilson. 1982. “Reputation and Imperfect Information.”
Journal of Economic Theory, 27, 253-279.
Kumru, Cagri S. and LiseVesterlund. 2010. “The Effect of Status on Charitable Giving.”Journal of Public Economic Theory, 12(4), 709-735.
Madrian, Brigitte C., and Dennis Shea. 2001. “The Power of Suggestion: Inertia in 401(k) Participation and Savings Behavior,” Quarterly Journal of Economics, 116, 1149- 1187.
Mas, Alexandre and Enrico Moretti. 2009. “Peers at Work.” The American Economic Review, 99(1), 112-145.
McKenzie, C.R., M.J. Liersch and S.R. Finkelstein. 2006. „Recommendations Implicit in
Policy Defaults.” Psychological Science, 17(5), 414-420.
Peichel, Andreas. 2009. “The Benefits of Linking CGE and Microsimulation Models:
Evidence from a Flat Tax Analysis”. Journal of Applied Economics,12 (2), 301-329.
Roth, Alvin E. 1995. “Introduction to Experimental Economics: The Use of Experiments.”
The Handbook of Experimental Economics.Eds. John H. Kagel& Alvin E. Roth.
Samuelson, William and Zeckhauser, Richard. 1988. "Status Quo Bias in Decision
Making." Journal of Risk and Uncertainty, 1(1), 7-59.
Part 2
Why do Defaults work?
-
Evidence from a Natural Field Experiment
Why do Defaults work?
-
Evidence from a Field Experiment
Felix Ebeling *
December 19, 2012
Abstract
In cooperation with an electricity provider we conducted a field experiment to scrutinize the impact of defaults on electricity customers’ willingness to purchase a “green” electricity contract. We ran the experiment with more than 40,000 interested customers and tested how they react on different non-binding green energy defaults in the contract offer. The results show that (i) the fraction of consumers willing to purchase an electricity contract does not depend on the default, and (ii) the fraction of customers opting for a contract, delivering only electricity from renewable sources, strongly depends on the default. The fraction of “green” customers is less than 10% when the green energy check box is not set by default and around 70% when it is set by default- despite the higher price of the “green”
contract. Importantly, in our experimental setting the costs of opting out of the default are negligible when purchasing the contract, but very high in later periods. Due to this cost structure, our results suggest that customers’ reactions on defaults cannot be explained by switching costs or procrastination as done in previous literature on default effects.
JEL Classification: D03, D12, L94, Q41
Keywords: cooperation, optimal defaults, renewable energy demand, field experiment
*
Felix Ebeling, University of Cologne, Department of Economics, ebeling@wiso.uni-koeln.de.
1. Introduction
Literature from economics and psychology documents a pervasive impact of non- binding default options on people’s revealed preferences. Whatever the default in decisions on e.g. insurance contracts (Johnson et al. 1993), postmortem organ donation (Johnson & Goldstein 2003), retirement savings (Caroll et al. 2009), or even television program choice (Esteves-Sorenson & Perretti 2012), agents persistently stick to it.
Explanations for the field evidence cited above either rely completely on switching costs and procrastination or suggest that a large portion of the effect size is due to this rationale. In contrast, the large default effects in our field experiment strongly suggest explanations other than switching costs. To our best knowledge, thus far, such rationales were unambiguously only detected in laboratory experiments.
This paper reports results from a field experiment that we conducted in cooperation with an electricity provider. On the electricity provider’s website, prospective customers can purchase electricity household contracts. To receive a binding contract offer, interested customers only have to provide their zip code and their estimated yearly electricity consumption. Afterwards, customers can choose between several contract offers. Our focus is on contract offers’ differences in the default of the “100% green”
electricity option. 100% green means that electricity is purely generated by renewable sources as wind, solar or hydro. We conducted two treatments. In the control treatment, the 100% green check box is not set by default in the contract. In the green treatment, however, the check box is set by default.
We conducted the experiment for four weeks. During this period roughly 46,000
prospective customers inquired contract offers. 4720 purchased a contract. Our
experimental analysis provides two main results. First, the conversion rate (fraction of
website visitors buying a contract) does not differ between treatments. Second, there is
a highly significant difference in fraction of customers buying a 100% green electricity contract. While in the control treatment less than 10% buy a 100% green energy contract, this percentage rises to around 70% in the green treatment.
Beside the contribution to the question why defaults work, this paper has some practical relevance. First, it contributes to behavioral economists efforts to nudge household to more sustainable energy consumption patterns. Schultz et al. (2007) and Alcott (2011) show that providing information on energy consumption norms induces individuals to conserve energy. This paper presents a complementary approach. Our intervention does not decrease energy consumption, but substitutes demand for carbon emitting electricity by demand for more costly, carbon neutral electricity. Second, it contributes to the publicly discussed question whether consumers are willing to pay high costs for the energy policy. 1 This paper shows that, at least in a certain range, there is no unique willingness to pay for green energy, but that consumers’ preferences vary due to subtle changes in contract presentation.
The remainder of the paper is organized as follows. The next section presents an overview of the related literature. In section 3 we describe the experiment in more detail. Section 4 presents the results and section 5 concludes.
2. Relevant Literature
This section highlights the most important explanations for default effects and mentions the respective, relevant literature. Thereby, we categorize explanations in three categories (1. switching costs, 2. information provision and 3. constructing preferences).
1
Several newspapers from different countries report consumer related problems with the green energy:
http://www.nytimes.com/2010/11/08/science/earth/08fossil.html
http://www.nytimes.com/2009/03/29/business/energy-environment/29renew.html http://www.guardian.co.uk/money/2012/feb/08/higher-household-energy-bills-2020
http://www.spiegel.de/international/business/merkel-s-switch-to-renewables-rising-energy-prices- endanger-german-industry-a-816669.html
http://www.spiegel.de/international/germany/doubts-increasing-about-germany-s-switch-to-
renewable-energy-a-844844.html
Furthermore, this section reviews past efforts of behavioral economists to nudge households to more sustainable consumption patterns.
First, default effects may occur because of switching costs. Assuming rational agents, defaults should have an effect on agents’ decisions when costs of opting out of the defaults are higher than the benefits (see, e.g., Thaler & Sunstein 2003, Schwartz & Scott 2003). Such an explanation is especially feasible when agents do not really care about the default issue. In such cases opting-out costs quickly surpass benefits. 2 However, in the prominent studies on defaults in 401(k) investments, effects due to default-changes can hardly be explained by rational decisions due to switching costs. For clarification, consider the example provided by DellaVigna (2009). DellaVigna depicts that the mean employee from the Madrian & Shea (2001) study receives 1200$ yearly when opting out of the default contract. It is hard to imagine how employee’s costs of the necessary phone call surpass this yearly benefit. 3 Therefore, studies on saving plans explain inertia generally with quasi-hyperbolic preferences of naïve individuals. Such agents stick with the default even when switching costs are lower. 4 Lately, Esteves-Sorenson & Peretti (2012) show that this reasoning even applies in situations where switching costs are seemingly negligible low. In their study, television viewers constantly postpone switching channels when the next program starts - despite the very low costs of switching.
Second, default effects may occur because they provide information. Assuming rational agents, defaults should have an effect on agents’ decisions when a better informed decision designer potentially signals the best option through the default. For example,
2
For example, it is possible - or at least imaginable – that the behavior of a certain fraction of agents in the prominent organ donor example (Johnson & Goldstein 2003) is rational. More precisely, there might be agents that simply do not care what happens to their body after death and therefore rationally do not engage in a costly change of the default option.
3
Cost / benefit ratios in other studies about saving plans (Cronqvist & Thaler 2004, Choi et al. 2004, Caroll et al. 2009) are in the same range.
4
See our model in Appendix B for a detailed explanation of quasi-hyperbolic preferences and naïveté.
rational workers in 401(k) saving studies might follow defaults because they think that their better informed employer provide the best solution via default. Similarly, rational car customers might follow defaults of a manufacturer when configuring their car, because they believe that the superiorly informed manufacturer provides recommendations about the optimal car customization via defaults (See Levav et al.
2010). 5 Several psychology papers show that agents indeed comprehend the information value of defaults (Brown & Krishna 2004, McKensey et al. 2006, Tannenbaum & Ditto 2011). Altmann et al. (2012) provide an economic approach with a formal model and laboratory evidence which extends findings from psychological research. They show that rational agents only unconditionally follow defaults when the decision designer is better informed and his interests are congruent with the agent’s interests - an assumption which is arguable in the above mentioned car manufacturer example. 6 Furthermore, defaults might provide information on issues not related to the agent’s monetary / rational interest, but following nevertheless maximizes the agent’s utility. For example, defaults might signal what other agents do in the decision situation and are therefore appealing to conditional cooperators (see, e.g., McKensey et al. 2006, Altmann & Falk 2009). Alternatively, defaults might signal a social norm (e.g. about organ donations, see Johnson & Goldstein 2003), which is appealing for conformists (Bernheim 1994, Sliwka 2007). So, even in cases where defaults only provide information on non-rational issues, they might be valuable for the agent.
5
In the field experiment of Levav et al. (2010), German car customers configure their vehicle previously to the purchase with the configuration software from the car manufacturer. Customers choose different options on motor, rims, sound system etc. They potentially follow defaults when they belief that the manufacturer has superior information about the optimal customization and signals best combinations via defaults (e.g. optimal gear transmission for a certain car).
6
In fact, defaults as scrutinized by Levav et al. (2010) do not exist in real car customization processes
because the German consumer advice center intervenes against defaults setting due to manufacturer’s
conflict of interest.
Third, defaults work because they construct preferences. The foremost explanation is that the default evokes an instant endowment-effect (e.g. Kahneman et al. 1991). 7 For an endowment effect, two assumptions on individual behavior have to be made. First, setting the default instantly alters the agent’s perception and changes his reference point. Second, agents are loss averse. Under these assumptions, agents claim more compensation to drop a set default than they are willing to pay for an unset default.
Hence, their willingness to accept (WTA) a loss is higher (more costly) than their willingness to pay (WTP) for a gain. In a contract offer such as in our experiment this implies that for a given price of an option a higher fraction of agents stick with it when it is the default option, than buy it when it is not the default option. Samuelson &
Zeckhauer (1988) suggested such an explanation already for the status quo bias observed in their study. Kahneman et al. (1991), Johnson et al. (1993) and Camerer et al.
(2003) take the same line in their reasoning for default effects. An alternative explanation how defaults construct preferences is that they eliminate uncertainty about individuals own preferences. Dhingra et al. (2012) provide a theoretical model and laboratory evidence for this approach. Furthermore, there is psychological research from Dinner et al. (2011) suggesting that defaults shape individuals’ preferences for contract options. In a laboratory survey Dinner et al. (2011) show that participants evaluate more costly compact fluorescent light bulbs (CFL) much better and would buy them much more often, respectively, when CLFs are the default instead of incandescent light bulbs. We will discuss in the final chapter which reasoning is most likely for our results.
Furthermore, this paper is about sustainable consumption. Schultz et al. (2007) show in a small-scale experiment that providing information on social norms induces individuals
7
Groundwork papers on endowment effects are Thaler (1980) and Kahneman & Tversky (1984).
to conserve energy. Inspired by these results, the company OPOWER launched a likewise experiment with nearly 600,000 households in the U.S.A. The company mails so-called Home Energy Report letters to households. Letters basically contain a comparison of own energy use and energy use of similar neighbors. As shown by Alcott (2011) the program reduces energy consumption on average by 2.0%. Our paper presents a complementary approach. It does not show how to decrease energy consumption, but how people are more prone to substitute carbon emitting electricity by more costly, carbon neutral electricity.
3. Experiment
3.1 Environment
Our natural field experiment (Harrison & List 2004) was conducted on an electricity provider’s website in early summer 2012. The electricity provider is one of the ten biggest providers in Germany and delivers electricity to households throughout the whole country. On the firm’s website, visitors can purchase typical consumer electricity contracts. Contracts are generally addressed to households with 1 to 6 persons.
We present data of a period of four and a half weeks (May 9th to June 11 th , 2012). The actual experiment ran a week longer, but due to technical problems, the last week’s data was not collected properly. There is no reason to assume that the last week’s data differ from previous weeks’ data or that overall results change if data was available.
3.2 Procedure
Independent of treatment, prospective customers have to scroll through three website screens to receive a binding contract offer from the electricity supplier by mail.
On the first screen, which can be found in Figure A1 in Appendix A in a translated and
anonymized way, visitors have to type in their zip code and their yearly electricity
consumption. The zip code is necessary, because power grid charges differ between German regions and consequently offered electricity prices also differ. The yearly electricity consumption is used to show customers on the second screen what they can save per year in comparison to the local electricity provider if they choose our provider. 8 After the prospective customer entered his zip code and his yearly consumption, they have to click the “show contract” button and the second screen with detailed contract offers for the region appears.
The second screen, which can be found in Figure A2 in Appendix A, offers two contracts.
The structure of contracts is similar. In both contracts, households have to pay a consumption independent base price plus a certain price per unit. However, one contract provides less service (e.g. no telephone hotline) and is cheaper. 9 In the following, we will call these two contracts low-service and high-service contract. The base price is always 2€ lower in the low service contract. The price-per-unit is region dependent between 0.5€cent and 4€cent lower in the low service contract.
Furthermore, each contract shows the yearly savings customers can achieve when they choose our provider instead of the local electricity provider. Customers can choose which of the two contracts they would like to order by clicking the “order now” button.
The third screen appears, after a customer ordered a contract. On the third screen, customers have to type in their name and address. They receive the chosen binding contract offer by mail a few days later. The consumer only concludes the contract, when she signs the contract that he received by mail and sends it back to the commodity supplier.
8
In Germany, households receive electricity by default from the local public utility if they do not actively switch to another provider. The shown savings result from the comparison with prices of the local public utility. Unfortunately, our electricity provider does not calculate the savings, but receives the saving amounts from an external service provider. Therefore, we do not have access to the exact savings.
9
Due to anonymity guaranty for cooperating firms we do not mention exact features.
3.3 Treatments
There are two treatments. The treatments differ in their default rule for the green energy option on the second screen. In the control treatment the check box for 100%
green energy is not selected by default. In the green treatment the check box is selected by default. Independent of treatment, the price per kilowatt hour increases by 0.3 cent as soon as the box for 100% green energy is checked. Hence, the price increases by 0.3 € cent in the control treatment as soon as the check box for 100% green energy is set to on, and decreases by 0.3 € cent in the green treatment as soon as the checkbox is set to off. Depending on the zip code, 0.3 € cent represents additional costs of 1.15% to 1.46%
per kilowatt hour for the consumer. This represents an additional payment of 9 €/year for the average customers from our experiment. The yearly costs of green energy were visible to prospective customers when clicking the checkbox. As soon as they clicked, the yearly savings achievable in comparison to the local utility changed. When activating green energy, the savings decrease by the respective yearly costs, when deactivating green energy, the savings increase by the respective yearly costs. In case that customers order a non-green energy contract, they receive their electricity from the current standard electricity mix in Germany. 10 It is important to mention that the green energy check box was always similarly set for the low-service and the high-service contract.
Either in both contracts the check box was set, or for none.
3.4 Technical Issues & Problems
While it is almost as easy to program an experiment for a website as for the laboratory, the environment provides less control. In the following, we will highlight two problems we had to deal with in our experiment.
10
In this mix in 2011 43.5% of electricity came from coal, 19.9% from renewable sources, 17.6% from
nuclear plants, 13.7% from gas and 5.3% from other sources.
Whether a website visitor saw the control treatment or the green treatment was decided randomly when he entered the website. To make sure that the visitor saw only one treatment in case he visited the website more than once, cookies were used.
Nevertheless, due to the following two reasons, we analyze visits instead of visitors.
First, it is not completely uncommon that visitors do not activate cookies or delete cookies. If we had analyzed visitors, we would have identified repeated visits of those visitors as new visitors. Second, Internet search engines, whose function and relevance we describe in the next paragraph, bypass cookies. As we don’t know exactly how search engines interact with the electricity provider’s website, allocation of visits to visitors is impossible. Fortunately, for our experiment, differences between visitors and visits are less important. First, since new visitors are randomly allocated to the treatments, we can deduce from an equal number of visits an equal number of visitors per treatment (even if we cannot exclude that some visitors saw both treatments). Second, and most important for our analysis, we mainly analyze the data of prospective customers that finally bought the contract. These visitors can be identified unambiguously, as each household can only buy one contract. 11
Internet search engines, direct links or advertising links allow customers to buy a contract from our electricity provider without participating in the experiment. Indeed, a significant minority of customers who bought a contract from our electricity provider during the period of the experiment did not participate in the complete process of our experiment. As for most products offered in the Internet, there are search engines, which offer price comparisons for electricity contracts (e.g. www.stromsparer.de).
Prospective customers who receive a contract from our electricity provider via search engines generate a visit on our page but most probably did not see the website, since the
11
Even if a household order more than one binding contract offer to sign (what is rather unlikely), in the
end with certainty only one contract is purchased.
visit is generated by the search engine instead of the customer directly. 12 Likewise, but to a minor extend, prospective customers may bypass the experimental procedure when they enter the website through a direct link or an advertising link. These links might bring prospective customers directly to the second screen. Fortunately, we are able to identify whether prospective customers ran through the whole experimental procedure or only saw part of it. We simply checked whether a visitor provided all data collected in the experimental process. Only when the visitor ran through the whole process, the firm’s web-server was able to collect the complete data. However, for those who did not run through the complete experiment, we are not able to identify how much they exactly saw. Whether a prospective customer saw basically nothing of our experiment (because he used an internet search engine) or whether he saw the most important second screen but not the first (because a direct link led him directly on the second screen) remains unclear for us. Since we did not want to exclude “partial participants” completely from our analysis, we differentiate in the following sections between “direct” visitors who ran through the whole experimental process and “indirect” visitors who only saw part of it.
4. Results
Table 1 summarizes the collected data. The first row contains the visits of the second website screen including “indirect” visits. Overall, there were 63,768 visits on the second website screen, 33,341 in the control treatment and 30,427 in the green treatment. The firm estimates that each visitor makes on average 1.3 to 1.5 visits. This implies between 42,500 to 49,000. 13 The second row contains the number of “direct” visits on the second screen. The final row contains the means of the yearly consumption of customers that
12
We checked for some of the most popular search engines how prospective customers receive a contract from them. Basically, customers who receive a contract from them do not see the original website of the actual electricity provider at all.
13
From other tables we received from the company we could derive that the best guess is around 46.000
visitors.
purchased a contract through the direct process (based on consumers’ own statement on the first website screen, which is only available if customer used the direct procedure).
TABLE 1. DATA SUMMARY
Control Green
Visits of second screen 33,341 30,427
Visits of second screen (direct only) 21,960 19,992
Purchased contracts 2,490 2,230
Purchased contracts (direct only) 1905 1607
100% green energy contracts 143 1,698
100% green energy contracts (direct only) 137 1115
Average yearly consumption (purchased &
direct only)
3038kWh 3011kWh
First, we consider the “Conversion Rate”. The conversion rate describes the fraction of prospective customers that finally purchase a contract and can be seen in Figure 1 (left).
Unsurprisingly, the main focus of the firm was on the conversion rate. A two-tailed Chi-
squared test cannot reject the hypothesis of similar ratios of visits to purchased
contracts in both treatments when considering all visits (p=0.51). When differentiating
between direct and indirect visits, there are significant differences. For direct visitors
the conversion rate is higher in the control treatment (two-tailed Chi-squared test
p<0.05), for “indirect” visits the conversion rate is higher in the green treatment (two-
tailed Chi-squared test p<0.01). But as Figure 1 (left) shows, even if the conversion rate
is generally higher for direct visits, for each visit-channel the differences between
treatments are relatively small in size. Ultimately, for the firm the default doesn’t matter, as the accumulated conversion rate does not differ between treatments. 14
FIGURE 1. CONVERSION RATE AND FRACTION OF GREEN CONTRACTS
Second, we consider the fraction of green contracts. Figure 1 (right) displays that, the fraction of green contracts strongly differs between treatments. This difference is highly significant (two tailed Chi-squared test, p<0.01 for All, Direct only and Indirect only, respectively). However, we also see in Figure 1 (right) that there are differences between visit-channels. We will constrain our analysis to direct visitors only, because the more extreme result for indirect visits is most probably evoked by the simple fact that a large fraction of indirect customers never saw the second screen of our experiment and therefore could not change the default.
In the control treatment, of 1905 purchased contracts through the direct channel only 137 or 7.2% are green. In contrast, in the green treatment, of the 1607 purchased contracts through the direct channel 69.1 % or 1115 contracts are green. Even if the
14
As the electricity market is highly competitive, the contribution margin for the standard energy mix and 100% green energy is similar. Hence, for the firm only the number of contracts matters, not the kind of contract.
7,5 8,7
7,3 8 5,1 6
0 10 20 30 40 50 60 70 80 90 100
All Direct only Indirect only control green
C o n v e rsi o n R a te i n %
5,7 7,2
1 76,1
69,1
93,6
0 10 20 30 40 50 60 70 80 90 100
All Direct only Indirect only control green
F ra ct io n o f G re e n C o n tr a ct s in %
difference is huge, more customers stick to the non-green default than to the green default. A two tailed Chi-squared test highly significantly rejects the hypothesis that the fraction of customers staying with the green contract in the green treatment is as high as the fraction of customers staying with the non-green contract in the control treatment (p<0.01). This implies that for a substantial fraction of customers the strength or stickiness of the default is not sufficiently high to make them willing to bear the additional costs of green energy. Hence, even if the result shows that defaults have a strong impact on customers, it also shows the limits of default effects.
Furthermore, we use probit analyses to examine customer’s contract choices in more detail. Thereby, we benefit from differences of several contract variables between regions. Remember that customers have to type in their estimated yearly consumption as well as their zip code before receiving the contract offers. While the yearly consumption naturally differs between customers, there are also differences in the contract offers towards customers depending on the customer’s zip code. The base- price, the price per unit as well as the difference in price per unit between the high- service and the low-service contract depend on the region. This allows us to test for the influence of these variables on green energy choice.
Table 2 presents the results of our probit analysis. The analysis supports that the treatment is by far the best predictor for the green energy choice. Besides, only the price difference between the low-service and high-service contract significantly affects the green energy choice (but to a far smaller degree than the treatment). The higher the difference in price-per-unit between the low-service and high-service contract, the higher the probability to choose a green contract. This might be due to a framing effect, a
“Titchener Illusion” with numbers: The higher the price-per-unit difference between the
low-service contract and the high-service contract, the lower customers perceive the
mark-on for green energy and therefore are more prone to purchase the green energy contract. Furthermore, it is remarkable that yearly consumption is not significant. It would have been intuitively appealing, that those with a higher yearly consumption are more price-sensitive. Especially, as our probit analysis in Table 1.A in Appendix A shows that when it comes to the choice between the low-service and the high-service contract, the yearly consumption indeed has a highly significant positive influence on the propensity to choose the cheaper contract. A possible reason might be that bigger households have different socioeconomic values and are more open to green energy.
TABLE 2: GREEN CONTRACT CHOICE
(1) (2) (3)
Treatment 1.968***
(0.05)
1.972***
(0.05)
2.009***
(0.08)
Price Difference 0.121***
(0.04)
0.124***
(0.04)
Contract Type -0.025
(0.09)
I-Contract-Treatment -0.063
(0.11)
Base Price -0.028
(0.02)
Price / Unit 0.013
(0.04)
Yearly Consumption -0.00
(0.00)
Observations 3512 3512 3512
Pseudo R-squared 0.3520 0.3542 0.3555
Notes: probit regressions with green contract choice donations as dependent variable. Standard errors in parentheses. “Treatment” represents a binary variable for the green treatment, “Price Difference”
represents the price-per-unit difference between the low-service and the high-service contract, “Contract Type” represents a binary variable indicating whether customer bought a low-service or a high-service contract, “I-Contract-Treatment” represents the interaction variable of “Treatment” and “Contract Type”,
“Base Price” represents the base price of the high-service contract, “Price / Unit” represents the price-per-
unit of the high-service contract. Level of significance: *p<0.10, **p<0.05, ***p<0.01.
5. Discussion and Summary
In our experiment we did not implement a neutral frame. 15 The control treatment nudges the costumers towards no green energy, the green treatment nudges the costumers towards green energy. In the control treatment 7% opt for green energy, in the green treatment 69% opt for green energy. In consideration of all existing evidence about defaults, in a neutral frame the customer fraction opting for green energy should be in between these values. Hence, in our experiment at least 30% 69% 7%/2 of the customers were nudged in one or the other direction. Which of the psychological processes reviewed in chapter two can explain changed decision of at least 30% of all customers?
An explanation based on switching costs and quasi-hyperbolic preferences is technically possible in our experimental setup. 16 Agents can order the default contract now and change the green contract feature later. If doing so, they would prefer to save very small switching costs now, but spend much higher switching costs later. Switching now is just a click, but switching later would represent an additional contract purchase, which involves calling or writing the electricity provider, signing a new contract offer and sending it back to the electricity provider. 17 In Appendix B we formalize this decision situation for individuals with quasi-hyperbolic preferences. Thereby, we use the standard theoretical framework, which was also used by Laibson (1997), O’Donoghue &
Rabin (1999), Carroll et al. (2009) and others. Our formal approach shows that in our setting only individuals with very extreme time inconsistent preferences postpone
15
A neutral frame would have been a contract offer (second screen) with two check boxes in each contract - one for green energy, one for non-green energy, none checked. Prospective customers would have been obliged to actively decide which green energy option they want if they want to purchase a contract.
16
Explanations based on rationality and switching costs are not considered. Switching costs in our experiment are way too low for such reasoning.
17