energies
Article
Biological CO 2 -Methanation: An Approach to Standardization
Martin Thema
1,2,*
,†, Tobias Weidlich
2,†, Manuel Hörl
3,†, Annett Bellack
4,†,
Friedemann Mörs
5, Florian Hackl
6, Matthias Kohlmayer
7, Jasmin Gleich
7, Carsten Stabenau
8, Thomas Trabold
2, Michael Neubert
2, Felix Ortloff
5, Raimund Brotsack
7, Doris Schmack
6, Harald Huber
4, Doris Hafenbradl
3, Jürgen Karl
2and Michael Sterner
11
Research Center on Energy Transmission and Energy Storage (FENES), Technical University of Applied Sciences OTH Regensburg, Seybothstrasse 2, 93053 Regensburg, Germany;
michael.sterner@oth-regensburg.de
2
Chair for Energy Process Engineering, Friedrich-Alexander-University Erlangen-Nuremberg, Fuerther Strasse 244f, 90429 Nuremberg, Germany; tobias.weidlich@fau.de (T.W.); thomas.trabold@fau.de (T.T.);
michael.neubert@fau.de (M.N.); juergen.karl@fau.de (J.K.)
3
Electrochaea GmbH, Semmelweisstrasse 3, 82152 Planegg, Germany;
manuel.hoerl@electrochaea.com (M.H.); doris.hafenbradl@electrochaea.com (D.H.)
4
Institute of Microbiology and Archaea Center, University of Regensburg, Universitaetsstraße 31, 93053 Regenburg, Germany; annett.bellack@ur.de (A.B.); harald.huber@ur.de (H.H.)
5
DVGW Research Centre at Engler-Bunte-Institute (EBI) of Karlsruhe Institute of Technology (KIT), Engler-Bunte-Ring 1, 76131 Karlsruhe, Germany; moers@dvgw-ebi.de (F.M.); ortloff@dvgw-ebi.de (F.O.)
6
MicrobEnergy GmbH, Bayernwerk 8, 92421 Schwandorf, Germany; florian.hackl@microbenergy.com (F.H.);
doris.schmack@microbenergy.de (D.S.)
7
MicroPyros GmbH, Imhoffstr. 95, 94315 Straubing, Germany; m.kohlmayer@micropyros.de (M.K.);
j.gleich@micropyros.de (J.G.); r.brotsack@micropyros.de (R.B.)
8
Westnetz GmbH, Florianstr. 15-21, 44139 Dortmund, Germany; carsten.stabenau@westnetz.de
*
Correspondence: martin.thema@oth-regensburg.de; Tel.:
+49-941-943-9200†
Contributed equally: Martin Thema, Tobias Weidlich, Manuel Hörl, Annett Bellack.
Received: 22 March 2019; Accepted: 24 April 2019; Published: 1 May 2019
Abstract: Power-to-Methane as one part of Power-to-Gas has been recognized globally as one of the key elements for the transition towards a sustainable energy system. While plants that produce methane catalytically have been in operation for a long time, biological methanation has just reached industrial pilot scale and near-term commercial application. The growing importance of the biological method is reflected by an increasing number of scientific articles describing novel approaches to improve this technology. However, these studies are difficult to compare because they lack a coherent nomenclature. In this article, we present a comprehensive set of parameters allowing the characterization and comparison of various biological methanation processes. To identify relevant parameters needed for a proper description of this technology, we summarized existing literature and defined system boundaries for Power-to-Methane process steps. On this basis, we derive system parameters providing information on the methanation system, its performance, the biology and cost aspects. As a result, three different standards are provided as a blueprint matrix for use in academia and industry applicable to both, biological and catalytic methanation. Hence, this review attempts to set the standards for a comprehensive description of biological and chemical methanation processes.
Keywords: methanation; standardization; biological methanation; CO
2-methanation; power-to-gas;
power-to-methane; trickle-bed reactor; CSTR; bubble column reactor; membrane reactor
Energies2019,12, 1670; doi:10.3390/en12091670 www.mdpi.com/journal/energies
1. Introduction
Already today “human activities are estimated to have caused approximately one degree centigrade of global warming above pre-industrial levels ( . . . ). Global warming is likely to reach 1.5
◦C between 2030 and 2052 if it continues to increase at the current rate” [1]. Facing this threat, several nations have committed in the Paris Agreement [2] to keep the rise of global temperatures this century well below two degree centigrade above pre-industrial level and to make efforts to limit the temperature increase even further to 1.5
◦C. First steps to lay down hard rules for adherence on this agreement were taken at the 24th Conference of the Parties to the United Nations Framework Convention on Climate Change in Katowice/Poland in late 2018 [3]. The ambitious goals can only be reached, if the greenhouse gas emissions of the energy sector will be dramatically reduced by more than 70% until 2050 compared to the levels of 2015 [4]. At the moment, 70% of the total greenhouse gas emissions, i.e., more than 34 gigatons of carbon dioxide equivalents, can be traced back to the energy sector [5], with 42% originating from power and heat generation, 24% from the transport sector and 19% from industrial processes [6].
The required reduction of carbon dioxide emissions is only achievable by a change in consumption patterns, increasing energy efficiency and a massive deployment of renewable energy forms such as wind, solar and hydro power to replace fossil generation. However, energy generation from renewable sources, especially wind and solar, is fluctuating and intermittent and therefore technologies for long term and large capacity electricity storage are required to store energy during times of overproduction and to provide energy in the case of shortage [7,8]. Furthermore, the transportation of renewable energy resources on a global scale requires electricity storage with high energy density and the use of existing transport infrastructures. Regions with an excess on renewable energies will have to contribute to the green energy demand of the world’s megacities and industrialized regions with energy carriers originating from Power-to-Gas or Power-to-Liquids.
Power-to-Gas, also called PtG, is an essential technology to convert the energy sector into a renewable system which can provide the required long-term storage capacity and reduce carbon footprints by gradually substituting fossil feedstocks with renewable gas [9,10]. The technology uses renewable electric power to produce hydrogen by electrolysis (Power-to-Hydrogen), which then can be further converted into methane with carbon dioxide from an external source in the methanation step (Power-to-Methane). Both gases can be injected into the existing natural gas grid, which offers a storage capacity, e.g., for Germany and Denmark, that exceeds the energy consumption needs of several months [11,12]. While the volumes of hydrogen that can be injected into the natural gas grid are limited due to regulatory and technical reasons [13,14], methane, also known as synthetic natural gas (SNG), can be injected basically without limitation for storage. Alternatively, the produced methane can be used as compressed natural gas (CNG) motor fuel and in any well-established natural gas facility including distribution through the gas network [8]. By this, PtG promotes not only the transformation of the electrical power system from fossil to renewable energy sources but can also help to transform the heat and gas as well as the transportation sectors. This approach is notably demonstrated by press releases, study reports and presentations from gas grid operators and their partners who have identified the renewable synthetic gas as the future for a fossil-free gas grid [15–18].
Today, two processes exist for the conversion of hydrogen and carbon dioxide to methane,
namely thermochemical or catalytic methanation and biological methanation [19,20]. Thermochemical
methanation, also known as Sabatier-process, utilizes metal catalysts like e.g., Ni/Al
2O
3to catalyze
the methanation reaction [21–24]. The process operates at high temperatures between 200 and 550
◦C
depending on the optimal activity of the catalyst and pressures up to 100 bar because the methanation
is thermodynamically more favorable at high operation pressure [24,25]. Due to the reactor design
and the catalyst, catalytic methanation is characterized by high space-time yields and high methane
selectivity. However, a major restriction for the chemical methanation is the requirement of high
reactant gas purities because of the sensitivity of the metal catalyst towards contaminants such as
hydrogen sulfide [20,22,24,26]. Biological methanation uses biological catalysts i.e., methanogenic
microorganisms to catalyze the methanation reaction [27–29]. As a consequence, reactors work
Energies2019,12, 1670 3 of 32
normally at temperatures between 37 and 65
◦C and pressures from one to 15 bars to meet the optimal growth conditions of these microorganisms. In addition, methanogens are more robust towards fluctuations in reactant gas supply and impurities such as hydrogen sulfide than metal catalysts.
The key limitation of the biological process is the low hydrogen gas-to-liquid mass transfer especially at 65
◦C, which leads to lower space-time yields and the requirement of bigger reactor dimensions.
To overcome this challenge, more and more research groups as well as industrial entities work on the reactor optimization and the plethora of literature published on different biological methanation reactor types, plants and experimental setups is showing progress and potentials of the technology for national and international applications [25,27,30].
Although many data are available, there is no common basis for comparison of biological methanation systems, because reports differ in their definitions of system parameters and boundaries.
In order to highlight the benefits of certain system configurations for biological methanation and to potentially compare them to chemical methanation systems, a comprehensive set of parameters is desired.
In this work, we evaluated current literature on biological methanation to determine a set of system parameters and characteristic variables for all reactor types used for this technology. We focus on two-step processes and do not take bioelectronic systems and in-situ methanation into account which are described in detail by Geppert et al. [31] and Graf et al. [32]. A definition of system boundaries of the different PtG configurations is provided together with mass and energy balances. The parameters presented in this paper should be applicable to both industrial and academic projects and therefore provide a solid basis for the characterization and techno-economical comparison of biological and chemical methanation systems.
2. Methodology and Motivation
To meet the objective of standardization and to allow better comparability, classification and quantification of efficiencies in various biological CO
2-Methanation systems, the present work defines system boundaries and develops performance parameters which are applicable to chemical methanation systems as well. The design of this study is based on a review of existing literature on biological CO
2-Methanation and the summary of parameters used for the characterization of this process.
The results were discussed by all authors, representing not only academia and industry but also a German gas distribution system operator (Westnetz GmbH, Düsseldorf, Germany) and an association for guideline preparation (DVGW – German Technical and Scientific Association for Gas and Water, Karlsruhe, Germany). Subsequently, system boundaries and the most common parameters and units were identified, defined and adopted to close gaps in the existing set of parameters. As a result of this process, a robust framework as recommended standard was developed and is presented in this article.
Systems and processes for biological CO
2-Methanation are various and can differ significantly in their components (e.g., the reactor type), operating modes (e.g., batch or continuous) or the biocatalyst applied. In current literature, a confusing variety in nomenclature of parameters and units, reference on standard conditions and given information is present. This fact becomes apparent in Table 1 which summarizes indications and units used to describe the methane production rate of trickle-bed reactor (TBR) systems. Most authors use ‘methane productivity’ [33–35] or the German equivalent ‘Methanbildungsrate’ [36–38] but nine other indications were found as well [33,35,36,39–44].
The heterogeneity of units for this parameter is even bigger: in total, 25 different units were identified for the same parameter with some authors using more than one unit within the same manuscript.
The inconsistency in indication is similar for other parameters like ‘methane concentration’
(10 different indications and three different units), ‘reactant gas composition’ (12 indications, 10 units),
‘loading rate’ (nine indications, eight units), ‘hydrogen/carbon dioxide conversion rate’ (six indications, three units), ‘gas flow rate’ (eight indications, seven units), ‘recirculation rate of the trickle medium’
(eight indications, eight units), ‘methane yield’ (six indications, three units), ‘gas retention time’ (three
indications, one unit), ‘hydraulic retention time’ (three indications, one unit) or the ‘reactor volume’
(eight indications, five units).
Just for basic parameters and units there are no major differences. Some authors provide temperature in ‘degree centigrade’ [33,34,36–38,42–46] and others in ‘Kelvin’ [35,40]. Regarding pressure, it is not always clear if absolute or relative pressure is given [33,36–38,45] and some authors only state their values as ‘ambient’ [43,44,46] or ‘atmospheric’[35,40] (see Table A1 in the Appendix A).
Table 1.
Variety in indications and units for the methane production rate in current literature on CO
2-methanation in trickle-bed reactors. Minor differences in spelling or case sensitivities reflect inaccuracies of indications and units in literature. A summary of indications and units of other relevant parameters for CO
2-methanation is given in Table A1 in the Appendix A.
Parameters Indications from Literature Units from Literature Methane production rate CH4production rate [39]
CH4production [35,40]
MBR[36]
Methane formation [41]
Methane evolution rateMER[47]
Methane formation rateT[36–38]
Methane productivity [33–35,48]
Methane production rate [41,42,48]
P[43]
PCH4[33,44,48]
Specific methane production [43,44]
l/(l*d) [45]; l/lreactor/d [34]
l/l-reactor/h [41]; mL L−1h−1[49]2 l CH4/l bed volume/h [42]
m3CH
4m−3day−1[39]; m3CH
4/
m3trickle bed·d [46]; m3nCH4/m3reactor vol.x d [33];
m3/
m3reactord
[44]; m3m−3day−1[50]2; v/v/d [51]2
ml/h [42]; ml/min [52]2; mmol/h [35]; mmol/hr [40]
mmol CH4/h·L [35,40]; mmol L−1h−1[53]2; mmolCH4L−1h−1[47]2;
NLCH4/
LTtricle bed∗d [37]
Nl/h per m3fixed bed vol.T[38]
Nm3CH
4/ m3·d
[36]; Nm3CH
4/ m3FBd(T) [43,44] LCH4/LR·d [48,54]2 Indices:1indication or2unit found in other literature than on trickle-bed systems (not comprehensive);3vague, which volume is meant (packing volume, net reactor volume, liquid volume, etc.).Tterms from German references were translated into English language or(T)matched to the appropriate English term.
Regarding other reactor types like continuous stirred tank reactors (CSTR), bubble column reactors (BCR) or membrane reactors (MR) the complexity and inconsistency of parameters and units are assumed to further increase.
3. Power-to-Gas—Definitions and System Boundaries
Power-to-Gas is a general term for the technology of converting renewable electrical power into chemical energy in the form of flammable gases [9,55,56] and comprises of two concepts:
Power-to-Hydrogen (also Power-to-Gas-Hydrogen, PtG-H
2) [47,57,58] and Power-to-Methane (Power-to-Gas-Methane, PtG-CH
4) [9].
For a standardization of the biological CO
2-Methanation as one step of PtG-CH
4, it is necessary to define the system boundaries not only of this process but also for the entire technology (Figure 1 and Table 2). The system boundaries and components of both PtG-H
2and PtG-CH
4were set in accordance with Sterner and Stadler [9] and are summarized briefly herein. For further reading, especially on the principles and necessity of both PtG-concepts, the authors refer to the following reviews (e.g., [20,45,59]). To facilitate the comparison of academic and industrial projects, we distinguish two system boundaries for the methanation step (called methanation system herein):
(i) the ‘CO
2-Methanation reactor’, summarizing all components of the reactor (yellow box, Figure 1;
Section 3.1.1) and (ii) the ‘CO
2-Methanation process’, extending the ‘CO
2-Methanation reactor’
boundary by necessary peripherals as up- and downstream gas or water treatment and other balance
of plant (green box, Figure 1; Section 3.1.2).
Energies2019,12, 1670 5 of 32
Energies 2019, 12 FOR PEER REVIEW 5
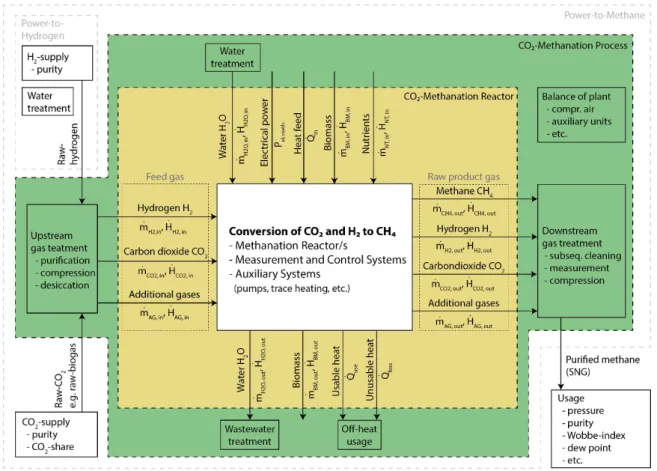
Figure 1. Boundaries and mass and energy streams of the systems CO2
-Methanation reactor (yellow), CO
2-Methanation process (green), Power-to-Hydrogen and Power-to-Methane.
Table 2.
Boundaries and components of the systems ‘CO
2-Methanation reactor’, ‘CO
2-Methanation process’, ‘Power-to-Hydrogen’ and ‘Power-to-Methane’. Background colors of the first two systems refer to the system boundary colors given in Figure 1.
System boundaries and components
CO2- Methanation
Reactor
CO2- Methanation
Process
Power-to- Hydrogen
Power-to- Methane
Upstream gas treatment - x x x
H
2-supply (e.g., electrolysis) - - x x
Water treatment - x x x
Conversion of CO
2and H
2to CH
4x x - x
Off-heat usage - x - x
Wastewater treatment - x - x
Downstream gas treatment - x - x
3.1. Methanation System
The methanation system is the core process of PtG-CH
4and describes the chemical or biological conversion of carbon dioxide and hydrogen into methane and water according to Equation (1) or (2).
For biological methanation, Equation (2) is valid, since the main part of the water is in liquid phase (gaseous water in the products occurs at about two percent depending on pressure):
4 H (g) + CO (g) → CH (g) + 2 H O(g) ∆𝐻 = −165 kJ/mol (1)
4 H (g) + CO (g) → CH (g) + 2 H O(l) ∆𝐻 = −253 kJ/mol (2) For this reason, biological CO
2-methanation releases more heat than chemical, where the product water leaves the reactor as vapor. Nevertheless, losses within the system boundary ‘CO
2-Methanation
Figure 1.
Boundaries and mass and energy streams of the systems CO
2-Methanation reactor (yellow), CO
2-Methanation process (green), Power-to-Hydrogen and Power-to-Methane.
Table 2.
Boundaries and components of the systems ‘CO
2-Methanation reactor’, ‘CO
2-Methanation process’, ‘Power-to-Hydrogen’ and ‘Power-to-Methane’. Background colors of the first two systems refer to the system boundary colors given in Figure 1.
System Boundaries and Components
CO2-Methanation Reactor
CO2-Methanation
Process Power-to-Hydrogen Power-to-Methane
Upstream gas treatment - x x x
H2-supply (e.g., electrolysis) - - x x
Water treatment - x x x
Conversion of CO2and H2to CH4 x x - x
Off-heat usage - x - x
Wastewater treatment - x - x
Downstream gas treatment - x - x
3.1. Methanation System
The methanation system is the core process of PtG-CH
4and describes the chemical or biological conversion of carbon dioxide and hydrogen into methane and water according to Equation (1) or (2).
For biological methanation, Equation (2) is valid, since the main part of the water is in liquid phase (gaseous water in the products occurs at about two percent depending on pressure):
4 H
2( g ) + CO
2( g ) → CH
4( g ) + 2 H
2O ( g ) ∆H
0R= − 165 kJ/mol
CH4(1)
4 H
2( g ) + CO
2( g ) → CH
4( g ) + 2 H
2O ( l ) ∆H
0R= − 253 kJ/mol
CH4(2)
For this reason, biological CO
2-methanation releases more heat than chemical, where the product
water leaves the reactor as vapor. Nevertheless, losses within the system boundary ‘CO
2-Methanation
reactor’ which are related to the lower heating value, as more common in power engineering, are equal
for biological and chemical methanation and therefore comparable and have to be calculated with Equation (1).
Our study revealed that some authors use the term ‘biological hydrogen methanation’ (BHM) to define the biologically-driven conversion as opposite to the catalytic-chemical process [30,60]. However, this term implies that hydrogen is converted to methane but the conversion of one element into another, namely hydrogen (H) into carbon (C), is not possible from a chemical point of view. In the case of (biological) methanation, molecular hydrogen acts as electron donor/reducing agent that is oxidized to water. Carbon dioxide on the other hand is reduced to methane (Equation (1)). Consequently, the name of this process should be ‘biological CO
2-Methanation’ and equals the definition of ‘CO
2-Methanation reactor’ provided herein in a biological system. Analogous, the term ‘chemical CO
2-Methanation’
is defined as the chemical conversion of carbon dioxide into methane within the ‘CO
2-Methanation reactor’ boundary.
3.1.1. CO
2-Methanation Reactor
The ‘CO
2-Methanation reactor’ boundary, is the innermost part of the methanation system and includes (i) the methanation reactor, (ii) the measurement control system of the reactor and (iii) all potentially required components for operation of the reactor, such as pumps, heating, cooling or stirring.
For our standardization approach of the biological CO
2-Methanation given in Section 4, we refer to all relevant parameters of the biological conversion into methane within the ‘CO
2-Methanation reactor’ boundary.
All relevant mass and energy streams crossing the ‘CO
2-Methanation reactor’ system boundary are shown in Figure 1. The derived mass and energy balances for this system are given exemplarily in Equations (3) to (5) and can be deduced for all other system boundaries. In case additional energy flows enter or exit the process, they have to be considered in the equations:
m
.H2,in+ m
.CO2,in+ m
.BM,in+ m
.AG,in+ m
.H2O,in+ m
.NT,in= m
.CH4,out+ m
.H2,out+ m
.CO2,out+ m
.AG,out+ m
.H2O,out+ m
.BM,out(3) H
.H2,in+ H
.CO2,in+ H
.BM,in+ H
.AG,in+ H
.H2O,in+ H
.NT,in+ P
el+ Q
.in= H
.CH4,out+ H
.H2,out+ H
.CO2,out+ H
.AG,out+ H
.H2O,out+ H
.BM,out+ Q
.out(4)
.
Q
out= Q
.loss+ Q
.use(5)
The ‘CO
2-Methanation reactor’ neither includes process steps for pre- and post-treatment of the feed and product gas, nor water and wastewater management, treatment and heating or cooling required for any peripheral processes. Since gas pre-treatment is not considered within this system boundary, every reactant is assumed to be already supplied at a purity tolerated by the methanation system. Therefore the ‘CO
2-Methanation reactor’ system definition is generally valid for the comparison of the methanation performance of any biologically or chemically catalyzed methanation system. Both from academia and industry. However, the disadvantage of this system definition is that the tolerance of systems towards impurities in the feed gases, which is one of the major advantages of biological vs. chemical methanation, is not revealed. As a consequence, reactant and product gases have to be specified separately (see Section 4.3.5).
3.1.2. CO
2-Methanation Process
Although the ‘CO
2-Methanation reactor’ system definition has the advantage to be generally applicable to any methanation system, it might be of limited use when comparing industrial systems.
Industrial systems normally are obliged to produce gas with a certain quality and reliability, which
depends on the application (e.g., grid injection or biogas upgrading) and potentially requires additional
treatment of feed and product gases. To overcome this limitation, we defined the ‘CO
2-Methanation
process’ system boundary as an extension of the ‘CO
2-Methanation reactor’ system boundary (Figure 1),
Energies2019,12, 1670 7 of 32
including the necessary peripherals. Here, potential water and wastewater treatment steps, as well as pre- and post-treatment of feed and product gases such as compression, drying or cleaning steps are considered. Since the product gas treatment will depend on the anticipated use (purity requirements, etc.), the definition of the ‘CO
2-Methanation process’ system boundary does not allow for a general comparison of methanation systems, but for a comparison of systems used for similar and specific applications.
3.2. Power-to-Hydrogen
The ‘Power-to-Hydrogen’ concept depicts the splitting of water into hydrogen and oxygen via an electrolyzer (Equation (6)) using renewable electric power. There are different electrolyzer technologies and the topic has been reviewed in detail [9,61,62]:
H
2O ( l ) → H
2( g ) + 1
2 O
2( g ) ∆H
0R= + 286 kJ/mol (6) The hydrogen can be used in chemical and industrial processes and for transport applications.
Injection into the natural gas grid is also possible in limited quantities (see Section 4.2) to make it available for the power sector as well as for heating or industrial applications. Further conversion of hydrogen into methane or other chemicals is not part of the ‘Power-to-Hydrogen’ system boundary.
3.3. Power-to-Methane
The Power-to-Methane system is the combination of the Power-to-Hydrogen and the CO
2-Methanation process systems including carbon dioxide supply. It describes the conversion of renewable power into natural gas substitutes namely methane or SNG, according to Equation (7) which combines Equations (2) and (6). Theoretically, hydrogen can be derived from other processes than PtG-H
2. The methane can be injected and stored in the existing gas network and gas storages if it reaches the quality required by local regulations (see Section 4.2 or e.g., DVGW G260(A) [63], SVGW G13 [64], ÖVGW G31 [65]). Alternatively, it can be used as CNG motor fuel, or it can easily be utilized in all other well-established natural gas facilities. Grid injection, storage or other gas use is not included within the system boundary of ‘Power-to-Methane’:
4 H
2O ( l ) + CO
2( g ) → CH
4( g ) + 2 H
2O ( l ) + 2 O
2( g ) ∆H
0R= + 891 kJ/mol (7) 4. System Parameters and Characteristic Variables
The following section lists our recommended standards and regulations for the description of the system boundary ‘CO
2-Methanation reactor’ including: (i) system-related, (ii) performance-relevant, (iii) microbiology-based parameters and (iv) those important for cost calculation. Although the authors focus on biological CO
2-Methanation, all parameters proposed herein should be applicable to chemical systems as well. In Table A2 in the Appendix A as well as in the Supplementary Materials of this paper, the set of parameters and units is proposed as a blueprint for plant description. Here, we distinguish three quality levels:
(1) A-Standard: detailed scientific data and background information (2) B-Standard: basic information including economic aspects (3) C-Standard: basic information on most important parameters 4.1. Standard Conditions
For a better comparability of gas processes and specifically to eliminate variability in the calculation
of gas volumes due to pressure and temperature effects, gas volumes are usually reported at standard
conditions. However, for natural gas and natural gas substitutes, several definitions for standard
conditions exist, which differ in temperature and pressure (Table 3) and therefore lead to diverging results. In some papers, it is ambiguous to which standard the authors refer to.
The standard DIN 1343 (1990-01-00) “explains the terms reference conditions, normal conditions and normal volume and specifies values for normal temperature, normal pressure and molar normal volume of an ideal gas” [66].
The objective of the international standard DIN EN ISO 13443 is “to specify the standard reference conditions of temperature, pressure and humidity to be used for measurements and calculations carried out on natural gases, natural-gas substitutes and similar fluids” [67] in compliance with ISO 5024 [68]
which standardizes measurement and reference conditions for petroleum liquids and gases. It refers to other standardization literature as ISO 6976 (Natural gas-calculation of calorific values, density, relative density and Wobbe-index from composition, [69]) for detailed explanation of the parameters.
The international standard ISO 2533 [70] defines a standard atmosphere on which calculations can be based.
Table 3.
Existing definitions of standard conditions.
Standard, Title Pressure Temperature
DIN 1343 Physikalischer Normzustand; STP pn=101,325 Pa
(=1.01325 bar) Tn=273.15 K (tn=0◦C) DIN EN ISO 13443 Natural gas—Standard reference
conditions 1.013250 bar 0◦C and
288.15 K (15◦C) ISO 5024
Petroleum liquids and gases;
Measurement; Standard reference conditions
101.325 kPa 288.15 K (15◦C)
DIN ISO 2533 Standard Atmosphere 1.013250 bar 288.15 K1(15◦C)
1For a geopotential height of 0.00 km.
For the characterization of biological CO
2-Methanation systems, we recommend using the norm condition as consistently specified in DIN 1343 and DIN EN ISO 13443 as 1.01325 bar and 0
◦C. This standard is also used by the German Technical and Scientific Association for Gas and Water [63]. Consequently, all parameters given in scientific publications should refer to this pressure and temperature for better comparability of different methanation systems or varying operating parameters.
According to the standard ISO 13443 ([67], comment 5), reference conditions should not be part of the unit (e.g., not Nm
3or m
3N) but of the symbol. Therefore, units in this paper e.g., for gas volumes are given e.g., as m
3also if norm cubic meters are meant.
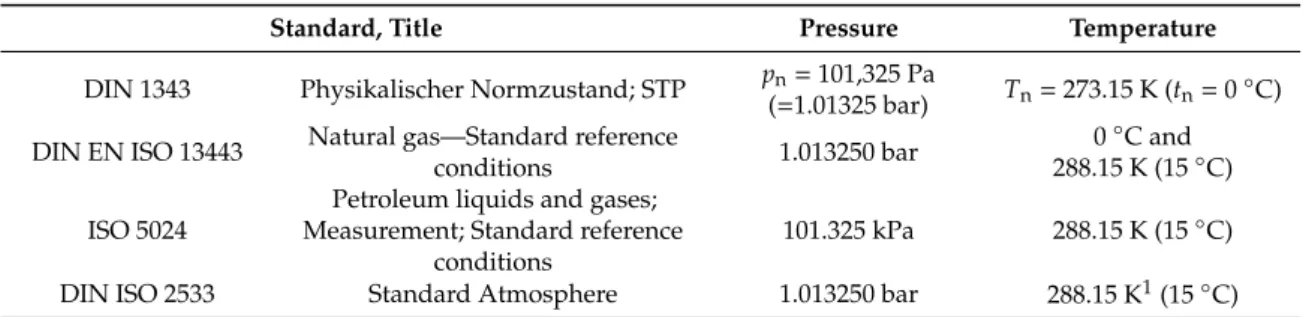
4.2. Feed-in Relevant Standards and Regulations
Feed-in restrictions are an important topic for methanation process applications, since strict limits for gas impurities like hydrogen and carbon dioxide in the gas network would result in downstream methane enrichment of the methanation plant to fulfill the requirements due to technical specifications in infrastructure. However, European standards for gas quality are quite inhomogeneous as listed in Table 4. One important reason might be that there are different approaches to setting gas quality specifications across the European Union. In some countries, parts of gas quality restrictions (and hence the specifications) relate to the safety and protection of the general public and have become enshrined in national safety legislation. In that regard, relevant technical reasons are underground storages, CNG steel vehicle tanks, gas engines, gas turbines and gas burners in the domestic sector. For example, CNG steel tanks limit the hydrogen content to two percent, if the tensile strength exceeds 950 MPa [71].
In addition to that, inhomogeneous standards translate into necessary adjustments of reactor systems in different European countries.
Projects for harmonization have been carried out, such as the Common Business Practice
2005-001/02 on “Harmonisation of Gas Qualities” from EASEE-gas [72] or the activity on gas quality
harmonization by the European Commission and its related legislation [73].
Energies2019,12, 1670 9 of 32
Table 4.
Regulative standards and regulations on natural gas quality and SNG in different countries with a focus on Europe.
Country
In SNG In grid (d, t)
References CH4
%
CO2
%
CO2
%
H2
%
H2S mg/m3
Wobbe-Index WI Lower WI
MJ/ms3 Upper WI MJ/ms3
Austria - 2 2 4 5 45.42 53.62 [65,74,75]
Belgium - 2 2 0 5** 46.61 53.90 [14,75,76]
Bulgaria - 1 1 - 2 - - [75]
Canada - - - 4 - - - [76]
Czech
Republic - 3 3 2 2 45.70 52.20 [75,76]
Denmark - 3.0 3.0d/2.5t - 5** 48.19 52.93 [75,77,78]
France - 2.5 2.5 6 5** 46.47 53.48 [14,75,76]
EASEE-gas - - 2.5 - 5** 46.45 53.99 [75]
Estonia - - 1.5* - - 46.65 47.31 [75]
Germany >95 6 - 2/101 5 43.62 53.46 [63,75,76,79]
Greece - 3 3 - 5.4 44.29 55.32 [75]
Hungary - - - - 20 43.71 53.57 [75]
Ireland - 2 2 - 5 47.20 51.41 [75]
Italy - 3 3 0.5 6.6 47.31 52.33 [75,76]
Latvia - - - - 20 39.06 51.67 [75]
Luxembourg - - - 46.45 53.99 [75]
Netherlands - - - 12 5 41.23 42.13 [75,76]
New
Zealand - - - 0 - - - [76]
Poland - 3 - - 7 - - [75]
Portugal - - - - 5 45.70 54.70 [75]
Romania - 8 8 - 6.8 - - [75]
Slovakia - 3 3 - 2 - - [75]
Slovenia - 1.575 1.575 - 6.3 - - [75]
Spain - 2.5 2.5 5 15** 45.65 54.70 [75,76]
Sweden - - - 0.5 5 43.73 53.60 [14,75,76,80]
Switzerland >96 - - 4 - - - [64,76]
United
Kingdom - - - 0.1 5 47.20 51.41 [75,76]
1Limit falls to two percent if there is a CNG station downstream [14],ddistribution orttransmission network.
*Total inerts,**hydrogen sulfide (H2S) and carbonyl sulfide (COS). Some countries seem to omit thresholds for certain gases either in distribution or transmission network or in requirements on fed in purified SNG.
For example, in Switzerland (SVGW G13), limits for hydrogen and carbon dioxide can be defined via the methane content required. In Denmark, the threshold for hydrogen in the grid indirectly results from the Wobbe-index required.
4.3. System Related Parameters 4.3.1. Reactor and Plant Type
For a comprehensive description of the reactor and plant type used for biological CO
2-Methanation, the following parameters should be specified:
• Reactor type (TBR, CSTR, BCR, MB, etc.; explanations are given below)
• Mode of operation (e.g., batch/fed-batch/continuous/semi-continuous) and
• Required plant components, according to the ‘CO
2-Methanation process’ boundary definition,
• Potential specific characteristics of the plant/process concept e.g., co-current/counter-current mode, flow chart, etc.
The key limitation of the biological process is the slow hydrogen gas-to-liquid mass transfer,
leading to low space-time yields and vice versa requiring larger reactor dimensions than for chemical
methanation. The problem can be highlighted by the following Equation (8) of gas-to-liquid mass transfer of various gaseous species i (gas phase mass transfer is neglected):
n
.G/L,iV
Reaction= k
L,iA
spec· c
G,iH
i,cc− c
L,i!
(8) As can be seen, the mass transfer issue can be optimized by either increasing the mass transfer coefficient k
L, the specific surface area A
specor the concentration gradient between the phases. k
Lcan effectively be increased by intensifying intermixing of the liquid phase e.g., by stirring or by higher flow velocities in the liquid phase. The specific gas-liquid surface area A
speccan be increased by e.g., adding a packing material into the reactor or by adapting hydrodynamics within the reactor to favor e.g., smaller bubbles or droplets. The concentration gradient between the phases can be increased by operating the system at higher pressures.
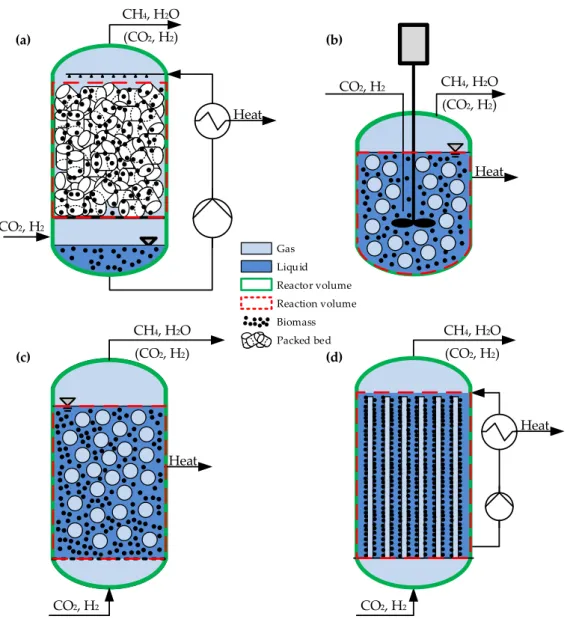
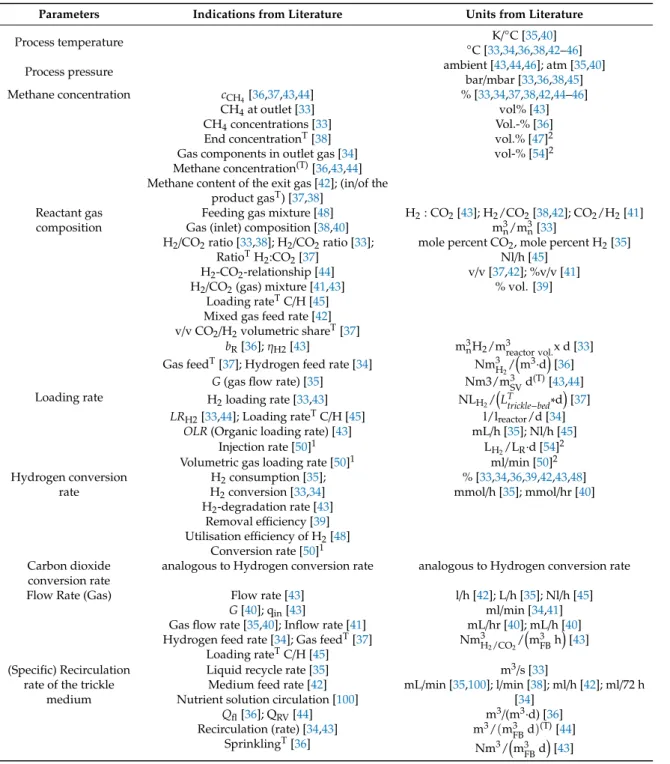
Due to this, various types of biological methanation systems based on different reactor systems are currently under investigation. The spectrum of applied systems ranges from conventional continuous stirred tank reactors (CSTR), trickle-bed reactor (TBR) systems to bubble column reactors (BCR) which are illustrated insee Figure 2. Mixed types, e.g., flooded fixed bed systems or stirred bubble column systems are also present in the field. Most recently the use of membrane reactors (MR) is considered for biological methanation. Table 5 gives an overview of the characteristics of the different standard configurations.
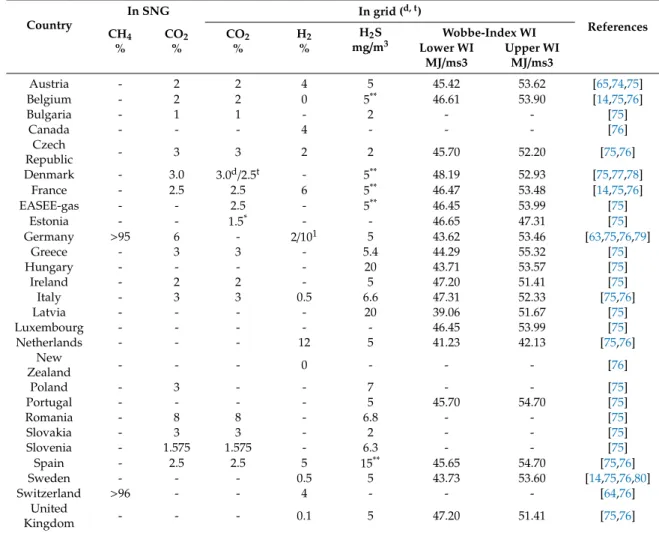
Table 5.
Overview of the mass transport potential and the energy consumption related to the mass transport in the trickle-bed reactor (TBR), the stirred tank reactor (CSTR), the bubble column reactor (BCR) and the membrane reactor (MR) [81–86].
Parameter Unit Trickle-Bed Reactor (TBR)
Continuous Stirred Tank Reactor (CSTR)
Bubble Column Reactor (BCR)
Membrane Reactor (MR)
Gas hold-upεG - 0.75–0.98 0.05–0.3 0.02–0.4
Liquid hold-up1εL - 0.5–0.2 0.7–0.95 0.7–0.95
Effective surface areaaeff m−1 60–640 100–1500 100–1000 70–180
Mass transfer coefficientkL m/s 0.4–2×10⁻⁴ 0.3–4×10⁻⁴ 1–4×10⁻⁴ 1–10×10−4 Volume specific power
inputpVR,kLa Wh/m3 4.3 50 12.5–15.6
1Including volume of suspended microorganisms and solids.
The concepts differ in the phase ratio of gas/liquid/solids inside the reactor system. In a TBR, the gas phase is the continuous phase and the volume of the packing material (solid, neglecting the volume of the microorganisms) is less than 10%. Thereby the microorganisms can either are immobilized on the packing material or can be suspended in the circulating liquid phase. In a CSTR and BCR, the liquid phase is the continuous phase and the microorganisms are suspended in the liquid. The gas phase is dispersed in the liquid in form of bubbles and the gas hold-up is lower compared to a TBR. In a MR, the microorganisms are immobilized in a biofilm outside of the cylindrical membranes which separate the liquid (outside) and the gas phase (inside). Thus, the gas (H
2, CO
2) diffuses through the membrane into the biofilm and the liquid stays bubble-free.
The effective surface area a
effis higher in a CSTR and a BCR due to the dispersal of the gas phase
into small bubbles. Nevertheless, the specific power input for dispersing the gas phase is highest for
a CSTR followed by a BCR. The energy demand of a TBR is considerably lower due to the fact that
the liquid only has to be pumped to the top of the column but no additional energy has to be spent
for dispersing the liquid into droplets. Since a MR is only in focus of academic research nowadays,
the energy demand is unknown.
Energies2019,12, 1670 11 of 32
Energies 2019, 12 FOR PEER REVIEW 11
for dispersing the liquid into droplets. Since a MR is only in focus of academic research nowadays, the energy demand is unknown.
Heat
CO
2, H
2Heat
CO
2, H
2Heat
CO
2, H
2Gas Liquid Reactor volume Reaction volume Biomass Packed bed
(a)
(c) (d)
Heat CO
2, H
2CH
4, H
2O
(CO
2, H
2)
(b)CH
4, H
2O (CO
2, H
2) CH
4, H
2O
(CO
2, H
2)
CH
4, H
2O (CO
2, H
2)
Figure 2. Schematic flow diagram of a trickle-bed reactor TBR (a), a continuous stirred tank reactor CSTR (b), a bubble column reactor BCR (c) and a membrane reactor MR (d) for biological methanation. Reactor volume VR (green), liquid volume VL (blue), gas volume VG (light blue), reaction volume (red), biomass and packing/reaction volume VP is shown.
A relevant question for the evaluation of the different reaction systems is the calculation basis in terms of reactor volume V
Rfor the methane production rate (MPR, see Section 4.4.6). In general, the MPR can be calculated based on the volume of the liquid V
L, the active volume of e.g., the liquid/gas bubbles volume in case of BCR or the packing volume V
Pin case of the TBR. Nevertheless, it is also useful to consider the total volume of the reactor, as the pressure vessel volume itself is critical in terms of financial aspects.
Besides the data given in Table 5, the choice of reactor concept also influences the backmixing behavior of the phases and hereby the effective methane production rate. While both phases are perfectly back-mixed within a CSTR, a TBR features plug flow behavior in both phases. Furthermore, TBRs offer an additional degree of freedom by the choice of operating in co- or counter-current
Figure 2.Schematic flow diagram of a trickle-bed reactor TBR (a), a continuous stirred tank reactor CSTR (b), a bubble column reactor BCR (c) and a membrane reactor MR (d) for biological methanation.
Reactor volume V
R(green), liquid volume V
L(blue), gas volume V
G(light blue), reaction volume (red), biomass and packing/reaction volume V
Pis shown.
A relevant question for the evaluation of the different reaction systems is the calculation basis in terms of reactor volume V
Rfor the methane production rate (MPR, see Section 4.4.6). In general, the MPR can be calculated based on the volume of the liquid V
L, the active volume of e.g., the liquid/gas bubbles volume in case of BCR or the packing volume V
Pin case of the TBR. Nevertheless, it is also useful to consider the total volume of the reactor, as the pressure vessel volume itself is critical in terms of financial aspects.
Besides the data given in Table 5, the choice of reactor concept also influences the backmixing
behavior of the phases and hereby the effective methane production rate. While both phases are
perfectly back-mixed within a CSTR, a TBR features plug flow behavior in both phases. Furthermore,
TBRs offer an additional degree of freedom by the choice of operating in co- or counter-current operation
mode. BCRs and MRs feature mixed flow behavior. BCRs can be perfectly back-mixed in both phases
or feature back-mixing in liquid and plug flow in gas phase. MRs usually feature plug flow behavior
in the gas phase and backmixing on the liquid side.
4.3.2. Reactor-, Gas-, Reaction- and Liquid Volume, h/d-Ratio, Packing Volume
Different parameters were identified to characterize the volume of the methanation reactor.
The usual definition of the actual ‘reactor volume’ (V
Rin m
3) is the sum of the volume of all sections within the reactor, including e.g., head space, sump, liquid and internal components. The volume in pipes is usually negligible and not considered in the calculation of the reactor volume. If the vessel is cylindrical, V
Ris defined by ‘reactor height’ (h
Rin m) and ‘reactor diameter’ (d
Rin m) from which the
‘h/d-ratio’ can be calculated.
The ‘liquid volume’ (V
Lin m
3) comprises only the liquid present within the reactor during operation including volume of suspended biomass and solids. For the specific application of trickle-bed reactors, additionally the suspended biomass and ‘packing volume’ (V
Pin m
3) can be given. It is the volume of the packing zone and, if cylindrical, can be calculated by the ‘packing height’ (h
Pin m) and ‘packing diameter’ (d
Pin m). The ‘gas volume’ (V
Gin m
3) contains total volume of gaseous phase within the reactor volume V
R. The ‘reaction volume’ (V
Reactionin m
3) is the volume in which the reaction itself occurs. A mapping of the different volumes is illustrated in Figure 2.
4.3.3. Plant Capacity, Size and Footprint
The size specification of the methanation plant (not including the electrolyzer) should be provided by the following parameters:
• Reactor volume V
R(see Section 4.3.2)
• Nominal capacity of the methanation given by:
◦ Methane production rate in nominal point (MPR) in m
3/h and related to the lower heating value MPR
LHVin kW/m
3(see Section 4.4.6)
◦ The lower heating value (LHV) of the methane produced (in kW or MW). The LHVs of potential further product gas components n are not considered here but can be summed up as P
N,Meth= P
n0P
n.
• The footprint of the methanation plant, both, absolute FP
Methin square meters (m
2) and as specific area value fp
Meth, where the area is normalized by the nominal capacity of the methanation plant referred to the lower heating value of the methane produced (m
2/kW)
• The volume specific power input calculated as p
VR,kLa= P
N/ ( V
R· k
La
eff) in Wh/m
3• Nominal capacity of the entire plant P
N(connected electric power of the electrolyzer and methanation including all peripheral systems in kW or MW)
4.3.4. Plant Operating States
This section defines the most common operating states of biological CO
2-Methanation plants.
It is recommended to use this terminology and to indicate the parameters specific to individual states.
‘Temperature’ T in
◦C, ‘pressure’ p in bar and ‘methane production rate’ (see Section 4.4.6) should always be provided for each operating state.
• In the ‘nominal operating state’, the plant is operating at its nominal capacity (P
N,Meth).
• When the plant is operated in a ‘partial load operation state’, the load should be provided as percent of the nominal operating capacity.
• In ‘intermittent operation state’ (i.e., load following), the plant is operated in accordance to the availability of (renewable) electric power for hydrogen generation which is the essential idea behind the Power-to-Gas concepts. For this operating mode there is no specific parameter definition, but the conditions of operation should be provided, i.e., frequency and order of magnitude of load changes.
• ‘Hot standby’ (HSB) is defined as the operation state that is chosen during short breaks of
operation with the possibility to change quickly back to one of the aforementioned operation
Energies2019,12, 1670 13 of 32
states. Therefore, temperature and pressure settings in warm standby are expected to be as at nominal operating state, but the reactant gas feed is stopped.
• The plant is put in ‘cold standby’ (CSB) during longer shut down of operation. In this mode, most components are not in operation to save energy. Accordingly, the temperature is allowed to decrease to a critical value where heating is only switched on to avoid damage to the process e.g., due to freezing of liquids. System pressure and gas composition can be different from operating conditions.
• ‘Shut down’ (SD) describes the state of no operation. Only components to ensure plant safety like gas detection or fire detection are in operation.
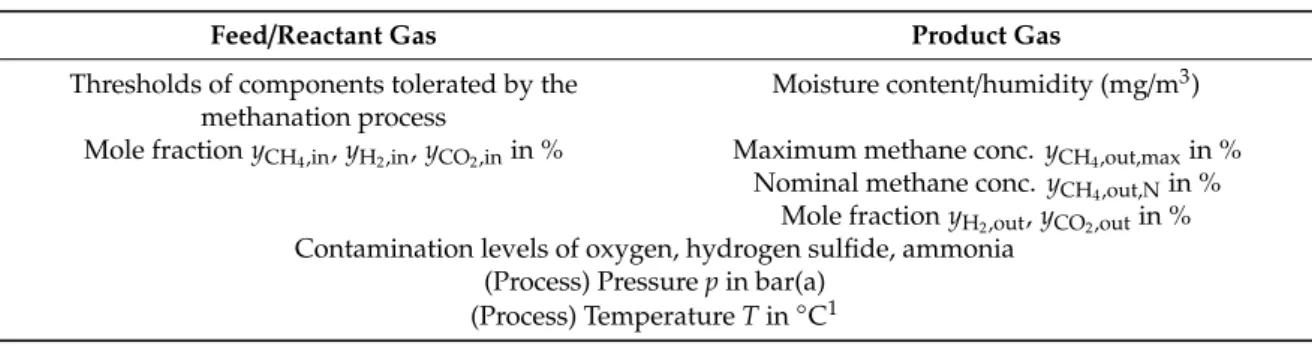
4.3.5. Reactant and Product Gas Specification
For the feed gases hydrogen and carbon dioxide as well as for the product gas, specifications listed in Table 6 should be provided. Methane content in the product gas should always be given as maximum mole fraction y
maxand as mole fraction at nominal point y
Nin percent.
The mole fraction y
ifor different gases i is defined in Equation (9) for ideal gases. The unit of the mole fraction y is percent by volume or amount of substance and must be given in % and explicitly not as e.g., vol.-%:
y
i= V
iV
total· 100 [ % ] (9)
Table 6.
Recommendation on feed and product gas specifications to indicate.
Feed/Reactant Gas Product Gas
Thresholds of components tolerated by the methanation process
Moisture content/humidity (mg/m
3) Mole fraction y
CH4,in, y
H2,in, y
CO2,inin % Maximum methane conc. y
CH4,out,maxin %
Nominal methane conc. y
CH4,out,Nin % Mole fraction y
H2,out, y
CO2,outin % Contamination levels of oxygen, hydrogen sulfide, ammonia
(Process) Pressure p in bar(a) (Process) Temperature T in
◦C
11Although◦C is not an SI-unit, its use is standard in scientific publications on microbiology. Also, this unit is needed for public relations.
4.4. Performance Parameters 4.4.1. Gas Hourly Space Velocity
The gas hourly space velocity (GHSV) is the ratio between the gas inflow and the reactor volume.
To distinguish between the operation with pure carbon dioxide and gases where carbon dioxide is only a fraction of the carbon feed gas (e.g., with biogas), we define two different space velocities. One being related to the entire reactant gas mixture (GHSV
t, Equation (10)) with an total gas inflow V
.G,inin m
3/h.
The other only to the hydrogen supplied to the methanation plant V
.H2,in(GHSV
H2, Equation (11)).
It is important to mention that in contrast to the calculation of the gas retention time (Section 4.4.2), the volumetric flows are provided at normal conditions in m
3/h (and not m
3N/h or Nm
3/h) [22,67,87]:
GHSV
t=
.
V
G, inV
Rh h
−1i
(10)
GHSV
H2=
.
V
H2,inV
Rh h
−1i
(11)
4.4.2. Gas Retention Time
The gas retention time provides information on the average time the reactant gases remain in the reactor assuming plug-flow (i.e., no back mixing). For both the continuous trickle-bed reactor and the CSTR, the gas retention time τ
Gis defined by the superficial gas velocity v
G,inat reactor pressure and the reactor height h
Rwith the cross-sectional area A
Rwithout reactor internals as follows in Equation (12):
τ
G= h
Rv
G,in= h
.R· A
RV
G,in=
.V
RV
G,in[ s ] (12)
The retention time is calculated by the reactant gas flow or as the mean retention time calculated by the average gas velocity [88]. As the mean retention time depends on the conversion rate, we recommend doing the calculation with the total gas flow. So V
.G,inis specified as the total gas flow (hydrogen, carbon dioxide and other gases if present, e.g., methane or nitrogen) entering the system.
With the methanation reaction progressing, however the gas volumes and volumetric flows are reduced by a factor of five (Equation (1)) and therefore, v
G,inand τ
Gcan have different values at different parts of the reactor. Therefore in Equation (13) we propose a second gas retention time τ
G,avwhich refers to the average gas flow V
.Gbetween V
.G,inand V
.G,out:
τ
G,av= h
Rv
G= h
R.· A
RV
G≈ V
R( V
.G,in+ V
.G,out) /2
[ s ] (13)
4.4.3. Hydraulic Retention Time and Liquid Recirculation
In biological CO
2-Methanation processes, usually there is also an exchange of the reactor liquid. This can be due to the requirement of (i) removing water formed by the methanation reaction (Equation (1)), (ii) a continuous addition of liquid process feeds to maintain the process (see Section 4.5.5 for more information) or (iii) the requirement of liquid recirculation due to the reactor concept e.g., with trickle-bed reactors. Therefore, analogously to τ
G, the hydraulic retention time τ
Lshould be specified:
τ
L= h
Rv
L= h
R· A
RQ
L,total= V
RQ
L,total[ s ] (14)
with the liquid recirculation Q
L,total:
Q
L,total= V
.L,methanation+ V
.L,feeding+ V
.L,recirculation− V
.L,drainedwastewater"
m
3h
#
. (15)
4.4.4. Gas Conversion Rate
The gas conversion rate X can be defined for both feed gases and describes the amount of hydrogen and carbon dioxide consumed for the generation of methane (and biomass). The conversion rate can be specified based on volumetric, mass and molar flows (Equations (16) and (17)):
X
CO2=
V
.CO2,in− V
.CO2,outV
.CO2,in=
m
.CO2,in− m
.CO2,outm
.CO2,in=
n
.CO2,in− n
.CO2,outn
.CO2,in[ − ] (16)
X
H2=
.
V
H2,in− V
.H2,outV
.H2,in=
m
.H2,in− m
.H2,outm
.H2,in=
n
.H2,in− n
.H2,outn
.H2,in[ − ] (17) 4.4.5. Methane Yield
The absolute methane yield Y
CH4provides information on how many normal cubic meters of
gas are required for the generation of one normal cubic meter of methane. We define two methane
Energies2019,12, 1670 15 of 32
yields. The first and preferred one is related to hydrogen because it gives information about the power converted:
Y
CH4:H2=
.
V
CH4,outV
.H2,in= [ − ] (18)
Due to the stoichiometry of the reaction (Equation (1)), this yield can never be higher than 0.25 (Equation (18)). The second yield refers to carbon dioxide Y
CH4:CO2(Equation (19)). In continuous plant operation, this value often contains errors due to high solubility of the carbon dioxide. It can reach a maximum value of 1 or (100%):
Y
CH4:CO2=
.
V
CH4V
.CO2[ − ] (19)
In order to report the yield as value between zero and 100%, the relative methane yield Y
CH4,relis defined by the methane yield relative to the theoretical maximum of 0.25 (Equation (20)):
Y
CH4,rel= Y
CH4:H20.25 [ − ] . (20)
4.4.6. Methane Production Rate
Due to the specific characteristics of reactors used for biological methanation, there are several definitions of the methane production rate (Table 1). We suggest to always indicate two of them: at first the MPR
R(Equation (21)) reporting the methane produced in the system in norm cubic meter per hour normalized to the reactor volume. It provides information on the productivity of the plant:
MPR
R=
.

![Table 5. Overview of the mass transport potential and the energy consumption related to the mass transport in the trickle-bed reactor (TBR), the stirred tank reactor (CSTR), the bubble column reactor (BCR) and the membrane reactor (MR) [81–86].](https://thumb-eu.123doks.com/thumbv2/1library_info/3845031.1514597/10.892.121.778.614.764/overview-transport-potential-consumption-related-transport-trickle-membrane.webp)