• Keine Ergebnisse gefunden

Gene expression analysis of neuronal precursors from adult mouse brain and differential screen for neural stem cell markers

N/A
N/A
Protected

Academic year: 2021

Aktie "Gene expression analysis of neuronal precursors from adult mouse brain and differential screen for neural stem cell markers"

Copied!
107
0
0

Wird geladen.... (Jetzt Volltext ansehen)

Volltext

(1)

Gene expression analysis of neuronal precursors from adult mouse brain and differential screen for

neural stem cell markers

Inaugural-Dissertation

zur Erlangung des Doktorgrades

der Mathematisch-Naturwissenschaftlichen Fakultät der Universität zu Köln

vorgelegt von Sandra Pennartz

aus Krefeld

Köln, 2004

(2)

Berichterstatter: Prof. Dr. Sigrun Korsching

Prof. Dr. Jens Brüning

Dr. Harold Cremer

Tag der mündlichen Prüfung: 03.11.2004

(3)

Zusammenfassung

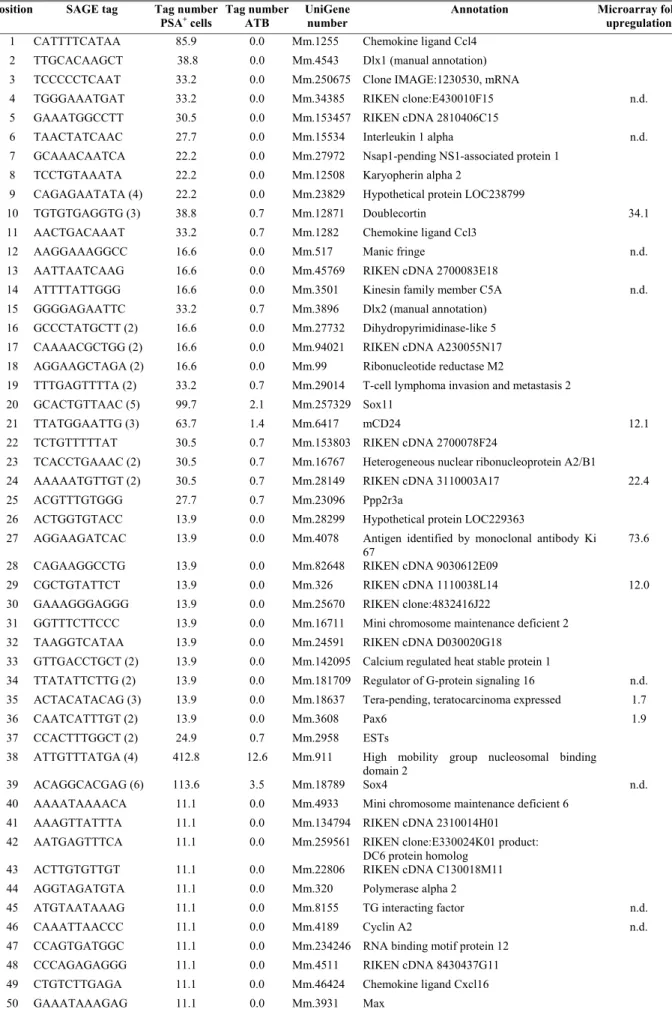
Im adulten Maushirn gehen in der subventrikulären Zone (SVZ) fortwährend neuronale Vorläuferzellen aus neuralen Stammzellen (NSZ) hervor und migrieren in den Bulbus olfactorius (OB), wo sie in GABAerge Interneuronen differenzieren. PSA-NCAM (Polysialic acid-Neural cell adhesion molecule) wird während des Migrationsprozesses spezifisch von den unreifen neuronalen Zellen (PSA + Zellen) exprimiert. Diese Tatsache wurde im Rahmen dieser Doktorarbeit genutzt, um eine homogene Population von neuronalen Vorläuferzellen per FACS (Fluorescence-activated cell sorting) zu isolieren. Die Genexpression der PSA + Zellen wurde umfassend mit Hilfe der Seriellen Analyse der Genexpression (SAGE) untersucht. Der Vergleich der SAGE-Daten von PSA + Zellen und adultem Gesamthirn (ATB) führte zur Identifizierung von Genen, die in den Vorläuferzellen überexprimiert sind. Für ausgewählte Gene wurden die SAGE-Ergebnisse mittels cDNA Microarray und quantitativer Real-time PCR validiert und die zelluläre Expression im Maushirn mit Hilfe von in situ Hybridisierungen analysiert. Zuvor in diesem Zusammenhang beschriebene Gene wie der Proliferationsinhibitor CD24, die Sialyltransferase STX und der Reelin-Rezeptor ApoER2 bestätigten die Identität der Vorläuferzellen und die Präzision der SAGE. Einzelne bereits charakterisierte, aber in der PSA + Zellpopulation noch unbekannte Gene wurden identifiziert ebenso wie die konzertierte Expression funktioneller Gengruppen. Das Vorkommen von Transkriptionsfaktoren der Sox- und Dlx- Familie, Pax6 und Meis2 weist daraufhin, dass die sekundäre Neurogenese weitgehend von den gleichen Faktoren kontrolliert wird wie die primäre in der Embryogenese. Gene für Apoptose und Proliferation werden beide stark exprimiert. Die auffallend hohe Expression chemotaktischer Faktoren legt nahe, dass diese bei der neuronalen Migration eine Rolle spielen könnten. Außerdem wurden gänzlich uncharakterisierte Gene wie zum Beispiel RIKEN 3110003A17 beobachtet. Im Rahmen unserer Kollaboration mit dem Developmental Biology Institute of Marseille entstehen erste auf der SAGE basierende funktionelle Daten.

Das Defizit an Markergenen für NSZ beeinträchtigt den Fortschritt in der Stammzell- forschung. Daher war ein weiteres Ziel dieser Arbeit, potentielle NSZ-Marker durch den Vergleich von SAGE-Daten für emybronale Stammzellen (ES-Zellen), PSA + Zellen und ATB zu identifizieren. Hierzu wurde eine SAGE-Datenbank für Bruce-4 ES-Zellen erstellt. Die verwendete Selektionsstrategie basierte auf zwei Annahmen: Erstens, das Entwicklungs- potential nimmt von ES-Zellen über NSZ, über neuronale Vorläuferzellen bis hin zu adulten Neuronen und Glia ab. Zweitens, die genetischen Programme von ES-Zellen und NSZ überlappen. Unter diesen Voraussetzungen sollten einige der Gene, die in ES-Zellen stark exprimiert werden, aber nur schwach oder gar nicht in PSA + Vorläuferzellen und ATB, in den wenigen NSZ im Gehirn aktiv sein. Acht Gene, die für Zelloberflächenproteine kodieren, wurden von der resultierenden Kandidatenliste ausgewählt und untersucht:

Aufgrund eines fehlerhaften Eintrags in einer öffentlichen Datenbank wurde die Expression für den Glutamattransporter GLT1 mit Hilfe von in situ Hybridisierungen untersucht und in Embryoid bodies, in Neurospheres und bemerkenswerterweise in der SVZ, der neurogenen Zone im adulten Gehirn, nachgewiesen.

Im Rahmen dieser Arbeit wurde das erste Genexpressionsprofil PSA + neuronaler

Vorläuferzellen erstellt, welches gemeinsam mit den SAGE-Daten der Bruce-4 ES-Zellen

eine Ausgangsbasis für zukünftige funktionelle Analysen darstellt.

(4)

Abstract

In the adult mouse brain, neuronal precursor cells continuously emanate from neural stem cells (NSC) in the subventricular zone (SVZ) and migrate into the olfactory bulb (OB) where they differentiate to serve as replenishment for GABAergic interneurons. During the migration process, PSA-NCAM (Polysialic acid-Neural cell adhesion molecule) specifically marks the neuronal precursors (PSA + cells). This phenomenon was exploited in the framework of this doctoral thesis to isolate a homogeneous cell population of neuronal precursor cells using Fluorescence-activated cell sorting. Here, the first comprehensive picture of the gene expression in PSA + precursors was generated using Serial Analysis of Gene Expression (SAGE). Comparison of SAGE data for PSA + cells and for adult total brain (ATB) led to the identification of precursor-enriched genes. For selected genes, the results were validated using cDNA microarrays and quantitative real-time PCR, and the expression was analyzed at the cellular level in mouse brain using in situ hybridizations. Genes previously described in this context like the proliferation inhibitor CD24, the sialyltransferase STX and the Reelin receptor ApoER2 confirmed the identity of the precursor cells and the accuracy of the SAGE. Individual characterized genes that were so far unknown in the PSA + cell population were identified as well as functional groups of genes by means of cluster analysis of SAGE data. The presence of transcription factors of the Sox and Dlx families, Pax6 and Meis2 indicated that secondary neurogenesis might be largely controlled by the same factors that are active during development. Clusters for apoptosis and proliferation are both upregulated. The high expression of chemotactic factors in the neuronal precursors suggests that they might be involved in neuronal cell migration. In addition, novel genes like RIKEN 3110003A17 were observed. First functional data based on the SAGE are being generated in the framework of our collaboration with the Developmental Biology Institute of Marseille.

Given that a lack of markers for NSC considerably impedes progress in NSC biology, the second part of this work aimed at identifying potential NSC markers by comparing SAGE data for embryonic stem (ES) cells, PSA + cells and ATB. The selection strategy was based on two assumptions. First, in a hierarchical order of developmental potential, ES cells are positioned above NSC, which are above restricted precursors that in turn are above adult neurons and glia. Second, the genetic programs of ES cells and NSC overlap. Thus, genes that are highly expressed in ES cells and downregulated or absent in PSA + neuronal precursors and ATB should in part also be expressed by the few stem cells in the adult brain. Eight candidates coding for cell surface proteins were identified from the resulting list of candidates and were investigated.

Due to a public database mistake in situ hybridizations were performed for the glutamate transporter GLT1 and demonstrated expression in embryoid bodies, neurospheres and, strikingly, in the SVZ, the neurogenic area of the mouse forebrain.

Taken together, this doctoral thesis generated the first gene expression profile for PSA +

neuronal precursors, which -together with the SAGE library for Bruce-4 ES cells- will serve

as a starting basis for future functional analysis.

(5)

Abbreviations

Ara-C Cytosine-ß-D-arabinofuranoside aRNA Amplified RNA

ATB Adult total brain

bp Base pair(s)

BrdU 5-Bromo-2-deoxyuridine BSA Bovine serum albumin

cDNA Copy DNA

CGCP Cerebellar granule cell precursor cell(s) CNS Central nervous system

dATP Deoxyadenosine triphosphate dCTP Deoxycytosine triphosphate dGTP Deoxyguanosine triphosphate

DiI 1,19-dioctadecyl-6,69-di(4-sulfophenyl)-3,3,39,39-tetramethyl- indocarbocyanine

DMEM Dulbecco’s modified Eagle’s medium DNA Deoxyribonucleic acid

dNTPs Deoxyribonucleotid triphosphate dTTP Deoxythymidine triphosphate

E Embryonic day

EC Embryonic carcinoma ECM Extracellular matrix

ES Embryonic stem

FACS Fluorescence-activated cell sorting FCS Fetal calf serum

GFAP Glial fibrillary acid protein GO (A) Gene Ontology (Annotation) h Hours

HBSS Hank’s Balanced Salt Solution LV Lateral ventricle

min Minutes

NSC Neural stem cell(s)

Nt Nucleotides

OB Olfactory bulb

P Postnatal day

PBS Phosphate-buffered saline PCR Polymerase chain reaction

PIQOR Parallel Identification and quantification of RNAs qPCR Quantitative real-time PCR

RMS Rostral migratory stream RNA Ribonucleic acid

RT Room temperature

SAGE Serial analysis of gene expression

sec Seconds

SGZ Subgranular zone

SSC Saline sodium citrate

SVZ Subventricular zone

Tk Thymidine kinase

VZ Ventricular zone

(6)

CONTENTS

1 INTRODUCTION...1

1.1 Neurogenesis in the adult mammalian brain ...1

1.1.1 Neuronal precursors are born in the adult SVZ and become olfactory bulb interneurons ...1

1.1.2 The hippocampal subgranular zone produces new granule neurons ...7

1.1.3 Adult neural stem cells and the search for marker genes ...8

1.1.3.1 Specific genetic markers for NSC have not been identified...10

1.2 Aim of the study...13

2 MATERIALS AND METHODS...15

2.1 Gene expression analyses ...15

2.1.1 SVZ dissection and dissociation...15

2.1.2 Purification of PSA + cells by FACS...15

2.1.3 RNA isolation...16

2.1.4 Serial analysis of gene expression (SAGE)...16

2.1.5 Microarrays...17

2.1.6 Quantitative real-time PCR (qPCR) ...18

2.2 Cell culture ...19

2.2.1 General cell culture conditions...19

2.2.2 TE 671 cell line ...19

2.2.3 ES cell line Bruce-4...19

2.2.4 Preparation of embryoid bodies...20

2.2.5 Preparation of neurospheres ...20

2.3 Histological analyses...21

2.3.1 Preparation of cryosections ...21

2.3.2 In situ hybridizations ...22

2.3.2.1 Generation of Digoxigenin-labeled RNA probes ...22

2.3.2.2 Hybridization...23

(7)

2.3.3 Immunohistochemistry ...24

2.3.3.1 Staining with a peroxidase system...24

2.3.3.2 Immunofluorescence ...25

2.3.3.3 Primary antibodies...25

2.3.3.4 Secondary antibodies...25

2.3.4 Microscopy ...26

3 RESULTS ...27

3.1 Choice of SAGE libraries...27

3.1.1 Isolation of PSA + neuronal precursor cells from the adult mouse brain ...27

3.1.1.1 Control experiments with the human cell line TE 671...29

3.1.2 Isolation of Bruce-4 ES cells...29

3.2 Generation of SAGE libraries for PSA + precursors and ES cells...30

3.3 PSA + cell-enriched genes identified by SAGE ...31

3.3.1 Clustering of SAGE data ...36

3.3.2 Validation of SAGE results using microarrays and qPCR ...40

3.3.3 In situ hybridizations for selected genes in mouse brain...42

3.3.4 Analysis of the rostral migratory stream in PlexinA3-deficient mice ...45

3.4 Genes identified in ES cells by SAGE...46

3.4.1 Characteristic genes for pluripotent cells ...46

3.4.2 Selection of potential NSC marker genes...49

3.4.3 Investigation of potential NSC marker genes...51

3.4.3.1 Expression in embryoid bodies and neurospheres...51

3.4.3.2 Expression in mouse brain...52

3.5 Analysis of GLT1 expression...54

4 DISCUSSION...62

4.1 Gene expression analyses ...62

4.2 Transcriptome analysis of PSA + neuronal precursor cells ...63

4.2.1 Already known genes confirm the SAGE results...63

(8)

4.2.2 Novel genes were identified in the PSA + cell population ...63

4.2.3 First functional data based on the SAGE results are generated...68

4.3 Analysis of ES cell-enriched genes and potential NSC markers ...69

4.3.1 Characteristic genes confirm pluripotency of ES cells...69

4.3.2 Potential NSC markers were selected from the SAGE data...71

4.4 Intense GLT1 expression was found in a neurogenic area ...73

4.4.1 Future experiments for GLT1...76

4.5 Conclusions and outlook ...76

5 REFERENCES...78

ACKNOWLEDGMENT…...….……….………97

ERKLÄRUNG………..………..98

LEBENSLAUF…………...………99

(9)

1 Introduction

1.1 Neurogenesis in the adult mammalian brain

Neurogenic forces were assumed to die down around birth resulting in an adult mammalian brain without regenerative capacity. The scarcity of mitoses in the adult CNS, an event never observed in differentiated neurons, significantly contributed to the formation and obstinate preservation of this view. The dogma of lacking neurogenesis in the adult brain was first challenged by Joseph Altman in the 1960s (Altman, 1962; Altman, 1969; Altman, 1963).

Using autoradiographic analyses, he observed cell proliferation and migration in postnatal mammalian brains, but failed to demonstrate the neuronal identity of these cells. The concept of nonexistent adult neurogenesis prevailed until the 1980s, when Nottebohm et al.

discovered newborn neurons in adult canary brains (Burd and Nottebohm, 1985; Goldman and Nottebohm, 1983). In the mammalian brain, evidence for the phenomenon accumulated, but the breakthrough was achieved only in 1992 by Weiss et al. with the demonstration of EGF-induced proliferation of isolated brain cells and the generation of new neurons (Alvarez- Buylla and Lois, 1995; Bayer et al., 1980; Reynolds and Weiss, 1992). Further experiments in mice showed precisely that only a subset of neurons is replaced and that highly neurogenic capacity is restricted to small regions, namely the subventricular zone (SVZ) (Doetsch et al., 1999a; Morshead et al., 1994; Reynolds and Weiss, 1996) and the dentate gyrus of the hippocampus (Cameron et al., 1993; Seri et al., 2001). Today, the existence of multipotent neural stem cells (NSC), the source of neurogenesis, in the adult brain is indisputable, although they have not been identified at cellular level yet. The presence of NSC was also confirmed in the SVZ and hippocampus of the human brain where their activity seems to be substantially reduced (Eriksson et al., 1998; Sanai et al., 2004).

1.1.1 Neuronal precursors are born in the adult SVZ and become olfactory bulb interneurons

Neurogenesis in the SVZ of adult mouse brain produces neuronal precursor cells, which migrate along the rostral migratory stream (RMS) into the olfactory bulb (OB) (Altman, 1969;

Lois and Alvarez-Buylla, 1994; Luskin, 1993). Upon arrival, they differentiate into

GABAergic interneurons and contribute to the regulation of the olfactory system (Carleton et

al., 2003; Gheusi et al., 2000).

(10)

The SVZ forms during development, at E11.5, adjacent to the ventricular zone (VZ) (Zimmer et al., 2004). While the latter diminishes and vanishes at birth, the former persists into adulthood. The SVZ then extends along the lateral wall of the lateral ventricle (LV), which is lined by the ependyma, an epithelial monolayer representing the vestiges of the VZ. The roof of the LV and the medial wall facing the septum are largely devoid of SVZ. Doetsch et al.

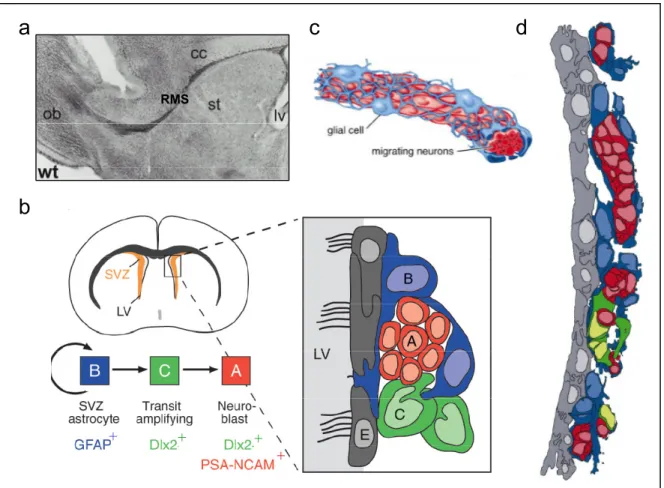
described the cellular composition and architecture of the SVZ based on ultrastructural and immunocytochemical characteristics (Doetsch et al., 1997). Four main cell types constitute the SVZ: ependymal cells (28%), astrocytes (B cells, 23%), rapidly dividing transit- amplifying C cells (11%) and migrating neuronal precursors (A cells, 33%) (Fig. 1).

Fig. 1 Localization and cellular composition of the adult SVZ and RMS. (a ) Nissl staining of adult mouse brain (sagittal section) clearly brings out the RMS that is created by migrating PSA + neuronal precursor cells and connects LV and OB. (b) A schematic representation of a coronally sectioned adult mouse brain shows the location of the SVZ adjacent to the LV. SVZ astrocytes (B cells) give rise to transit-amplifying C cells, which produce the PSA + cells (A cells). Next to the layer of ependymal cells (grey), A cells migrate through tunnels of astrocytes. Occasionally, an astrocyte contacts the LV with a single cilium. (c ) The RMS consists mainly of PSA + cells (red) ensheathed by astrocytes (blue). (d) This schematic SVZ representation was interpreted from serial section reconstructions at the electron microscope and illustrates how the different cell types are distributed along the LV. cc: corpus callosum, LV: lateral ventricle, OB: olfactory bulb, RMS: rostral migratory stream, ST: striatum, wt:wild type. Adapted from Chazal et al, 2000 ; Doetsch et al., 2000 ; Lie et al., 2004 ; Doetsch et al., 1997.

d

a c

b

RMS

+

+ + +

(11)

Ependymal cells are terminally differentiated and mitotically inactive cells. They possess multiple cilia reaching into the lumen and are immunoreactive for CD24 (leukocyte cluster of differentiation 24) (Tab. 1). The star-shaped astrocytes express glial fibrillary acid protein (GFAP) and are subdivided into B1 and B2 astrocytes: B1 cells separate the A cells from the ependyma, while B2 cells are located between A cells and striatum. An interesting feature of B1 cells is the occasional contact of the LV via a single cilium that is distinct from those of the ependymal cells in that it lacks a central pair of microtubules and is six times shorter (Doetsch et al., 1999b). Lineage tracing studies using the antimitotic drug Ara-C followed by labeling with 3 H-thymidine or replication-deficient retroviruses showed that B cells give rise to C cells, which in turn produce A cells (Doetsch et al., 1999a; Doetsch et al., 1999b). The highly mitotic C cells occur in small clusters contacting the A cells (Doetsch et al., 1997) (Fig. 1). C cells can be isolated by sorting for Dlx2 + (Distal-less homeobox2), PSA-NCAM - (Polysialic acid-Neural cell adhesion molecule) cells (Doetsch et al., 2002). The neuronal precursors form a large network of chains ensheathed by tunnels of astrocytes throughout the SVZ, primarily in the anterior part, and coalesce in the RMS (Doetsch and Alvarez-Buylla, 1996). They can be readily identified and isolated by the expression of PSA-NCAM and will also be referred to as PSA + cells (Pennartz et al., 2004; Rousselot et al., 1995) (Tab. 1). In addition, they express the proliferation inhibitor CD24 (Belvindrah et al., 2002) and Doublecortin (Dcx), a marker for migrating neurons in the postnatal brain (Gleeson et al., 1999). All four cell types express the intermediate filament Nestin, which was originally found as a neuroepithelial stem cell marker (Doetsch et al., 1997; Lendahl et al., 1990).

Tab. 1 Markers for different SVZ cell types.

The four principle cell types of the SVZ can be distinguished by immunostaining for the selected markers in this table. “mono” indicates that a monoclonal antibody was used against GFAP. Modified from Doetsch et al., 2002.

The RMS is predominantly populated with PSA + cells (almost 80 %), contains only one type of B cell and is devoid of C cells (Doetsch et al., 1997). The immature PSA + cells are surrounded by a tunnel of astrocytes and migrate tangentially towards the OB (Fig. 1c).

Nestin + + + +

cells

(12)

Within the RMS, they continue to use their characteristic chain migration (Lois et al., 1996) without the usual means of migration, the guidance of radial glia (Rakic, 1972) or axons (Gray and Sanes, 1991). Chain migration is astrocyte-independent and can be reconstituted in vitro using an artificial extracellular matrix (ECM) (Wichterle et al., 1997). Some of the molecular cues regulating the migration process have been unraveled. In NCAM-deficient mice, migration is inhibited, and the neuronal precursors accumulate in the SVZ, which results in a drastically reduced OB (Chazal et al., 2000; Cremer et al., 1994). Further experiments revealed that the enzymatic removal of PSA disrupts chain migration in vitro and in vivo indicating that the PSA moiety (α-2,8 linked polysialic acid) attached to NCAM is the essential factor for chain migration (Hu, 2000; Ono et al., 1994). PSA is mainly transferred to NCAM by the sialyltransferases ST8SiaII (STX) (Livingston and Paulson, 1993) and ST8SiaIV (PST) (Eckhardt et al., 2000; Yoshida et al., 1995). While STX is responsible for polysialylation of NCAM during embryogenesis and until shortly after birth, PST expression is low during development and prevails in adult animals (Kurosawa et al., 1997; Ong et al., 1998). In contrast to the developing brain, where PSA-NCAM is widely expressed, in the postnatal brain, it is found only on immature precursors in SVZ and RMS as well as in the dentate gyrus (Durbec and Cremer, 2001; Rutishauser and Landmesser, 1996). As the neuronal precursors switch to radial migration in the OB and continue to differentiate, expression of PSA-NCAM ceases (Rousselot et al., 1995).

Moreover, Eph/ephrin signaling is involved in PSA + cell migration and regulation of cell proliferation (Conover et al., 2000). The chemorepellents Slit1 and Slit2 repulse the neuronal precursors away from the SVZ (Hu, 1999; Nguyen-Ba-Charvet et al., 2004; Wu et al., 1999).

Netrin-1/DCC interaction helps to attract the PSA + cells in the OB by regulating the formation of directed protrusions (Murase and Horwitz, 2002). Mitral cells and granule cells secrete the ECM glycoproteins Reelin and Tenascin-R, respectively, which initiate the switch from tangential to radial migration in the OB and serve as detachment signals leading to the disassembly of the chains (Hack et al., 2002; Saghatelyan et al., 2004). Expression of the Reelin receptor, apolipoprotein E receptor2 (ApoER2), in PSA + cells has been proven.

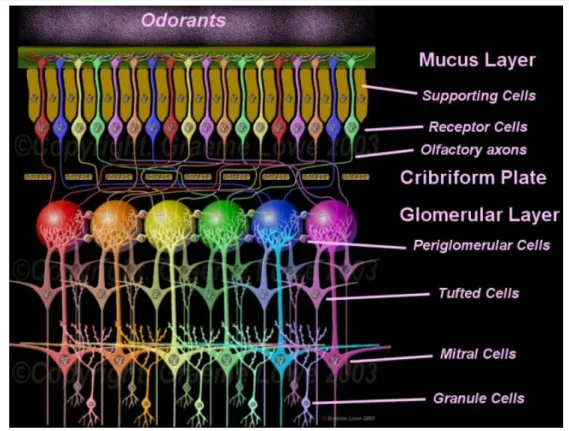
After completing radial migration, the cells differentiate into two classes of GABAergic interneurons in the OB, the center of odor processing (Fig. 2) (Lois and Alvarez-Buylla, 1994;

Luskin, 1993). Here, odor-evoked action potentials propagated along olfactory axons

converge in the glomeruli where excitatory synapses confer the signal to projection neurons,

the tufted and mitral cells (Carleton et al., 2002). The long axons of the projection neurons

transmit the signal to the olfactory cortex. Each sensory neuron expresses only one odorant

(13)

receptor gene and projects a single axon to a glomerulus. About 1000 sensory axons of the same kind converge on the dendritic arbor of a mitral cell, which results in an amplification of sensory signals. Lateral inhibition through GABA release by interneurons at two levels is thought to refine odor discrimination (Carleton et al., 2002; Gheusi et al., 2000). A few PSA + cells become periglomerular interneurons, which are located between the glomeruli and form reciprocal dendrodendritic synapses with mitral and tufted cells (Lowe, 2003).

Fig. 2 Organization of the olfactory system. The glomeruli of the olfactory bulb are convergence sites for input from olfactory axons of receptor cells in the olfactory epithelium. Each tufted and mitral cell has a single dendrite that terminates within a glomerulus. Signals are relayed from the sensory neurons via the axons of tufted and mitral cells to the olfactory cortex. Signal modulation through lateral inhibition occurs at two sites.

Periglomerular interneurons between the glomeruli release GABA in response to glutamate release from primary dendrites of mitral and tufted cells. Granule interneurons are depolarized by glutamate from mitral cells and in turn inhibit mitral and tufted cells by GABA release. Periglomerular and granule cells are constantly replaced by newly arriving PSA + neuronal precursors. With kind permission of Graeme Lowe ©Copyright 2003 (http://flavor.monell.org/~loweg/index.htm)

Most precursors become anaxonic granule interneurons, which are located deeper in the OB

beneath the glomerular layer and interlink the secondary dendrites of mitral and tufted cells

again by making dendrodendritic synapses. Activity in a mitral or tufted cell innervating one

glomerulus leads to suppression of mitral or tufted cells innervating neighboring glomeruli

(Yokoi et al., 1995). The factors that decide on the differentiation into granule or

periglomerular cells have not been determined yet. While the majority of the cells is

(14)

GABAergic, a minor subset becomes dopaminergic (Baker et al., 2001). Petreanu et al.

divided the maturation process of new granule interneurons into five stages according to their morphology and location (Petreanu and Alvarez-Buylla, 2002). Carleton et al. labeled the precursors with GFP using a replication-deficient retrovirus to explore the temporal sequence of electrophysiological changes (Carleton et al., 2003). Class 1 cells are the migrating cells in RMS, which display immature properties (Stewart et al., 1999) and express PSA-NCAM.

They do not form synapses (Lois et al., 1996), many express GABA A receptors and then AMPA receptors (Carleton et al., 2003). Radially migrating granule cells in the OB that express NMDA receptors belong to class 2. Class 3 comprises maturing granule cells that have completed migration and do not extend beyond the mitral cell layer. First synaptic connections and ongoing growth of dendrites can be observed. Class 4 granule cells develop dendritic abors in the external plexiform layer beneath the glomerular layer and possess very few first spines. Unlike developing neurons in embryogenesis, these cells acquire the ability to generate action potentials only late as class 5 granule cells, which exhibit dendritic trees with many spines. PSA-NCAM expression has ceased. The mature cells show electrophysiological characteristics indistinguishable from old granule cells. The order of acquired electrophysiological properties of the newcomers differs from the order of events seen in primary neurogenesis where NMDA receptors precede AMPA receptors (Carleton et al., 2003). Carleton et al. concluded that the delayed maturation of excitability in secondary neurogenesis might be ascribed to a mechanism protecting preexisting functional circuits from uncontrolled neurotransmitter release and disruption by new cells. The period from birth in the SVZ to functional integration in the OB lasts about two weeks. Over half of the newly integrated cells die within 4 weeks. These analyses prove the functional contribution of new neurons to the adult OB. However, why the continuous supply of new neurons is a necessity throughout life is still unclear. The steady elimination and integration of cells is supposed to permit a high degree of circuit adaptation and plasticity in the neuronal network. NCAM- deficient mice, in which the OB receives no supply of new interneurons, show impaired odor discrimination but normal odor detection and odor memory (Gheusi et al., 2000).

Another interesting feature of PSA + cells is their strong mitotic activity. By contrast, neurons

during development are already postmitotic at the time of migration (Frazier-Cierpial and

Brunjes, 1989). PSA + cells are committed to become neurons before exiting the cell cycle

(Menezes et al., 1995). While the cells keep proliferating throughout the RMS, the majority of

them never reaches the OB but undergoes apoptosis (Morshead and van der Kooy, 1992). The

factors that control cell numbers in the RMS are unknown.

(15)

Transplantation of postnatal PSA + cells showed that the precursors are incorporated into diverse CNS regions but not, for example, into cortex and hippocampus (Lim et al., 1997).

The transplanted cells were never observed to form projection neurons, only interneurons.

These results indicate that the neuronal precursors have a more restricted potential than NSC, which was further demonstrated by their disability to form Neurospheres (1.1.3) (Gritti et al., 2002). However, the potential of PSA + cells is not restricted to the neuronal lineage. Upon lesions in the corpus callosum, small chains of PSA + cells migrate there and form oligodendrocytes and astrocytes (Nait-Oumesmar et al., 1999). The report by Sanai et al. that, in the human brain, the presence of these neuronal precursors and the RMS is difficult to verify, has disillusioned scientists in view of a direct therapeutical application of PSA + cells (Sanai et al., 2004). Nonetheless, insights from the investigation of the murine precursors can be exploited to improve cell replacement strategies. Knowledge about the genes underlying migration and differentiation is essential for brain repair. Replacement of neurons in the adult brain signifies integrating new cells into preexisting circuits, of which the possibility is generally controversial for humans (Rakic, 2004). Since there are differences in the maturation process between embryonic precursors and those in adult neurogenesis, PSA + cells can serve as a model for brain repair (Carleton et al., 2003).

PSA + cells represent an interesting intermediate state in neural differentiation between NSC and mature neurons. Although some of the factors controlling the fate of the cells, their special mode of migration and their targeting to the OB were discovered, they represent only small pieces of a molecular jigsaw. A gene expression analysis could contribute to the identification of the missing “pieces” that would allow subsequent functional analyses to determine how they fit into the molecular picture.

1.1.2 The hippocampal subgranular zone produces new granule neurons

Even though the present study focuses on the SVZ, the hippocampus, the second neurogenic

area, should be briefly delineated. The subgranular zone (SGZ) of the dentate gyrus lies

between the granule cell layer and the hilus. Here, neurogenesis was also demonstrated in the

human adult brain (Eriksson et al., 1998). The functional integration of newly generated

granule neurons into the hippocampus was shown by electrophysiological studies in mice

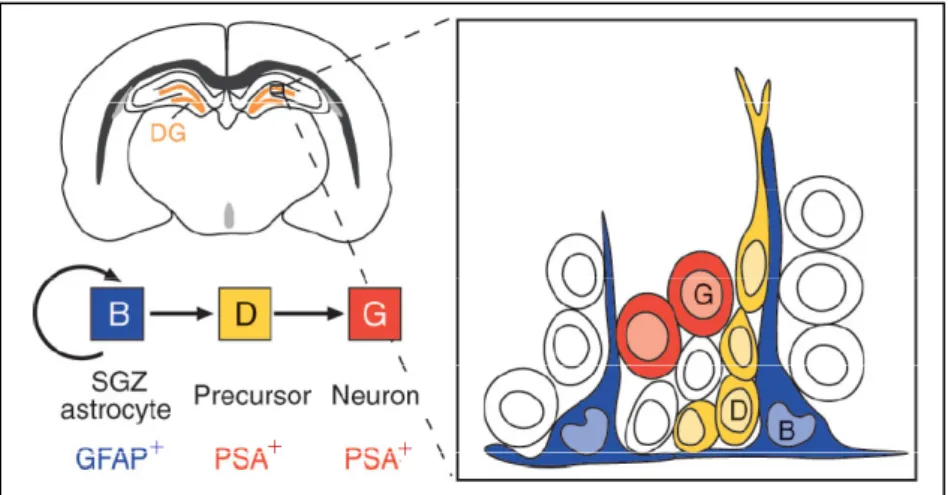
(Song et al., 2002; van Praag et al., 2002). According to the group of Alvarez-Buylla, GFAP +

astrocytes (B cells) function as NSC and give rise to intermediate cells (D cells), which divide

with a lower frequency and are more differentiated than the C cells of the SVZ. D cells in turn

(16)

produce new granule cells (G cells) that migrate only a short distance to integrate into the hippocampal granule cell layer (Fig. 3) (Doetsch, 2003; Seri et al., 2001).

Fig. 3 Cell types in the SGZ of the hippocampus. This schematic representation of a coronal brain section shows the site of secondary neurogenesis in the hippocampus. SGZ astrocytes (B cells) give rise to intermediate precursors (D cells), which produce granule neurons (G cells). (Taken from Doetsch, 2003)

Van der Kooy holds another view claiming that the hippocampus contains committed neural and glial progenitor cells, but not NSC (Morshead and van der Kooy, 2004; Seaberg and van der Kooy, 2002). However, his conclusions were drawn from experiments in vitro and might be ascribed to the lack of a factor necessary for NSC from the SGZ but not from the SVZ. A recent study suggested that cells differentiating into GABAergic interneurons in the hippocampus are recruited from the posterior SVZ (Aguirre et al., 2004). Hippocampal neurogenesis might be involved in learning and memory (Kempermann, 2002). Physical exercise and higher demands through an enriched environment increased neurogenesis in mice (van Praag et al., 1999).

1.1.3 Adult neural stem cells and the search for marker genes

NSC are defined by their capacity to self-renew and by multipotency, the ability to give rise to the three major cell types of the CNS: neurons, astrocytes and oligodendrocytes (Gage, 2000;

Pevny and Rao, 2003; Zappone et al., 2000). NSC can be identified solely retrospectively in culture where they proliferate in the presence of epidermal growth factor (EGF) and basic fibroblast growth factor (bFGF) and form floating clonal aggregates, named neurospheres, which contain a small percentage of NSC (Gritti et al., 1999; Reynolds and Weiss, 1992). It is conceivable that the lineage relationship in neurospheres resembles the one observed in vivo (NSC→ C cells→A cells) (Morshead and van der Kooy, 2004). BrdU incorporation studies as

+ + +

(17)

well as elimination of mitotically active cells in the SVZ and subsequent labeling or neurosphere cultures indicated that NSC are slowly dividing, quiescent cells (Gritti et al., 2002; Morshead et al., 1994). They are characterized by their extremely low frequency in the mammalian brain, which renders their examination so difficult. Whereas amphibians, reptiles and birds have a remarkable capacity for brain regeneration, which is due to neurogenic radial glia in the adult VZ, neurogenesis is dramatically reduced in mammalian adult brains (Garcia- Verdugo et al., 2002). Although NSC have been found in the entire rostrocaudal axis and other CNS regions (Gritti et al., 2002; Palmer et al., 1999), new cells are generated exclusively in the SVZ and (maybe) the SGZ of dentate gyrus where NSC are relatively concentrated. According to rough estimations, 0.2-0.4% of SVZ cells function as NSC (Morshead et al., 1998; Rietze et al., 2001).

The restriction of neurogenesis to these areas can be explained by the local environment. In SVZ and hippocampus, NSC reside in a stem cell “niche”, a specialized microenvironment, which comprises cell-cell-interactions, the vasculature and the ECM (Doetsch, 2003; Palmer et al., 2000; Spradling et al., 2001). Ependymal cells, for example, express bone morphogenetic proteins (BMP) antagonist Noggin (Lim et al., 2000). As BMP inhibit neurogenesis, Noggin contributes to the creation of a neurogenic environment by blocking BMP signaling. Astrocytes populations in neurogenic and nonneurogenic regions were shown to be distinct (Lim and Alvarez-Buylla, 1999; Song et al., 2002). While hippocampal and SVZ astrocytes promoted neurogenesis, spinal cord-derived astrocytes had no impact. The close proximity to the basal lamina of blood vessels that was only recently discovered in the SVZ by Mercier et al. has gained in importance (Alvarez-Buylla and Lim, 2004; Mercier et al., 2002). Endothelial cells around the vessels secrete factors that elicit NSC proliferation and neuron production (Shen et al., 2004).

The NSC present in the adult SVZ can be distinguished from fetal NSC (neuroepithelial stem

cells), which can be isolated from the VZ during development (Cai et al., 2002; Ciccolini,

2001; Pevny and Rao, 2003). In this work, the general term “NSC” refers to adult NSC unless

otherwise indicated. Fetal NSC are morphologically distinct from adult NSC, are GFAP-

negative (Imura et al., 2003) and respond only to bFGF but not EGF because they lack the

EGF receptor. They generate projection neurons while adult NSC generate primarily

interneurons. Both types form neurospheres, express Nestin and lack the expression of

lineage-specific markers. Adult NSC can be isolated from E14 onwards. Apparently, the

properties of NSC change in the course of development (Murayama et al., 2002). While

(18)

strongly proliferating stem cells in fetal development conduct corticogenesis, few quiescent stem cells represent the remnants of development in the adult brain (Cai et al., 2002).

Given that the adult mammalian brain and spinal cord do not recover from injury, the regenerative capacity of NSC has been investigated also in regard of treatment for neurodegenerative diseases. The ultimate goal is to mobilize endogenous NSC or to derive them from the very patient for subsequent transplantation. In any case, NSC would not provoke rejection by the immune system contrary to ES (embryonic stem) cells and their (neuronal) derivatives. ES cells were shown to form teratomas upon injection (Lovell-Badge, 2001). In addition, isolation of NSC is ethically unobjectionable.

Multipotent NSC can be propagated in vitro as neurospheres, tagged with markers and grafted into the brain where they adapt to the region: NSC in the form of neurospheres from the SGZ were shown to differentiate into GABAergic interneurons upon transplantation into the SVZ (Gage et al., 1995; Suhonen et al., 1996). A potential beyond the generation of brain cells was revealed when NSC were injected into blastocysts and contributed to multiple organs of all three germ layers (Clarke et al., 2000). Several studies have reported augmented neurogenesis in response to mechanical lesions, ischemia or seizure in rodent brains (Jin et al., 2001; Kee et al., 2001). The effect was much weaker in nonneurogenic regions distant from the SVZ.

Concomitant infusion of growth factors into the LV produced more new neurons and led to moderate behavioral recovery (Fallon et al., 2000; Nakatomi et al., 2002). NSC might be suitable for neuronal cell replacement, but the functional properties of the new neurons are still unclear and lost cells have not been sufficiently replaced yet (Lie et al., 2004).

1.1.3.1 Specific genetic markers for NSC have not been identified

The present lack of markers for NSC impedes their isolation, further characterization and therapeutic use. It also keeps their exact cellular localization in the adult brain in the dark.

Johansson et al. suggested that the ependymal cells of the SVZ function as NSC (Johansson et al., 1999). The study was based on the fluorescent label DiI, which was supposed to be specific for ependymal cells but obviously must have been transferred to neighboring cells, given that the results were disproved. The opposing notion was established by the group of Alvarez-Buylla with the demonstration that SVZ astrocytes contain the NSC (Doetsch et al., 1999a). The infusion of Ara-C into the SVZ for 6 days eliminated rapidly dividing cells, the C and A cells. The astrocytes were reduced in number as compared to untreated mice suggesting that during the 6 days some of them underwent division and died (Doetsch et al., 1999b).

BrdU and 3 H-thymidine showed that C cells reappeared after 2 days and A cells after 4 days.

(19)

Within 14 days, the SVZ was regenerated completely. Specific labeling of astrocytes using a replication-deficient retrovirus demonstrated that the newly generated cells were GFAP- positive, thus derived from astrocytes. Doetsch et al. found that the DiI experiment was not reproducible (Doetsch et al., 1999a).

Further studies corroborated the idea that NSC are a subpopulation of astrocytes and reported that ependymal cells from adult or early postnatal mice are capable of generating neurospheres, which did not display features of multipotency and self-renewal classifying them as unipotent (Chiasson et al., 1999; Laywell et al., 2000). Specific elimination of astrocytes in combination with neurosphere assays proved that all NSC are GFAP-positive and thereby ruled out the possibility that an unidentified cell type functions as NSC giving rise to GFAP + cells (Imura et al., 2003; Morshead et al., 2003). Alvarez-Buylla extended the hypothesis to the existence of a neuroepithelial-radial glia-astrocyte lineage that contains the NSC (Alvarez-Buylla et al., 2001; Doetsch, 2003). This view formed due to several observations; for example, radial glia convert into astrocytes in newborn mammals (Voigt, 1989) while they persist in non-mammalian vertebrate adult brains to function as primary precursors for neurons (Garcia-Verdugo et al., 2002). Furthermore, a single cilium contacting the ventricle lumen is present on neuroepithelial stem cells, radial glia and on a few SVZ astrocytes and shows identical characteristic features in all three cell types (Alvarez-Buylla et al., 2001; Doetsch, 2003).

Despite all the evidence, GFAP expression in NSC is still controversial. In any case, consensus is that GFAP by itself is not indicative of a NSC. For the NSC state, it is neither necessary, since it is not found in retinal stem cells (and fetal NSC), nor sufficient as it is expressed in nonneurogenic cells (Morshead and van der Kooy, 2004).

FACS isolation of CD133 + , CD24 -/lo cells from human fetal brain tissue resulted in a cell population of which 4.3% gave rise to neurospheres (Uchida et al., 2000). Combining sequential selection steps based on large cell size and absence of peanut agglutinin (PNA) and CD24 led to 80 % enrichment of murine SVZ NSC (Rietze et al., 2001). However, only 63%

of the total neurosphere-forming activity was contained in this population leaving behind NSC with different characteristics. Immunocytochemistry failed to demonstrate GFAP expression on the selected cells. The selection criteria were criticized by later studies (Morshead and van der Kooy, 2004; Murayama et al., 2002).

Capela et al. achieved a 25-fold enrichment of NSC when they isolated 4% of SVZ cells

using LeX (Capela and Temple, 2002). LeX is a carbohydrate that is also known as CD15

(leukocyte cluster of differentiation 15) or SSEA-1 (stage-specific embryonic antigen1). LeX

(20)

was previously found on the surface of mouse ES cells and other pluripotent cells, in embryonic germinal zones and on subpopulations of cells in the adult CNS. Strikingly, LeX + cells were found in the SVZ and encompass all neurosphere-forming cells of the SVZ. 6% of the 12% SVZ astrocytes are LeX-positive, thus, 0.7% of all SVZ cells are LeX-expressing astrocytes. 18% LeX + cells express GFAP. If it is true that C cells are capable of generating neurospheres (Doetsch et al., 2002) and LeX labeling comprises all neurospheres-forming cells (Capela and Temple, 2002), then LeX is likely to be expressed also by C cells (which has not been ascertained yet). LeX expression is also found in association with blood vessels and close to the pial surface, i.e. in regions where a basal lamina is present (Alvarez-Buylla and Lim, 2004). Capela et al. refuted Johansson’s results by showing that ependymal cells selected by CD24 expression or presence of cilia did not generate proper neurospheres that are multipotent and capable of self-renewal (Capela and Temple, 2002).

The transcription factor Sox2 is expressed in ES cells, neural progenitors and is found in the SVZ and the RMS (Graham et al., 2003; Zappone et al., 2000). Sox2 regulatory sequences (SRR) were suggested to interact with octamer transcription factors and to be involved in multipotency-specific expression in ES cells and NSC. Transgenic mice expressing GFP under the control of SRR2 have been used to isolate cells, of which some were multipotent (Miyagi et al., 2004; Pevny and Rao, 2003).

The expression of the nuclear orphan receptor TLX was reported to maintain NSC in an undifferentiated, proliferative state and to be intimately linked to GFAP expression despite high expression in adult brain (Shi et al., 2004). Using a ß-galactosidase reporter under the control of the TLX promoter, Shi et al. showed that TLX expression co-localized in part with BrdU and Nestin (Tab. 1) in the SVZ. TLX + cells isolated by FACS are multipotent and self- renewing but do not express GFAP (Shi et al., 2004) challenging the prevailing hypothesis that all NSC are GFAP-positive. Interestingly, in TLX mutant mice, BrdU labeling was found neither in the SVZ nor in the hippocampus. However, TLX is not a cell surface protein and was not able to isolate a pure NSC population.

The ABCG2 (Brcp1) transporter mediates the efflux of the fluorescent DNA-binding dye

Hoechst 33342 and has been exploited for the isolation of hematopoetic stem cells by sorting

for a population with low Hoechst fluorescence, which was termed “side population” (SP)

(Goodell et al., 1996; Scharenberg et al., 2002). Although ABCG2 was detectable at E10.5

(absent at E14.5) no isolation of fetal NSC from embryonic brain was feasible (Cai et al.,

2002). When this sorting method was used to isolate cells from neurospheres of embryonic

and adult origin, (only) the adult SP cells lacked expression of ABGC2 (Kim and Morshead,

(21)

2003). The SP method is neither powerful enough for isolation of cells from primary tissue nor suitable to tackle the question of NSC localization in vivo. In addition, Hoechst dye was shown to exert a cytotoxic effect (Kim and Morshead, 2003).

To date, no isolation strategy has been able to generate a pure NSC population, and a true NSC marker -ideally a transmembrane protein convenient for isolation- is still missing.

1.2 Aim of the study

PSA + cells represent migratory neuronal precursors between NSC-derived transit-amplifying precursors and differentiated neurons. Therefore, they are of great interest for the analysis of developmental processes, neuronal migration and differentiation. The neuronal precursors are the product of secondary neurogenesis in the SVZ and can teach how newly generated cells find their place in the adult brain. Previously, only single genes have been examined in PSA + cells; therefore, in the framework of the present doctoral thesis, a comprehensive analysis of transcriptome using SAGE (Serial analysis of gene expression) was to be performed to gain insight into their molecular nature. A homogeneous population of PSA + precursors was to be isolated from the adult brain using Fluorescence-activated cell sorting (FACS). In order to identify precursor cell-enriched genes, the SAGE library of PSA + cells was to be contrasted with SAGE data of adult total brain (ATB) representing mature neuronal and glial cells.

Subsequently, this study intended to demonstrate the expression of these genes selectively at cellular level in SVZ and RMS. The first part of the work was supposed to generate a list of candidate genes in PSA + neuronal precursors providing a basis for future functional studies.

The ability to identify and isolate NSC in vivo would contribute significantly to the understanding of the regulation of their self-renewal and proliferation, the mechanisms for neural differentiation and answer why neurogenesis has been limited to such small regions in the rodent adult brain and might be even dormant in human adults. Their regenerative potential could be exploited to replace lost cells by mobilization of endogenous NSC or by culturing and transplanting them to alleviate or even cure neurodegenerative disease. The lack of a specific marker represents a tremendous obstacle in NSC biology.

The second part of this thesis aimed at identifying potential NSC markers using a strategy

based on the SAGE data generated for the homogeneous population of neuronal precursors in

the first part. In a hierarchy of developmental potential, NSC are positioned above committed

(22)

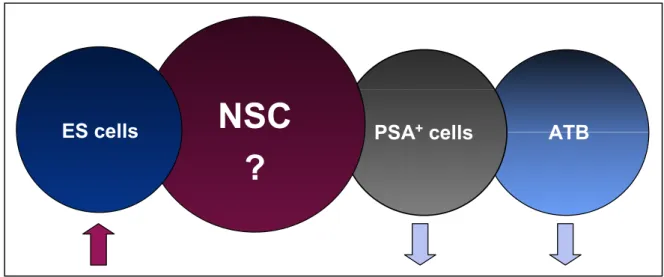
neuronal precursors, which in turn are above differentiated neurons and glia (Gage, 2000), the ATB SAGE library (Fig. 4).

As NSC are not accessible due to the lack of markers, neurospheres were considered as a substitute. The possibility was discarded because neurospheres do not fulfill the requirement of homogeneity and are prone to modifications in culture. By contrast, cultured ES cells represent a homogeneous population, are above NSC in the hierarchy of developmental potential, and their high similarity to NSC in terms of self-renewal and differentiation potential suggests comparable underlying gene expression programs (Clarke et al., 2000). A global overlap between genes expressed in ES cells and NSC has been demonstrated (Ivanova et al., 2002; Ramalho-Santos et al., 2002).

Fig. 4 Selection strategy for potential NSC markers. ES cells, NSC, PSA + cells and ATB are shown in a hierarchical order in terms of developmental potential starting with the greatest one on the left. All cell types are accessible and can be isolated homogeneously, except for the NSC because of a lack of marker genes. Given that there is an overlap in the genetic programs of ES cells and NSC, genes that are highly expressed in ES cells and downregulated or absent in PSA + cells and ATB should contain a subset of genes which are also expressed by the vanishingly small number of stem cells in the brain.

Provided that this overlap exists and that the number of NSC in ATB is negligibly small, the selection of genes from SAGE data that are highly expressed in ES cells and downregulated or absent in PSA + neuronal precursors and ATB should lead to the identification of genes that are potentially expressed by NSC (Fig. 4). The candidate genes were to be further analyzed to determine if their cellular localization is compatible with the localization of neurogenic areas, i.e. the SVZ.

PSA + cells

NSC

?

ES cells ATB

(23)

2 Materials and methods 2.1 Gene expression analyses

2.1.1 SVZ dissection and dissociation

4-6 weeks old male C57BL/6J mice were killed by rapid decapitation. Brains were removed, 400 µm sections were cut in cold 1 x PBS using a vibratome (Leica) and placed in cold HBSS (Hank’s Balanced Salt Solution, Invitrogen, Karlsruhe). The SVZ from the lateral wall of the anterior horn of the LV was dissected from the appropriate slices with tweezers (Biologie tip, 0.05 mm x 0.02 mm, Dumostar, Fine Science Tools, Foster City, USA). The small tissue pieces were collected in cold HBSS, pelleted by centrifugation for 3 min at 700 x g, incubated in 1 ml trypsin (5 mg/ml in HBSS, Sigma-Aldrich, Taufkirchen) for 12 min at 37°C with gentle agitation every 3 min, followed by inactivation of trypsin with 5 ml DMEM (Dulbecco’s Modified Eagle Medium, Invitrogen), 10% FCS. After centrifugation for 3 min at 700 x g, the explants were washed with 5 ml 37°C HBSS and centrifuged for 3 min at 500 x g. After resuspension in 2 ml 37°C PBS cells were dissociated mechanically with a 1000 µl Eppendorf pipette.

2.1.2 Purification of PSA + cells by FACS

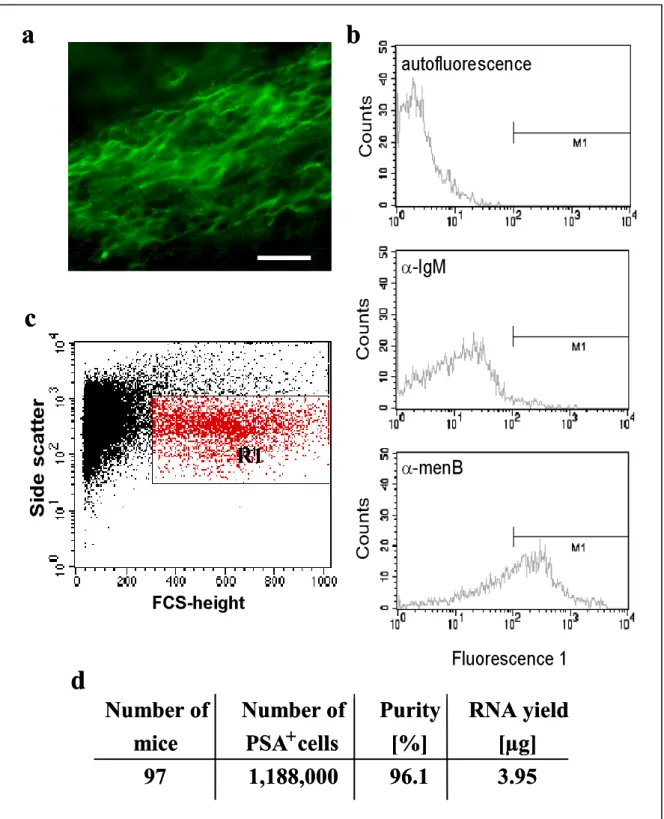
Individualized PSA + cells were split up in 3 samples: the first one (100 µl) without antibodies, the second one (100 µl) served as a control with secondary antibody only, the third one (1.8 ml) was incubated with α-PSA mAb menB (1:100) (Rougon et al., 1986) for 30 min at 37°C, followed by washing once before incubation with anti-mouse IgM-FITC (1:100, Immunotech, Marseille, France) for 15 min at 37°C. Cell sorting was performed using the high-speed cell sorter FACS Vantage SE (Becton Dickinson, San Jose, USA). PSA + cells, located in regions R1 and M1, were sorted at 3 x 10 3 cells/sec. In the R1 population, PSA + cells were selected by green fluorescence (530 nm ± 30). The marker M1 was set to obtain a high percentage of PSA + cells.

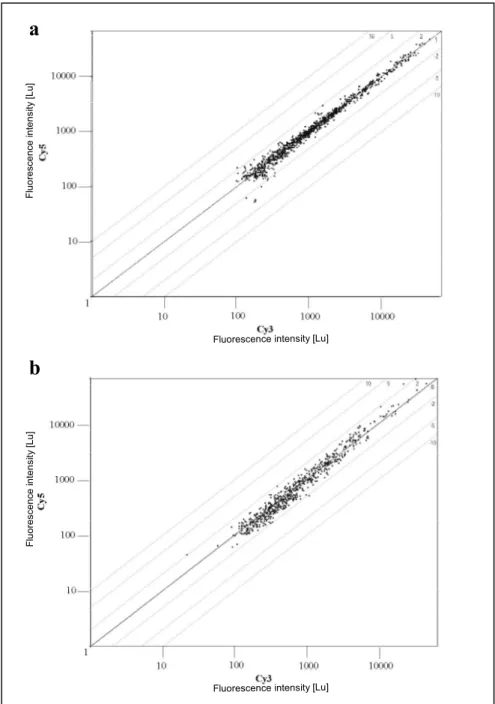
PSA-expressing TE 671 cells were used to survey if antibody binding or the FACS procedure

affect gene expression. TE 671 were incubated with and without the antibody at 37° C for

30 min and the RNA isolated from both samples. Following incubation with α-PSA mAb for

30 min and anti-mouse IgM-FITC (1:100) for 15 min at 37°C, 400,000 cells were sorted by

(24)

FACS and RNA isolated. Gene expression profiles were generated using PIQOR TM cDNA microarrays (Memorec Biotec, Cologne).

2.1.3 RNA isolation

Isolation of total RNA from PSA + cells, Bruce-4 ES cells and adult total brain (ATB) was performed using the RNeasy Mini Kit (Qiagen, Hilden) according to the manufacturer’s instructions. The RNA was quantified by photometrical measurement or NanoDrop® ND- 1000 UV-Vis Spectrophotometer (NanoDrop Technologies, Inc., Rockland, USA) and the integrity checked by the 2100 Bioanalyzer (Agilent Technologies, Palo Alto, USA) or agarose gels. Amplification of RNA samples for microarray and quantitative real-time PCR (qPCR) experiments was performed with T7 polymerase using a modified protocol according to Eberwine (Van Gelder et al., 1990).

2.1.4 Serial analysis of gene expression (SAGE)

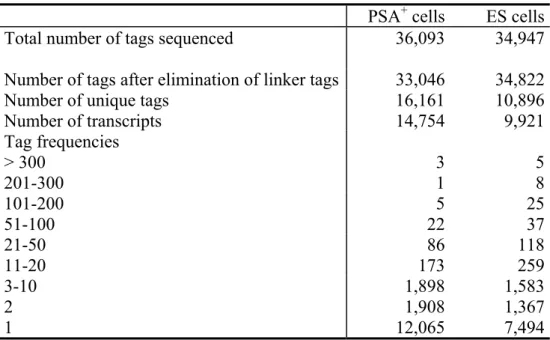
SAGE is based on the concept that short DNA fragments generated at defined positions can specifically identify the transcript of origin. A given RNA is reverse-transcribed into cDNA and 11 bp DNA fragments, called SAGE tags, are generated at the NlaIII restriction site closest to the 3’ end (Velculescu et al., 1995). The SAGE tags are ligated to form concatemers, which are sequenced to count, identify and annotate the tags. The number of tags correlates directly with the number of transcripts in the sample.The “MicroSAGE Detailed Protocol” is based on the original version developed by Velculescu (St Croix et al., 2000; Velculescu et al., 1995). The SAGE libraries were generated with total RNA using the

“MicroSAGE Detailed Protocol” (available at www.sagenet.org) with minor modifications as follows. Elongase (Invitrogen) in combination with Platinium Taq Antibody (Invitrogen) was used for the PCR instead of Platinium Taq polymerase. Phenol/chloroform extraction was performed using PLG Light tubes (Eppendorf). Precipitations were done with 10M ammonium acetate. Concatemers were excised from an agarose instead of polyacrylamide gel to obtain higher yields.

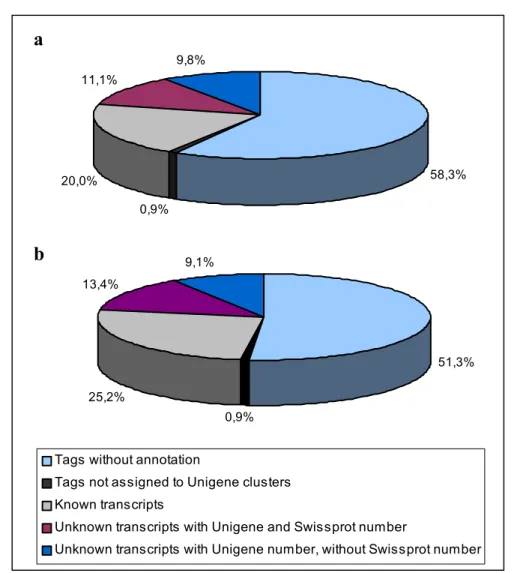
SAGE data analysis was carried out using the Memorec SAGE Analysis Package (Memorec

Biotec GmbH). Here, an extensive proprietary tag database works with automatic annotations

derived from EST/genomic data and, in addition, contains several hundred manually

annotated tags elusive to the automatic mapping. The program extracts 11 base pair (bp)

SAGE tags and guarantees a more reliable assignment to UniGene clusters than programs

working with 10 bp tags. Proprietary filtering algorithms eliminate SAGE artifacts resulting

(25)

from polymorphic tags, ribosomal RNA, mitochondrial RNA, linker tags and LINE/SINE tags. The calculation of statistical significance levels for differential gene expression is based on a formula by Audic and Claverie (Audic and Claverie, 1997). For the purpose of comparison, all SAGE libraries have been normalized to 100,000 tags.

2.1.5 Microarrays

PIQOR TM (Parallel Identification and quantification of RNAs) cDNA microarrays (Memorec Biotec GmbH, Cologne) were used to generate expression profiles of the controls with TE 671 cells and for the validation of SAGE results. cDNA microarray production, hybridization and evaluation were carried out as previously described (Bosio et al., 2002). Briefly, cDNA microarray probes were generated by RT-PCR with specific primers for selected gene regions (Tomiuk and Hofmann, 2001). The 200-400 bp cDNA fragments were cloned into the pGEM- T Vector (Promega, Mannheim) and sequence-verified. Amplification (Taq PCR Master Mix, Qiagen) of the vector inserts was performed with vector sequence-derived primers with a 5’- amino-modification on one primer. After purification (QIAquick 96 PCR BioRobot Kit, Qiagen) PCR products were quality-controlled on an agarose gel. Probes were spotted in two or four replicates depending on the total number of probes.

100 µg total RNA per sample for control experiments with TE 671 cells or 1 µg of amplified

RNA for validation experiments were labeled and hybridized. Because of limited material, the

described hybridizations for PSA + cells, ES cells and ATB were performed once. Total RNA

was combined with a control RNA consisting of an in-vitro transcribed Escherichia coli

genomic DNA fragment with a 30 nucleotides (nt) poly (A) + tail (CR1) before mRNA

isolation (Oligotex mRNA Mini Kit, Qiagen). The mRNA was diluted to 17 µl and 2 µl of

control RNA 2 (CR2) were added, a mixture of three different transcripts to control the

efficiency of the labeling step. Reverse-transcription was achieved by adding the mRNA to a

mix of 8 µl 5x first-strand buffer (Invitrogen), 2 µl Primer-Mix (oligo(dT) and randomeres,

Memorec Biotec), 2 µl low C dNTPs (dATP, dGTP, dTTP 10mM each; dCTP 4 mM), 2 µl

FluoroLink TM Cy3/Cy5-dCTP (Amersham Pharmacia Biotech, Freiburg) 4 µl 0.1 M DDT and

1µl RNasin (20-40 U) (Promega). 1 µl (200 U) of SSII enzyme was added, incubated at 42°C

for 30 min. This step was repeated once. 0.5 µL of RNase H was added and incubated at 37°C

for 20 min to hydrolyze RNA. Cy3- and Cy5-labeled samples were combined and cleaned up

using QIAquick TM (Qiagen). 50 µl of 2x hybridization solution (Memorec Biotec) at 42°C

were added to 50 µl eluent. The cDNA array was incubated in distilled water at 95°C for

2 min to denature the double-stranded cDNA molecules leaving only the strand that is

(26)

covalently bound to the slide surface. The array was transferred into 96% ethanol for 30 sec and dried with pressured air. Hybridization was performed according to the manufacturer's instructions (Memorec Biotec) using a GeneTAC TM hybridization station (Perkin Elmer, Langen). Quality controls, external controls and hybridization procedures and parameters comply with the MIAME standards (Brazma et al., 2001).

The hybridized microarrays were scanned with the ScanArray Lite (Packard Bioscience, Dreieich ) and analyzed using the Imagene software version 4.1 (Bio-Discovery, Los Angeles, USA). The signal of each spot was measured in a fixed circle of 350 µm diameters and the background outside the circle within rings 40 µm distant to the signal and 40 µm wide. Local background was subtracted from the signal to obtain the net signal intensity and the ratio if Cy5/Cy3. The ratios were normalized to the median of all ratios using only those spots for which the fluorescent intensity in one of the two channels was 2-fold higher than the negative control (salt and herring sperm). The mean was determined of 4 spots representing the same cDNA.

2.1.6 Quantitative real-time PCR (qPCR)

0.96 µg amplified RNA from ATB and 0.2 µg amplified RNA from PSA + cells, were reverse transcribed and 7.5 ng of the RT-reaction product were used as template for each qPCR sample. Transcript levels were measured by qPCR using Perkin Elmer Applied Biosystems prism model 7000 sequence detection system (PE ABI 7000 SDS; Perkin Elmer, Langen).

Quantification primers were designed using Primer Express (PE ABI).

Specific primers for the following mouse genes were used in these experiments:

TubulinßIII forward 5’-GATGATGACGAGGAATCGGAA-3’

TubulinßIII reverse 5’-CAGATGCTGCTTGTCTTGGC-3’

Manic fringe forward 5’-TCAAGTTTGTCCCAGAGGATGA-3’

Manic fringe reverse 5’-TTGACTGCGATGAAGATGTCG-3’

Dvl2 forward 5’-CTCCTCCTAATCTCCGAGCTCTT-3’

Dvl2 reverse 5’-TGGAGGCATCATAACTACCATCAT-3’

Sox4 forward 5’-ACAAGAAAGTGAAGCACGTCTACCT-3’

Sox4 reverse 5’-TCCATCTTCGTACAACCCCAGT-3’

SAGE data and triplicate qPCR assays indicated insignificant variation of the transcript levels

of TubulinßIII. Therefore, TubulinßIII was used for the normalization of the qPCR data. For

all qPCR experiments, triplicate assays were performed.

(27)

Threshold cycle, Ct, which correlates inversely with the target mRNA levels, was measured as the cycle number at which the SYBRgreen emission increases above a threshold level.

Specific mRNA transcript levels were expressed as fold difference between PSA + precursors and ATB. For the determination of specific expression of Dishevelled2 (Dvl2), Manic fringe and Sox4 by qPCR in mouse, specific primer pairs for TubulinßIII, and the respective genes were used with aRNA from FACS-purified PSA + cells and from ATB. RNA integrity was controlled on a gel. Linear amplification was performed according to the modified Eberwine protocol (Van Gelder et al., 1990). To remove genomic DNA, each RNA was treated with RNase free DNase1 (Ambion Inc., Austin, Texas) prior to the reverse transcription reaction.

The following cycle conditions were used: 95°C 10 min followed by 50 cycles of 95°C 15 sec, 60°C 1 min. Melting curves were determined for each amplified product according to the suppliers guidelines (Applied Biosystems prism model 7000 SDS software). For each run, negative controls were performed by omitting the template. Standard curves of each gene were used to calculate the expression of Dvl2, Manic fringe and Sox4, which is shown as “x- fold differential expression as compared to TubulinßIII”.

2.2 Cell culture

2.2.1 General cell culture conditions

All cell types were cultured in a humidified incubator with a 5% CO 2 atmosphere at 37°C.

Frozen cells were quickly transferred from liquid nitrogen into a 37°C water bath, thawed, washed with prewarmed growth medium and seeded on tissue culture dishes. For the purpose of freezing, cells were trypsinized, resuspended in growth medium supplemented with 20%

fetal calf serum (Invitrogen) and 10% DMSO (Sigma-Aldrich) and slowly cooled to -80°C.

After overnight incubation at -80°C, cells were kept in liquid nitrogen for long-term storage.

2.2.2 TE 671 cell line

TE 671 cells were grown in DMEM (61965-026, Invitrogen) containing 10% FCS, 1 mM sodium pyruvate, 100 U/ml penicillin, and 100 µg/ml streptomycin.

2.2.3 ES cell line Bruce-4

C57BL/6J derived ES cells (Bruce-4) (Kontgen et al., 1993) were grown on a layer of

embryonic fibroblasts in DMEM containing 10% FCS, 1 mM sodium pyruvate, 1% L-

glutamine, 100 U/ml penicillin, 100 µg/ml streptomycin, 1% nonessential amino acids, LIF

(28)

(Leukemia Inhibitory Factor) and 0.01 mM β-mercaptoethanol. To reduce the contamination of embryonic fibroblasts prior to RNA preparation, ES cells were grown on gelatine-coated plates for 24 h, and then passaged to a new plate for 20 min to allow feeder cells to adhere.

The ratio of ES cells to fibroblasts was approximately 60:1 after initial plating. After reduction of contaminating fibroblasts by transient plating the ratio was approximately 80:1 (1.25%).

2.2.4 Preparation of embryoid bodies

SV129 embryonic stem cells were grown on gelatine-coated dishes in DMEM (21969, Invitrogen) containing 0.8 mM sodium pyruvate, 15% FCS, 2 mM L-glutamine, 100 U/ml penicillin, 100 µg/ml streptomycin, 25 mM HEPES, 300 µM monothioglycerol, 1000 U/ml LIF (ESGRO, Chemicon, Hofheim) and essential amino acids (Biochrom, Berlin). Embryoid bodies (EBs) were grown either in suspension or using the hanging drop-method (Hogan, 1994) with 3.3x10 4 cells/ml and 15 µl per drop. After 24 h EBs were harvested to prepare cryosections.

2.2.5 Preparation of neurospheres

Neurosphere production was based on established protocols (Groszer et al., 2001; Imura et al.,

2003; Knoepfler et al., 2002). P2-P4 CD1 mice were killed by cervical dislocation and their

brains removed. 400 µm sections were cut in cold PBS using a vibratome (Leica) and placed

in cold DMEM (61965-026, Invitrogen), 10% FCS, 100 U/ml penicillin, 100 µg/ml

streptomycin. The SVZ from the lateral wall of the anterior horn of the LV was dissected

from the appropriate slices and collected in cold HBSS. The pieces of tissue were incubated in

1 ml trypsin (5 mg/ml in HBSS, Sigma-Aldrich), 15% glucose, 0.25 mg/ml DNase type I

(Roche, Mannheim) for 12 min at 37°C with gentle agitation every 3 min. 9 ml of HBSS were

added to dilute the trypsin. The pieces were pelleted by centrifugation at 800 x g for 9 min,

resuspended in Neurobasal TM Medium (21103, Invitrogen), 100 U/ml penicillin, 100 µg/ml

streptomycin, supplemented with B-27 (Invitrogen), 20ng/ml basic fibroblast growth factor

(bFGF, R&D) and 20ng/ml epidermal growth factor (EGF, R&D) and dissociated by

triturating with a fire-polished glass pipette. The cells were passed through a 50 µm filcon

(Dako, Hamburg), counted and plated in uncoated 35 mm dishes (50,000 cells per ml, 3.5 ml

per dish) in the same medium. Medium was changed every 3-4 days by centrifuging the

neurospheres at 150 x g for 6 min and carefully resuspending them in fresh medium.

(29)

To ensure that the primary neurospheres had the capability of self-renewal, they were dissociated to produce secondary neurospheres. After 5-7 days, primary neurospheres were pelleted by centrifugation at 800 x g for 8 min and dissociated by triturating with a fire- polished glass pipette and passed through a 50 µm filcon. After 4-6 days secondary neurospheres were harvested for cryosections.

2.3 Histological analyses

2.3.1 Preparation of cryosections

Neurospheres or EBs were centrifuged at 300 x g for 6 min, washed in 1x PBS, pH 7.4, fixed in 4 % paraformaldehyde at RT for 15 min (for immunochemistry) or 30 min (for in situ hybridizations), centrifuged at 400 x g for 8 min, washed in 1x PBS and incubated agitating in 5% sucrose at 4°C overnight. After centrifugation at 600 x g for 10 min they were incubated in 15% sucrose at 37°C for 2 h. They were centrifuged at 700 x g for 10 min. Sucrose solution was removed except for 400-500 µl, which were transferred into 1-2 wells of a 96-well plate.

The plate was centrifuged at 1000 x g for 2 min and an equal volume of 37°C warm Tissue Tek OCT compound (Sakura Finetek, Zoeterwoude, The Netherlands) was added and mixed with the sucrose solution by stirring gently with a yellow tip avoiding bubbles. The plate was centrifuged at 1000 x g for 3-4 min to concentrate the neurospheres at the bottom of the well.

Subsequently, the plate was immersed into -40 to -45°C cold isopentane for 2 min and stored at –80°C. 8 µm cryosections were cut with a LEICA CM3050 cryostat, collected on Superfrost Plus slides (Menzel, Braunschweig) and stored at -80°C.

3-week-old C57BL/6J mice or CD1 mice of postnatal day 6 (P6), P12, P14 were anaesthetized with 1.2 % Avertin (200 µl/10 g body weight; 2,2,2-Tribromethanol; Sigma- Aldrich) and CD1 mice P3–P5 in ice water. The mice were intracardially perfused with 4%

paraformaldehyde and their brains incubated in the same solution for 2-3 h. Mice on embryonic day 14 (E14) and E18 were removed from the mother and their heads incubated in 4% paraformaldehyde at 4°C for at least 24 h. Brains were incubated in 20% sucrose overnight and frozen in isopentane at -40 to -45°C. Coronal and sagittal 12 µm and 10 µm sections were cut with the cryostat and air-dried on Superfrost Plus slides.

All sucrose and paraformaldehyde solutions were prepared in 1x PBS, pH 7.4 and the former

supplemented with 0.02 % sodium azide for incubation times longer than 24 h.

(30)

2.3.2 In situ hybridizations

2.3.2.1 Generation of Digoxigenin-labeled RNA probes

Antisense and sense RNA probes for in situ hybridizations have been derived from a proprietary collection of cDNA clones (Memorec Biotec) consisting of 200-400 bp fragments (Tomiuk and Hofmann, 2001).

Glycerol stocks of bacteria transformed with pGem-T Vector (Promega, Mannheim) containing the different 200-400 bp inserts were inoculated in 5 ml LB medium with Ampicillin (1 mg/ml) and grown vigorously shaking at 37°C over night. The plasmid DNA was prepared using the NucleoSpin Plasmid Kit or the Nucleobond AX Kit (Macherey-Nagel, Düren) according to the manufacturer’s instructions. The DNA concentration was measured with the NanoDrop® ND-1000 UV-Vis Spectrophotometer (NanoDrop Technologies, Inc., Rockland, USA) and the length of each fragment checked on agarose gels. DNA gel electrophoresis with 1kb DNA ladder (Invitrogen) was performed in 1x TBE buffer as described (Sambrook, 1989).

Each vector DNA was digested over night with two different restriction enzymes so that, in consideration of the orientation of the insert, the RNA polymerase would transcribe the template starting from one of the two promoters framing the insert and would stop at the opposite end. In the one reaction a cut was produced at the end of the template opposite of the T7 promoter but excluding the SP6 promoter and in the other reaction the vector was cut at the end of the template opposite the SP6 promoter and before the T7 promoter. Restriction enzymes and buffers were obtained from Invitrogen, Boeringer, and New England Biolabs.

The digested DNA was cleaned up using phenol/chloroform extraction (Sambrook, 1989) or the QIAquick PCR Purification Kit (Qiagen).

For in vitro transcriptions (IVT), 1.5-2 µg of linearized vector were incubated with 2µl 10x

Buffer MAXIscript TM (Ambion, Huntingdon, UK), 2µl DIG RNA Labeling Mix 10x (Roche

Diagnostics, Mannheim), 0.5 µl RNasin (Promega) and 2µl SP6 / T7 polymerase

(MAXIscript TM ) in a total volume of 20 µl at 37°C for 2 h. 2 µl of RQ1 RNase-free DNase

(Promega) were added to the IVT reaction at 37°C for 25 min. Subsequently, the resulting

digoxigenin-labeled RNA was purified using the clean-up protocol of the RNeasy Mini Kit

(Qiagen), protected against degradation with 40 U/100 µl of Recombinant RNasin

Ribonuclease Inhibitor (Promega), quantified using the NanoDrop® ND-1000 UV-Vis

Spectrophotometer and the integrity checked by agarose gels. RNA probes were stored at

-80°C.

Abbildung

Fig. 1 Localization and cellular composition of the adult SVZ and RMS. (a ) Nissl staining of adult mouse brain  (sagittal section) clearly brings out the RMS that is created by migrating PSA +  neuronal precursor cells and  connects LV and OB
Tab. 1 Markers for different SVZ cell types.
Fig. 2 Organization of the olfactory system. The glomeruli of the olfactory bulb are convergence sites for input  from olfactory axons of receptor cells in the olfactory epithelium
Fig. 3 Cell types in the SGZ of the hippocampus. This schematic representation of a coronal brain section shows  the site of secondary neurogenesis in the hippocampus
+7

Referenzen

ÄHNLICHE DOKUMENTE

Representative RNAscope micrographs from a 3-month-old male C57BL/6 mouse probed for Gdf11 (white), probed for a cell specific marker (pink or green), and stained with DAPI

Because the Mecp2 -/y mice showed a significant increase in Trh compared to wt mice in almost all brain areas analyzed and the TRH function depends on the

By miRNA profiling of FACS-purified cells of the early V-SVZ lineage, the Doetsch group found the miR-17~92 cluster to be significantly upregulated in activated NSCs (aNSCs)

The current PhD thesis contributes to our understanding of the relation between ageing, the efficiency of attentional functions and their neural

For further analyses, it would be interesting to see whether the usage of a different inducible transgenic mouse lines in similar clonal lineage analysis, for example

Blocking OFF Pathway Tm Cells Reduces Responses of Lobula Plate Tangential Cells Specifically to OFF Edges The response properties of Drosophila lobula plate tangential cells have

By using MJD- patient-specific induced pluripotent stem cell-derived neural stem cells, our group found a possible mechanism for aggregate formation and why neurons

Five new microsatellite markers at candidate gene loci for litter size have been identified based on partial sequence analysis of porcine PAC and BAC clones containing the respective