PAIN 02308
Research Reports
Sex differences in responsiveness to painful and non-painful stimuli are dependent upon the stimulation method
Stefan Lautenbacher a,b and Gary B. Rollman a
0 Department of l'sychology, University of Western Ontario, London N6A 5C2 ( Canada) and b Department of Psychiatry, Clinical Institute, Max Planck Institute for Psychiatry, Munkh (Germany)
(Received 14 October 1992, revision received and accepted 25 January 1993)
Summary Sex differences in thermo- and electrocutaneous responsiveness to painful and non-painful stimuli were investigated in 20 women and 20 men. Heat pain, warmth, and cold thresholds were assessed on the band and foot with a Peltier thermode system. In addition, subjects used magnitude estimation to judge the sensation intensity evoked by temperatures ranging from 38°C to 48°C applied to the forearm. To measure detection, pain, and tolerance thresbolds of electrocutaneous sensitivity, electrical pulses were administered to the band. Magnitude estimates of sensation intensity were assessed for stimuli ranging from 0.5 mA to 4.0 mA. There were no sex differences in heat pain, warmth and cold thresholds. There were significant sex differences in electrical detection, pain and tolerance thresholds, with lower thresholds in women. Correspondingly, magnitude estimates were similar in women and men when using thermal stimuli while women judged stimuli from 2.5 mA on as more intense than men when using electrical stimuli. Despite these discrepancies, the measures for pain responsiveness from the two stimulation methods correlated significantly. In contrast, no significant correlations between the methods were found when considering the responsiveness to non-painful stimuli. The findings help to clarify controversies in the pain literature about sex differences. Results affinning and denying such differences could be obtained within a single sample, with stimulation method as the critical variable.
Key words: Sex difference; Pain threshold; Sensory threshold; Magnitude estimation
lntroduction
Tbere is a long history of interest regarding sex differences in responsiveness to experimental pain. De- spite many advances in stimulation techniques and psychophysical assessment methods, the issue of whether such diff erences exist has still not been re- solved. The view that women are more likely to differ from men with respect to pain tolerance than with other measures of pain responsiveness appears to be the only one that receives widespread agreement (e.g„
Goolkasian 1985).
One assumption inherent in many experimental studies of sex differences is that the metbod of pain induction (e.g„ thermal, mechanical, electrical) is not
Correspondence to: Dr. Gaxy B. Rollman, Department of Psychol- ogy, University of Western Ontario, London N6A SC2, Canada.
particularly relevant. Based upon this assumption, pre- vious results have been interpreted as being dependent on the pain dimension assessed (e.g., threshold or tolerance, sensory or affective component) and on higher-order variables such as anxiety, sex role, hor- monal influences, and the like. This assumption needs to be examined.
There would be little debate about the existence of sex diff erences if only pressure pain were considered.
Studies using constant pressure methods (Otto and Dougher 1985; Dubreuil and Kohn 1986) as well as ones using variable pressure techniques (Woodrow et al. 1972; Fischer 1987; Brennum et al. 1989; Jensen et al. 1992) have consistently found that women are more pain sensitive than men.
Most of the studies that have produced conflicting results have used either thermal or electrical stimula- tion. For example, Oark and Mehl (1971), applying radiation heat, found no differences in pain threshold
between men and women, whereas Procacci et al.
(1970) reported lower radiation heat pain thresholds in women than in men. Goolkasian (1980}, also using radiation heat, observed a better discrimination ability in women than in men, but only if the women were in the ovulatory phase of their menstrual cycles. Testing pain tolerance at four body sites with a heat beam dolorimeter, Lipman et al. (1990) obtained lower toler- ance values in women only for the breast, which was the sole site examined with a clear anatomical sex difference.
Using contact heat, two studies showed that detec- tion as weil as pain thresholds were similar in women and men (Kenshalo 1986; Lautenbacher and Strian 1990. In contrast, Feine et al. (1991) found that women rated temperature stimuli - delivered by a contact thermode and probably mostly above pain threshold - more strongly than did men.
Rollman and colleagues (Rollman and Harris 1984, 1987; Rollman et al. 1990} observed, in a series of studies with electrocutaneous stimulation, that women bad lower detection, pain and tolerance thresholds. In contrast, Neri and Aggazani (1984) found no sex differ- ences at all, while Robin et al. (1987) and Notermans (1966; Notermans and Tophoff 1967) found them only for tolerance but not for detection and pain thresholds.
Harkins and Chapman (1977), using electrodental stim- ulation, obtained similar values for pain threshold, discrimination ability, and response bias in the two genders.
One possibility may be that sex differences in pain responsiveness are sirnply smaller for thermal and elec- trical stimulation than for mechanical pressure. Conse- quently, the influence of sample characteristics would be greater for the first two methods. To address the question of sample dependency, we planned a compari- son of two stimulation methods which either bad previ- ously produced sex differences (Rollman and Harris 1984, 1987; Rollman et al. 1990) or had not (Lauten- bacher and Strian 1991) in a single sample.
There have been some attempts (e.g., Larkin et al.
1986) to explain sex differences in somatosensation and pain sensitivity by body measure differences. These have only been partially successful (Rollrnan et al.
1990; Lautenbacher and Strian 1991, 1993). The idea underlying this concept is that the notion that women are more responsive than men can be replaced by the notion that small people are more responsive than large individuals. Intervening factors may be such things as skin thickness, receptor density, or length of the afferent pathways. Some of these may affect the tem- poral and spatial summation properties in second-0rder neurons by influencing the degree of simultaneous arrival of afferent impulses, a matter of particular importance when slowly conducting primary afferents, responding to noxious inputs, are involved.
TABLE J
SAMPLE DESCRIPTION FOR AGE, BODY MEASURES, ANX- IETY (STAl-Xl) AND REACTIVITY (RS) (mean ± S.D.) P values of t tests on sex differences are given.
Women Men P value
n-20 n=20
Age (years) Height (cm) Weight (kg) • Body Mass Index b
Body Surface (cm2)
STAI
RS
21.0± 4.8 165.0± 7.5 61.3± 7.0 22.6± 2.9 16 627.3 ± 1066. 7 36.4± 6.2 78.6± 10.2
• Weight with clothes.
b Weight {cm)/height (m)2.
20.6 ± 2.5 0.388 180.6 ± 6.0 < 0.001 73.6 ± 6.5 < 0.001 22.6 ± 2.4 0.499 19191.2±919.9 <0.001 33.2± 10.2 0.123 67.9± 12.6 0.003
Such an explanation, however, can be valid only if the influence of body measures on responsiveness holds within as well as across genders. We wished to investi- gate this issue further. The criteria for a valid explana- tion we set were the finding of a substantial body measure-responsiveness measure relation in both sexes examined separately and in the groups combined, as weil as the finding of a significant difference between the sexes in this body measure. In a similar manner, we tested two psychological variables that have previously been shown to provide a possible basis for sex differ- ences in pain perception: anxiety (Robin et al. 1987) and psychological reactivity (Dubreuil and Kohn 1986).
Methods
Subjects
Twenty women and 20 men took part in the study; all participants were undergraduate students. The description of both samples is given in Table 1. The two groups were very similar in age. The body measure differences between genders were typical in that men were both taller and heavier; the equivalent body mass indices for the two groups indicates that each consisted of nonnal weight subjects.
Women bad only slightly higher scores on the state anxiety scale but significantly higher scores on the psychological reactiviry scale.
Teri women served as subjects while they were in the menstrual and postmenstrual phases (days 1-12), 5 in the intermenstrual phase (days 13-17), and 5 in the premenstrual phase (days 17-28). Fifteen bad natural periods and 5 were taking oral contraceptives. There is some evidence (Goolkasian 1980; Hapidou and de Catanzaro 1988) that pain responsiveness is greater during the inter- and premen- strual phases than during other times. lf so, we bad equal numbers of more and less pain responsive women in our sample.
The protocol was approved by an ethics committee; all subjects gave written informed consent. A single male experimenter con- ducted all testing sessions.
Apparatus and procedure
At the beginning of each session, subjects filled out tbe question·
naires measuring anxiety (STAl·Xl. Spielberger et al. 1970) and psychological reactivity (RS, Kohn 1985).
Following this, psychophysical tests using thermal stimuli were administered. The stimulator was a temperature-controlled contact thennode with a stimulation surface of 1.6X3.6 cm2, mounted on an articulated arm. Contact pressure could be adjusted and was held at 0.4 N/cm2• The apparatus (PATH Tester MPI 100; for details sec Galfe et al. 1990) also included a thermode controller with a micro- computer for managing thermal stimulation and a personal computer for controlling the procedures.
The protocols used by. Lautenbacher and Strian (1991) were chosen for the assessment of thermal thresholds (warmth, cold) and heat pain thresholds in order to conduct a replication of their study.
Sites of stimulation were the lateral dorsum pedis (right foot) and the thenar of the right hand, in that order. At each site, the detection thresholds for warmth and cold were first assessed. Start- ing at a temperature of 32°C, 7 warm and then 7 cold stimuli were administered. The rate of the temperature change was 0.7°C/sec.
The subjects had to press a button as soon as they noticed a change in temperature. Following this, the temperature retumed to the base value (1.5°C/sec). The mean differences between the base tempera- ture and the peak temperature in the 2 sets of 7 trials were taken as the measures of the wannth and cold tbresholds. The intertrial interval lasted 10 sec. The sti1J1uli were delayed between 1 and 3 sec (pseudo-randomized intervals) after visual and acoustic waming sig- nals for the start of a trial.
The beat pain tbreshold was then measured. Eight trials were run, each beginning at a temperature of 40-C, with a rate of temper- ature change of 0.7°C/sec. The subjects were instructed to press a button as soon as they feit pain. Each time they pressed tbe button, the temperature returned to the base value at a cooling rate of l.5°C/sec. An upper limit was set at 52°C for safety reasons. The start of each trial was announced visually and acoustically, but the stimulus was presented with a pseudo-randomized delay of between 1 sec and 3 sec. The intertrial interval lasted 10 sec. The pain threshold was calculated as the mean of the peak temperatures of the last five trials.
Subjects then made magnitude estimates of non-painful and painful thermal stimuli applied to four sites at the rigbt volar forearm. The forearm was chosen because it allowed site variations without sensitivity variations and guaranteed a plane contact surface at all sites. Forty-four stimuli (base temperature: 36°C; rate of temperature change: l.5°C/sec; saw tooth shape) were given in four blocks of 11 eacb. In each block, all intensities ranging from 38°C to 48°C in steps of 1 •c were used. Tbc order of the stimuli was pseudo-randomized so that strong intensity differences between con- secutive trials were avoided, by limiting the differences between them to 5°C or less. Such differences were balanced across intensity levels. This was thought to be necessary to control for adaptation Jevel effects.
The subjects could stop the temperature increase at any time, if they feit that the stimulation produced undue discomfort, by pressing the response button. At the end of eacb block, the site of stimulation was changed. Each trial consisted of the stimulation interval lasting at least 10 sec and until the base temperature was reestablished, and the response interval of 10 sec, which also constituted the interstimu- lus interval. Both intervals were signalled with acoustic and visual cues.
Subjects estimated the perceived intensity of each stimulus by assigning a number to the sensation. To obtain interindividually comparable sensation estimates, a form of modulus was introduced by telling the subjects tbat they should use the number 50 for a 'barely painful sensation.' This variant of magnitude estimation has been successfully applied in experimental pain studies (Willer et al.
1984; Marchand et al. 1991). The first block was a practice one and was not considered in tbe evaluation. The average of the three magnitude estimates for each stimulus intensity was used as the corresponding sensation intensity.
In the next part of the study, psychophysical tests using electrocu-
taneous stimuli were conducted. After skin preparation (cleaning and abrading), two Grass silver electrodes were attached slightly proximal to the base joints of the thumb and index finger (cathode at thumb, anode at index finger). The stimuli were delivered by a constant-current stimulator (CCS-1, Frederic Haer and Company) and consisted of ten 1-msec monophasic square-wave pulses with an interval between pulse onsets of 20 msec (frequency: 50 Hz; total duration: 181 msec). The start of each stimulus was signalled by a light. First, detection, pain, and tolerance thresholds were measured in three ascending series with discrete steps of 0.15 mA. An upper limit was set at 7.5 mA for safety reasons. The average in the three series was taken as the corresponding threshold value.
For magnitude estimation, 44 stimuli with 11 intensities (0.5, 1.0, 1.5, 2.0, 2.5, 2.75, 3.0, 3.25, 3.5, 3.75, 4.0 mA) were applied using the same procedures for stimulation and magnitude estimation as those with the temperature stimuli. Subjects with a tolerance threshold below 4.0 mA were not run in the magnitude estirnation experiment.
The intensity range was based upon earlier studies (Rollman and Harris 1984, 1987) which indicated that a considerable portion of the subjects could be studied within these limits. The spacing of the intensities was chosen to provide 0.5-mA steps up to 2.5-mA and 0.25-mA steps from 2.5 mA to 4.0 mA in order to counterbalance the frequently observed increase of response variability at higher intensi- ties with an increased density of data points.
At the end of each session, the body measures (height, weight) were taken and the subjects were briefly interviewed about possible medications.
Evaluation
In some subjects, a threshold - especially the tolerance threshold for electrocutaneous stimulation - could not be obtained within the pre-set safety limits. In these cases, the threshold was assumed to be bigher than the safety lirnit and ranked correspondingly. Therefore, non-parametric statistics (Mann-Whitney U test, Spearman rank correlation) were used in the part of the analysis dealing with thresholds. Otherwise, for simple group comparisons t tests were computed. A MANOV A with the group factor 'sex' and the re- peated-measures factor 'stimulus intensity' was used to evaluate the magnitude estimation of scnsation intensity. Only subjects with esti- mates at all stimulus intensity levels were included to avoid varying sample sizes over the intensity dimension. To obtain an over-all rneasure of perceived rnagnitude, the data of the different intensity levels were collapscd by summing all ratings of an individual across all stimulus intensities. As directed hypotheses were available, 1- tailed significance testing was chosen. Alpha was sct to 0.05 witb the exception of the correlation analyses where it was set to 0.01 to take into account the greater number of tests.
Results
Sex differences in thermo- and electrocutaneous thresh- olds
Fig. 1 shows the thermal detection thresholds for non-painful stimuli (warmth, cold) measured at the hand and foot for women and men. None of the sex comparisons reached significance (warmth at the band:
U = 191.5, P = 0.409; warmth at the foot: U = 160.5, P = 0.143; cold at the hand: U = 167.0, P = 0.183; cold at the foot: U = 192.0, P = 0.414). The same was true for the heat pain thresholds measured at the same two sites, as shown in Fig. 2 (hand: U = 183.5, P = 0.328;
foot: U = 189.5, P = 0.388). In contrast, all three
5.5 5.0
ö 4.5
:,_ 4.0 w 3.5 a: :::> 3.0 1-
c( 2.5 a: w
Q. 2.0 ::E 1.5 w 1-
1.0 0.5 0
W ARMTH WARM TH HAND FOOT
Owomen
~Men
COLD HAND
COLD FOOT Fig. 1. Thermal detection thresholds for warmth and cold in women and men measured at the band and foot (temperatures in °C relative to the base temperature of 32°C); median, quartile 1 and 3 are given
for each measure; n = 20 in each group.
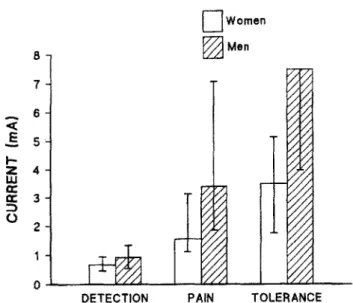
thresholds with electrocutaneous stimulation at the band were significantly lower in women than in men (detection: U = 122.0, P = 0.017; pain: U = 107.5, P = 0.006; tolerance: U = 88.0, P = 0.001) (Fig. 3). These findings point to a clear diff erence between thermo- and electrocutaneous stimulation in respect to sex dif- ferences.
Sex differences in magnitude estimation of thermo- and electrocutaneous stimuli
In the magnitude estimation experiment with ther- mal Stimuli, 6 of the 20 women switched off the tem- perature increase before the pre-set maximum on one
0 Women
48 ~Men
-0 47 46
. -w 45 a: :::>
1-c( 44
a: w 43
Cl..
::E w 42
....
41 40
PAIN PAIN
HAND FOOT
Fig. 2. Heat pain thresholds in women and men measured at the hand and foot {absolute temperatures in °C); median, quartile 1 and
3 are given for each measure; n = 20 in each group.
Owomen
8 ~Men
7
< 6
.§ 5
...
z 4 w a:
a: 3 :::>
0 2
DETECTION PAIN TOLERANCE Fig. 3. Detection, pain and tolerance thresholds with electrical stimulation in women and men measured at the band (current in mA); median, quartile 1 and 3 are given for each measure. Note that median and quartile 3 for the tolerance threshold of the men has the
same value; n = 20 in each group.
or more trials. All 6 women did so with 48°C stimuli, 5 with 47°C stimuli, 2 with 46°C stimuli and 2 with 44°C stimuli. None of the men stopped a trial. This alone suggests less willingness to tolerate painful heat stimuli in women than in men. These 6 observers were ex- cluded from furtber evaluation to avoid missing data and to get equivalent data samples for each intensity level. (The problem of using selected samples is ad- dressed in the Discussion). Fig. 4 shows the results.
The effect of stimulus intensity was highly significant (F = 133.2, df = 10, 320, P < 0.001). There was no sig- nificant effect for the group factor 'sex' (F = 0.1, df = 1, 32, P = 0.392) or for the interaction 'sex by stimulus
110 100
.., 90
G> 80
-IV E 70
·;:;
.., 60 w
Q) 50
„ 40
:::i
-
·c: 30
Cl
"' 20
~ 10
0 -10
1
37 39 41
• Women
"'Men
43 45
Temperature ("Cl
47 49
Fig. 4. Magnitude estimates of temperature stimuli applied to the forearm ranging from 38°C to 48°C in women and men; mean and 1
S.O. are given; n = 14 for women and n = 20 formen.
intensity' (F = 0.5, df = 10, 320, P = 0.449). Hence, no sex-related differences could be demonstrated by mag- nitude estimation of thermal stimuli at non-painful and painful intensity levels.
Because of the drop-out of the 6 fernale subjects, wbo may have been especiaUy pain responsive, examin- ing the magnitude judgments of the remaining women might possibly have led us to underestimate potential sex differences. In order to decrease the likelihood of such an error, a second analysis was conducted which included all obsetvers. Since quadratic polynomial re- gressions on individual data resulted in an excellent goodness of fit for the 34 subjects who had no missing data (median of r2 = 0.977), missing values for the remaining 6 subjects were replaced by estimates based upon quadratic polynomial regressions of their avail- able data. Again, an excellent goodness-of-fit was achieved (median of r 2 = 0.976). Consequently, the estimates of the missßlg values (22.7% of the data points for the female dropouts) could be based upon reasonably good statistical models.
The second analysis of variance, now with 20 sub- jects in each group, corroborated tbe first. Neither the group factor 'sex' (F = 0.3, df = 1, 38, P = 0.305) nor the interaction 'sex by stimulus intensity' (F = 0.3, df
= 10, 380, P = 0.487) became significant. While an element of uncertainty remains, these results make a sex difference in tbe magnitude estimation of the ther- mal stimuli very unlikely.
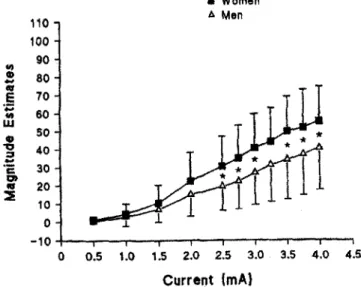
Nine women and 5 men could not be included in the magnitude estimation experiment with electrical stim- uli because their tolerance thresholds were too low to enable them to receive tbe füll stimulus range of 0.5-4 mA. Fig. 5 presents the magnitude estimation results.
• Women
110 A Men
100
.,, 90
CD 80
„
"'
.§ ... ... 70 60
w • 50
'O :J 40
-
·c: 30
Q) • 20
::E 10 0 -10
0 0.5 1.0 1.5 2.0 2.5 3.0 3.5 4.0 4.5
Current {mA}
Fig. 5. Magnitude estimates of elcctrical stimuli applied to the band ranging from O.S mA to 4 mA in women and men; mean and 1 S.D.
arc given; n • 11 for women and n „ 15 for men. Significant sex differences at an intensity level arc shown by stars (all P ~ 0.05).
Again, the effect of stimulus intensity was highly signif- icant (F = 89.5, df = 10, 240, P < 0.001). However, the effect of sex (F = 3.39, df = 1, 24, P = 0.039) and, to a stronger degree, tbe interaction 'sex by stimulus inten- sity' (F = 2.59, df = 10, 240, P = 0.003) were also sig- nificant. Subsequent t tests for sex diff erences at each stimulus intensity level revealed that the significant interaction was based on significant sex differences from the intensity of 2.5 mA on, the intensity of 3.25 mA being the only exception (0.5 mA: t = 0.9, P =
OJ81; 1.0 mA: t = 0.6, P = 0.220; 1.5 mA: t == 1.4, p = 0.124; 2.0 mA: t = 1.9, p = 0.092; 2.5 mA: t = 3.6,
P = 0.034; 2.75 mA: t = 3.8, P = 0.032; 3.0 mA: t = 3.8,
f = 0.032; 3.25 mA: t = 2.8, p = 0.053; 3.5 mA: t = 3.7,
p = 0.033; 3.75 mA: t = 3.0, p = 0.047; 4.0 mA: t = 3.0,
P = 0.047). According to the t values, the sex differ- ences, once established, did not increase in size witb increasing stimulus intensity.
A comparison of the magnitude estimates shown in Figs. 4 and 5 indicates that the pre-set electrical stimu- lus intensities were not rated as painful as the pre-set thermal stimulus intensities (as a reminder, a 'barely painful sensation' was tobe rated as 50). More subjects bad to be excluded from magnitude estimation with electrical stimuli than from magnitude estimation with thermal stimuli to avoid undue discomfort. Had we abandoned ethical considerations and forced all sub- jects to rate all of the presentations in the full stimulus range, it is likely that the perceived magnitudes at the upper end of the physical scale would have been simi- lar for the electrical and thermal stimuli.
Correlations between thermo- and e/ectrocutaneous re- sponsiveness measures
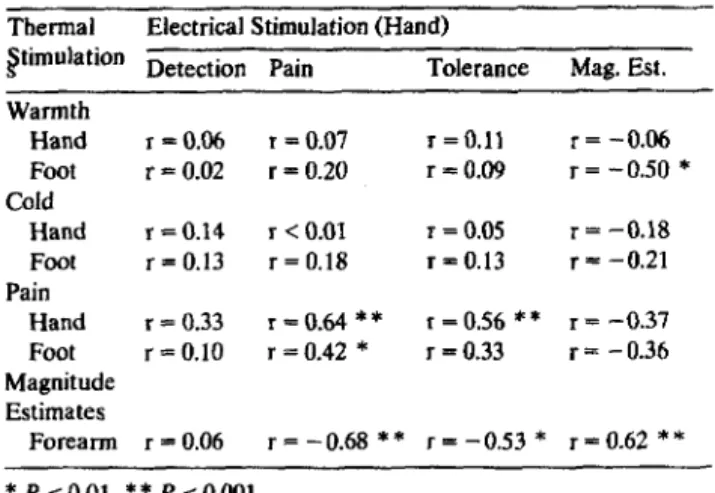
The findings point to a clear difference between thermo- and electrocutaneous stimulation in demon- strating sex differences. Therefore, it was of interest to look at the relationship between the two groups of measures. The corresponding correlational analysis is presented in Table II. lt is evident that when non-pain- ful levels are involved there was almost no relation between thennal and electrical measures (with tbe exception of tbe implausible but significant correlation between the collapsed magnitude estimates with elec- trical stimulation at the band and the warmth thresh- old at the foot). In contrast, the two heat pain tbresh- olds (band, foot) correlated significantly with the elec- trical pain threshold measured at the band. Similar cross-modal consistency in pain responsiveness was re- ported by Harris and Rollman (1983). A tendency to site specificity was found, since the pain measures determined at one site correlated more strongly with each other than tbose determined at different sites.
The collapsed magnitude estimates of the thermal stimuli correlated significantly and negatively with the electrocutaneous pain threshold and tolerance. That is,
TABLE II
SPEARMAN RANK CORRELATIONS FOR THE RELATION BETWEEN THERMO- AND ELECTROCUTANEOUS MEA- SURES OF SENSITIVITY
n = 40 for all correlations with the exception of those where magni- tude estirnates are involved, here n = 24.
Thermal Electrical Stimulation (Hand)
~timulation Detection Pain Tolerance Mag. Est.
Warmth
Hand r =0.06 T =0.07 r = 0.11 r = -0.06 Foot r= 0.02 r = 0.20 r =0.09 T = -0.50 *
Cold
Hand r = 0.14 r < 0.01 T =0.05 r= -0.18 Foot r = 0.13 r = 0.18 r=0.13 r= -0.21 Pain
Hand r = 0.33 r =0.64 ** r =0.56 ** r= -0.37
Foot r = 0.10 r = 0.42 * r =0.33 r= -0.36 Magnitude
Estimates
Forearrn r = 0.06 r = -0.68 ** r = -0.53 * r= 0.62 **
* p $ 0.01, ** p $ 0.001.
subjects with low electrical pain thresholds and toler- ance levels rated strong thermal stimuli as more in- tense than did those with high thresholds.
However, the collapsed magnitude estimates of the electrical stimuli, while in the appropriate direction, did not significantly correlate with the heat pain thresholds (band, foot). This may be a consequence of the finding that the ratings of the thermal stimuli were clearly higher and more strongly reflect painful sensa- tions (see foregoing paragraph).
The sizable relation between experimental pain measures across induction methods was all the more meaningful because the magnitude of these correla- tions is comparable to the values obtained for correla- tions within a modality. For thermal stimulation, pain threshold on the band correlated with that on the foot (r = 0.86). The collapsed magnitude estimates for the 11 temperature Ievels correlated with band (r = -0.75) and foot (r = - 0.68) heat pain thresholds. All correla- tions bad a P ~ 0.001. For electrocutaneous stimula- tion, pain threshold and tolerance had a correlation coefficient of 0.67. Collapsed magnitude estimates for the 11 current levels correlated significantly with pain threshold (r = -0.88) and tolerance (r = -0.59).
Again, P ;:;! 0.001.
Taken together, the correlational analysis suggests that the responsiveness measures of both stimulation methods are indicators of a common perceptual pro- cess at painful levels but not at non-painful ones.
Correlations between responsiveness measures and co- variates (body measures, anxiety, reactivity)
In order to test the assumption that sex differences in the responsiveness measures can be explained by
other variables, we Iooked for significant correlations in the two sexes separated and in the samples com- bined. None of the covariates presented in Table 1 met this criterion. There were some examples of relations which appear significant when the two sexes are com- bined, bot not for males or for females separately.
Height, for example, correlated significantly with the electrical detection threshold ( r = 0.50, P < 0.001), pain threshold (r = 0.37, P = 0.009) and tolerance threshold (r = 0.40, P = 0.005) only in the combined sample.
Similarly, body surface area correlated significantly with the electrical pain threshold (r = 0.37, P = 0.009) and tolerance threshold (r = 0.43, P = 0.003) in the com- bined sample.
We consider these to be pseudo-relations; ones which emerge because size and responsiveness data for women tend to duster together in one group and those for men in another. There is no indication of a rela- tionship between responsiveness and height or body area when the data for males alone or females alone are examined.
In addition to such pseudo-relations, some inexpli- cable correlations appeared although we had set an alpha of 0.01 for the correlational analysis. We rnen- tion them in passing: for the combined sample, STAI- Xl x warmth threshold at the foot, r = -0.42, P =
0.003; for the group of women, age X electrical toler- ance threshold, r = 0.54, P = 0.008; STAI-Xl X cold threshold at the band, r = - 0.68, P = 0.001; RS X heat pain thresbold at the foot, r = - 0.54, P = 0.007; body mass index X electrical detection threshold, r = - 0.55, P= 0.006.
Discussion
The major finding of the present study was that different stimulation methods (thermo- and electrocu- taneous) with a single set of observers produced differ- ent outcomes witb respect to sex differences in respon- siveness to non-painful and painful stimuli. Therefore, the assumption that the conflicting results of our previ- ous electrical (Rollman Harris 1984, 1987; Rollman et al. 1990) and thermal (Lautenbacher and Strian 1991) studies were only due to sample differences could be rejected. With both stimulation techniques the earlier findings were replicated, demonstrating their reliabil- ity.
In the replication of Lautenbacher and Strian's (1991) study, again there were no sex differences in heat pain thresholds measured at the band and foot. In the present investigation, the sample consisted of Canadians instead of Germans, and the mean age was 20.8 years instead 37.7 years. The findings of these two studies were akin to those of Kenshalo (1986), having applied a similar stimulation method (contact heat) for
the assessment of pain thresholds at comparable sites in a group of young subjects and a group of elderly subjects. The present study and the earlier ones also demonstrated that there are no sex differences for the detection of non-painful cold. The only measure that produced conflicting findings in the three studies was the detection threshold for non-painful warmth. In Lautenbacher and Strian's (1991) study, women were more responsive than men to a small degree at the band and to a large degree at the foot, whereas the present study showed no sex differences at either site.
Kenshalo observed lower thresholds at the foot for young women, compared to men of sirnilar age, but not for older women.
The present study expanded the methods to include magnitude estimation of sensation level for tempera- tures ranging from non-painful (38°C) to painful levels (48°C). The subjects were told that they could switch off the temperature increase at any time in order to avoid undue discomfort. Only women (30%) did so, mainly with temperatures clearly above pain threshold.
This can be interpreted as less willingness of women than of men to experience supra-threshold heat pain.
We excluded those women who withdrew on any of the trials from further evaluation. There was no indication that the remaining women rated the temperatures, both at non-painful and painful levels, differently from men.
Several points ought to be made. First, data from all the women and all the men went into the threshold comparisons. No gender differences emerged. Second, magnitude estimates reflect data from all the men and the majority of women (70% ). Again, no differences were found. Had the excluded women been willing to endure higher temperatures, it is possible that the estimates for women would have been somewhat ele- vated within the upper pain range. The analysis based upon replacement of missing data with estimates ob- tained from individual psychophysical functions, how~
ever, strongly reinforced the original conclusions. The evidence clearly indicates that the majority of women have a similar responsiveness to both non-painful and painful temperatures as men.
Our findings contrast with the results of the study conducted by Feine et al. (1991) who also used a contact thermode and a magnitude estimation proce- dure. Feine et al. found that women gave appreciably higher ratings with the sarne temperatures than men.
These differences occurred even at the lower end of their temperature range where the stimuli seem to be around the pain threshold level. lt is unli.kely that sample differences were the cause for the differing results, since young Canadians were the subjects in both studies. The sex of the experimenter is also un- likely to account for the differences. Feine et al. found tbat tbeir sex differences occurred irrespective of the
experimenter's gender. Moreover, the same male ex- perimenter ran all sessions of this study, yet the sex of the subject was only significant for the electrical pulses.
The most li.kely reason for the different outcomes in this study and that of Feine et al. seems to be the thermal stimulation parameters. The present study ap- plied temperatures from 38 - 48°C to the forearm with a 5.8 cm2 thermode and a rate of temperature change of l.5°C/sec. The corresponding parameters for the Feine et al. study were 45 - 500C applied above the subject's upper lip, 0.8 cm2 and 6°C/sec.
The fact that we were unable to administer the upper end of our temperature scale to all subjects, while in the Feine et al. study even higher tempera- tures could apparently be used without any problems, suggests that the same temperatures were feit as less intense in that investigation than in our own. This cannot be easily explained by the different heating slopes, because it has been demonstrated that higher rates of temperature change lead to higber sensation intensities (Yamitsky and Ochoa 1990). lt is also un- likely that the sites used accounted for the clifference.
The smaller size of the thermode in the Feine et al.
study, however, could weil be critical. Douglas et al.
(1992) and Price et al. (1989) presented persuasive evidence for spatial summation of heat pain within the range of areas under discussion. Hence, one might speculate that the degree of spatial summation was the critical difference between the two studies. If spatial swnrnation mechanisms are stronger and reach a ceil- ing sooner in women than in men, sex differences may occur with small thermodes but not with large ones.
This analysis would also account for the finding of no sex differences for heat pain thresholds in the study of Kenshalo (1986) who also used a large thermode (7.1 cm2).
lt might be argued that the difference in heating slope between the Feine et al. study and our own was still the crucial factor accounting for the contrasting findings on sex differences, but for affective and moti- vationaJ reasons rather than sensory ones. Feine et al.'s higher slopes may have lead to greater levels of anxiety specifically related to the stimulation, influencing the rating of sensation magnitude. These anxiety levels may be different in the two sexes.
The results of the present study were also in agree- ment witb the earlier findings of Rollman and cowork- ers (Rollman and Harris 1984, 1987; Rollman et al.
1990) regarding sex differences with electrocutaneous stimulation. Again, lower detection, pain, and toler- ance thresholds were obtained in women than in men.
The magnitude estimation outcomes corroborated the results for the thresholds. From a simulation intensity of 2.5 mA on, quite stable sex differences emerged, _with women being more responsive than men. This contrasts with some other studies that used electrocu-
taneous stimulation, where either no sex differences (Neri and Aggazani, 1984) or differences only for toler- ance threshold (Notermans and Tophoff 1967; Robin et al. 1987) were obtained.
A closer comparison of the present study with that of Robin et al. (1987) is particularly interesting, since similar samples (young subjects) and similar psy- chophysical procedures (method of limits with ascend- ing series for the measurement of detection, pain, and tolerance thresholds) were used. In the Robin et al.
study, the mean threshold values were similar for the detection threshold, lower for the pain threshold, and clearly lower for the tolerance threshold when com- pared with the present study. Different stimulation parameters may account for the differences. Here, ten 1-msec pulses were applied with a frequency of 50 Hz through electrodes with a size of 0.5 cm2 to the dorsal hand; Robin et al. used fifteen 10-msec pulses with a frequency of 10 Hz and electrodes of 4.5 cm2 at the finger pads.
Pulse duration may have been the crucial factor. If the electrode size were critical, the detection threshold should have been lower in the Robin et al. study than in ours (Higashiyama and Tashiro 1990). The lower frequency should have produced higher pain and toler- ance thresholds in the Robin et al. study than in ours (Notermans 1966). Neither was the case. However, increases of the pulse duration above 1 msec seem to affect the pain threshold but not the detection thresh- old (Notermans 1966; Rollman 1969, 1975; Hi- gashiyama and Tashiro 1983; Virtanen et al. 1987).
Therefore, the difference in pulse duration between the two studies (1 msec vs. 10 msec) may play a role in accounting for the differing levels of the pain and tolerance thresholds and the partially divergent out- comes on sex differences. The hypothesis that sex differences become less likely with increasing temporal summation fits with the negative results of Neri and Aggazani (1984) and the partially negative results of Notermans and Tophoff (1967), both of whom used a pulse duration of 5 msec.
Altematively, a more psychological explanation, sim- ilar to that posed for the results on thermal sensations, may be considered. Anxiety directly relevant to the stimulation can have an effect on pain sensitivity, while irrelevant anxiety does not (Al Absi and Rokke 1991).
ln the present study and in the former studies of Rollman's group (Rollman and Harris 1984, 1987;
Rollman et al. 1990) shorter pulse trains were used than in the other studies mentioned above. Very brief shocks may evoke more anxiety, do this in a sex-related fashion, and thus influence the reported sensation in- tensity. General state anxiety neither differed between women and men nor correlated significantly with the responsiveness measures. Perhaps better measures of stimulation-relevant anxiety are needed.
Direct scaling methods proved to be useful additions to threshold procedures for the investigation of sex differences. However, because of the considerable indi- vidual differences in the stimulus intensities which produce pain, particularly for electrical stimulation, it was not possible to select a uniform range of pain stimuli for all subjects. This fact, recently also noted by Boureau et al. (1991), in a study with pain patients, deserves further consideration because the conse- quence is either having selected samples (as in the present study) or a decline in data quality with higher intensities due to an increasing amount of missing data.
Rollman and Harris (1987) noted that in selecting the stimuli to be used in magnitude estimation tasks, two approaches can be contrasted. The first is to present the same stimuli to all observers, while the second is to tailor the stimulus set to each individual's pain sensitivity range. The first more readily permits comparisons across groups and was utilized here.
Our correlational analysis showed that there was almost no relation between thermo- and electrocuta- neous responsiveness at non-painful levets. This find- ing confirms that different neural systems are activated by weak thermal and electrical stimuli. Non-painful thermal stimuli trigger neural activity in small-diameter nerve fibers (Al> and C) (Darian-Smith 1984). Electri- cal pulses directly activate large A-fibers (Reilly 1992;
Rollman 1975). The different fibers, different spinal transmission systems, and different central processing mechanisms which are engaged by the two stimulus modalities apparently give rise to independent levels of sornesthetic sensitivity.
In contrast, substantial correlations were found be- tween tbe responsiveness measures of the two methods at painful levels. This provides further evidence that various forms of noxious stirnulation can activate a common pain system (Harris and RoUman 1983;
Melzack and Casey 1968). The close relation was pre- served although tbe two stimulation methods differed clearly in their outcornes regarding sex diff erences.
None of our covariates (body measures, anxiety, psychological reactivity) appeared to be able to explain the observed sex differences because none of thein met the criterion of correlating significantly with the re- sponsiveness measures both in the two sexes separated and in the sample combined and of differing signifi- cantly between the sexes.
The present study clearly showed that the finding of sex differences in cutaneous responsiveness at non- painful and painful levels depends on the stimulation method used. Positive results were demonstrated with electrocutaneous stimulation; negative results occurred with thermocutaneous presentations. Moreover, it seems that within a single physical dimension (electri- cal, thermal, etc.), stimulus parameters may have a