Monitoring Dependencies for SLAs: The MoDe4SLA Approach
Lianne Bodenstaff
1∗, Andreas Wombacher
2IS Group
1, DB Group
2University of Twente The Netherlands
{l.bodenstaff|a.wombacher}@utwente.nl
Manfred Reichert DBIS Group University of Ulm
Germany
manfred.reichert@uni-ulm.de
Michael C. Jaeger KBS Group Techn. Universit¨at Berlin
Germany
mcj@cs.tu-berlin.de
Abstract
In service oriented computing different techniques for monitoring Service Level Agreements (SLAs) are available.
Many of these monitoring approaches focus on bilateral agreements between partners. However, when monitoring composite services it is not only important to figure out whether SLAs are violated, but we also need to analyze why these violations have occurred. When offering a compos- ite service a company depends on its content providers to meet the service level they agreed upon. Due to these de- pendencies a company should not only monitor the SLA of the composite service, but also the SLAs of the services it depends on. By analyzing and monitoring the composite service in this way, causes for SLA violations can be easier found. In this paper we demonstrate how to analyze SLAs during development phase and how to monitor these depen- dencies using event logs during runtime. We call our ap- proach MoDe4SLA (Monitoring Dependencies for SLAs).
1. Introduction
For a business operating in a networked environment it is vital to accurately manage the services it provides to its customers. This is particularly challenging when a busi- ness offers compositeservices where interaction with ser- vices offered by other providers influence its performance.
The quality of service, which can be offered to customers, is calculated taking all these dependencies into account [10], [7]. Consider a composite service which returns combined information from several search engines. In this case, the quality of service (e.g. response time) which can be offered depends on the quality of service delivered by the search engines. Together with constraints of the customer, these
∗This research has been supported by the Dutch Organization for Sci- entific Research (NWO) under contract number 612.063.409
calculations form the basis for a Service Level Agreement (SLA) between customer and service provider [12], [14].
Several approaches exist formonitoringthe service level of services during runtime (e.g. [15]). The monitoring results are compared with the constraints specified in the SLA for possible violation detection. Since SLAs are typically bi- lateral agreements, current monitoring approaches focus on identifying violations in bilateral communication. Impor- tant research questions in this area are, for example, how to gather reliable data, how to structure these data, and how to combine data from different sources. Such monitors are often process specific, activated or created when a service is invoked, and terminated when the service is completed.
Most approaches for managing composite services com- bine the level of quality a company can provide with moni- toring bilateral communication. However, to properly man- age its composite service a company has to be able to rea- son about causesof SLA violations. For example, when the offered response time for a composite service provided by a company depends on response times of other ser- vices this company uses, it is vital to identify and moni- tor thesedependencies. Exactly these dependencies are ig- nored by bilateral monitoring approaches. However, com- bining bilateral monitoring results based on their dependen- cies is, as we discuss in this paper, highly challenging. With the MoDe4SLA approach we analyze during development phase different types of dependencies between services, and theimpactservices have on each other. Further, it allows to combine bilateral monitoring results with analyzed depen- dencies and impacts of the composite service.
We demonstrate our approach by means of an intuitive example in which a company offers two composite services to its customers. SubscribedNewsis a composite service where customers automatically receive a news report. This report is created by combining news items on personal inter- est (e.g., stock market information) from two different news providers. Customers pay a flat fee for this service. News- Request, in turn, is a composite service which allows cus- tomers to request up-to-date news information on a specific
search query. The NewsRequest service is paid per invo- cation. For every request the company invokes two content providers and sends information from the fastest responding to the customer.
To offer the SubscribedNews service to its customers, the company automatically receives data (i.e., news items) from its content providers (i.e., news providers). This data is stored in a databasefrom which the company retrieves data when composing the news report for its customers.
The company has an SLA with both content providers and customers. Furthermore, providing the news report for cus- tomers does not trigger a service invocation by the company to the content providers for data, since up-to-date data is re- trieved from the database. Therefore, obtaining data from content providers and sending reports to customers are dif- ferent processes (i.e., invocations). However, response time performance for offering NewsRequest is highly dependent on the response time of the service provided by the content providers. As a result, SLA violations between the com- pany and its providers might result in SLA violations from company to customer, which cannot be identified using a bilateral monitoring approach. For example, when the con- tent provider never meets the response time constraint, the company most likely will also not be able to meet the re- sponse time it agreed upont with the customer. Therefore, it is highly important for a company to not only monitor SLA violations for each metric but also their dependencies on the same metrics in other SLAs to identifycauses.
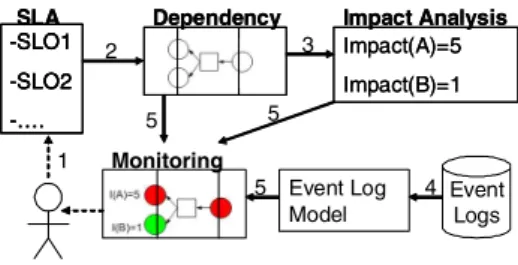
Our MoDe4SLA approach allows to monitor these de- pendencies between SLAs, enabling decision support when managing composite services. Fig. 1 gives an overview of MoDe4SLA. Our contribution is to provide an approach which allows the company to analyze its SLAs (annotated with 1 in Fig. 1) by:
• identifying relevantdependencyrelations between ser- vices during development phase (annotated with 2 in Fig. 1) (cf. Sect. 3),
• analyzing theimpactthese dependent services have on the composite service during development phase (an- notated with 3 in Fig. 1) (cf. Sect. 4),
• structuring monitoring results based on dependency relations at runtime (annotated with 4 in Fig. 1) (cf.
Sect. 5.1), and
• identifying causes for SLA violations by graphically representing the comparison of development phase dependency analysis with runtime monitoring results (annotated with 5 in Fig. 1) (cf. Sect. 5.2).
2. MoDe4SLA Approach
Our approach aims at supporting a company in managing its composite services by identifying and monitoring their
Event Logs Dependency
Dependency
Event Log Model Monitoring
Impact(A)=5 Impact(B)=1 Impact Analysis Impact(A)=5 Impact(B)=1 Impact Analysis -SLO1
-SLO2 -….
SLA -SLO1 -SLO2 -….
-SLO1 -SLO2 -….
SLA 2
1
3
4 5 5
5
Figure 1. MoDe4SLA Approach
dependencies to services requested from other providers.
These dependencies are represented in adependency model.
For each constraint in the SLA of a composite service, the services it depends on are identified. An SLA typically con- sists of a set ofService Level Objectives(SLO) which con- tain guaranteed quality constraints [12], [14]. A typical ex- ample of an SLO is:
In 90% of all cases, invocation of service X will have a response time within y milliseconds (ms).
Each of these SLOs ismeasurableand consists out of one or more, possibly composite,metrics. For example, a com- posite metrics can be the average response time over all customers in a month. Furthermore, these SLOs typically hold a validitytime constraint, for example “Mo-Fri 9:00- 17:00”.
Offering a composite service to customers implies that a company relies on content providers to offer necessary data.
Both customers and content providers have an SLA with the company. We propose to explicate for each SLO on which other services its performancedepends(cf. Fig. 1). Differ- ent SLOs in one SLA might depend on different services or depend on them in different ways. For example, if a com- pany offers information with a fast response time by query- ing five providers and returning information of the fastest responding one, a cost constraint will be influenced by all five services (due to invocation they all have to be paid) while a response time constraint will only be influenced by the fastest responding service.
Furthermore, we demonstrate how to calculate the im- pacta service has on a depending composite service. As- sume for example that the cost constraint on a composite service depends on service A and service B, where service A costs on average ten times more than service B. Now, the cost impact of service A on the composite service is ten times higher than the one of service B. Based on the de- pendency model we calculate the impact of a service on the composite service (cf. Fig. 1), using impact analysis.
Data on messages exchanged between customer and provider are gathered inevent logs. These event logs en- able monitoring the SLOs and their dependencies based on
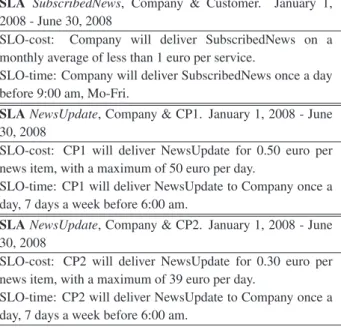
SLA SubscribedNews, Company & Customer. January 1, 2008 - June 30, 2008
SLO-cost: Company will deliver SubscribedNews on a monthly average of less than 1 euro per service.
SLO-time: Company will deliver SubscribedNews once a day before 9:00 am, Mo-Fri.
SLANewsUpdate, Company & CP1. January 1, 2008 - June 30, 2008
SLO-cost: CP1 will deliver NewsUpdate for 0.50 euro per news item, with a maximum of 50 euro per day.
SLO-time: CP1 will deliver NewsUpdate to Company once a day, 7 days a week before 6:00 am.
SLANewsUpdate, Company & CP2. January 1, 2008 - June 30, 2008
SLO-cost: CP2 will deliver NewsUpdate for 0.30 euro per news item, with a maximum of 39 euro per day.
SLO-time: CP2 will deliver NewsUpdate to Company once a day, 7 days a week before 6:00 am.
Table 1. SLAs SubcribedNews
these data. We abstract and structure necessary data from event logs in anevent log modelto enable evaluation and monitoring of SLOs (cf. Fig. 1). For decision support in managing composite services, we combine the dependen- cies, the calculated impact factors, and the bilateral moni- toring results into one model which graphically represents these relations.
3. Dependency Models
A composite service depends on one or more other ser- vices. In our example, SubscribedNews and NewsRequest both depend on two other services offered by different con- tent providers. In our approach, we specify onwhichser- vices the fulfillment of a specific SLO depends andhowit depends on these services. The SLOs for cost and response time, specified in the SLAs of the company with content providers (CP1 and CP2) and customers are denoted in Ta- ble 1 and Table 2. Note that we do not provide a speci- fication language for SLAs like WSLA Framework [12] or the SLA language by Sahai et al. [14]. Instead our approach focusses on conceptual issues and is thus language indepen- dent.
The company delivers from Monday to Friday before 9:00 am news items the customer is interested in. The price is not higher than 1 euro and depends mainly on the number of news items that fit the requirements of the customer. With its content providers the company agreed to deliver daily all news items for a fixed price per item with a maximum of, respectively, 50 and 39 euro per day. These news items are delivered before 6:00 am. Regarding the NewsRequest
SLANewsRequest, Company & Customer. January 1, 2008 - June 30, 2008
SLO-cost: Invocation NewsRequest by Customer will cost the first 100 times in a month 0.50 euro, thereafter 0.40 euro.
SLO-time: Company will respond to NewsRequest invocation by Customer within 5 ms, 99% of the time.
SLARequest, Company & CP1. January 1, 2008 - June 30, 2008
SLO-cost: Invocation Request by Company will cost 0.20 euro.
SLO-time: CP1 will respond to Request invocation by Com- pany within 3 ms, 99.9% of the time.
SLARequest, Company & CP2. January 1, 2008 - June 30, 2008
SLO-cost: Invocation Request by Company will cost 0.15 euro.
SLO-time: CP2 will respond to Request invocation by Com- pany within 4 ms, 99% of the time.
Table 2. SLAs NewsRequest
service the customer can request news on a specific topic.
These requests costs 0.50 euro. If the customer has more than 100 requests per month, price per invocation will de- crease to 0.40 euro. Each request will be in 99% of all cases responded within 5 ms. The company, in turn, invokes the services of two content providers for every NewsRequest and sends data from the fastest responding to its customer.
Content providers respond within 3 ms (4 ms) for 0.20 euro (0.15 euro) to an invocation by the company in 99.9% (99%) of all cases.
Although dependency models for SLOs might differ in notation, common requirements can be identified:
• Req. 1: Model the composite service and the services it depends on.
• Req. 2: Model dependency on more than one service.
• Req. 3: Model dependency on one service out of a set.
Quantification has to be possible.
• Req. 4: Model storage with or without reuse.
Req. 2 ensures that the cost of a composite service may depend on the costs of two other services. Req. 3 states that when a choice between services occurs, the company should be able to estimate how often each of the services will be chosen. Req. 4 enables to model reuse of data from a service. For example, in SubscribedNews the company uses a database of information to serve its customers and it fills the database by querying several content providers.
Data from content providers can be reused in other com- posite services. In Sect. 3.1 and Sect. 3.2 the construction of dependency models for the SLOs of the composite ser- vices SubscribedNews and NewsRequest are described.
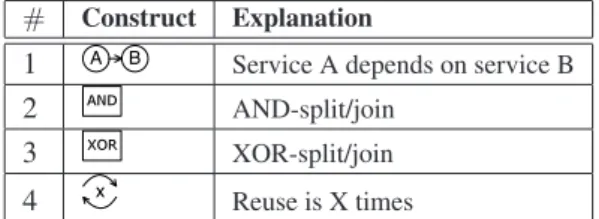
# Construct Explanation
1 A B Service A depends on service B
2 AND AND-split/join
3 XOR XOR-split/join
4 x Reuse is X times
Table 3. Cost Model Constructs
3.1. Dependency Model for Cost
Both examples (i.e., SubscribedNews and NewsRequest) contain one SLO depicting a cost constraint (cf. Table 1 and 2). Here, we construct for both examples thecost de- pendency model. We introduce a domain-specific modelling language for cost dependencies which enables depicting all necessary details while keeping a high level of abstraction.
This enhances readability and decreases necessary mod- elling effort. The requirements enumerated in Sect. 3 are implemented by the constructs from Table 3. It is possible to model that meeting a constraint for one servicedepends on how the performance of another service is. It is also pos- sible to model that meeting constraints for one service de- pends on two or more different services with anAND-split.
Furthermore, by usingXOR-splitsexclusive choices can be modelled (i.e., the service depends on one out of a set of ser- vices) with the possibility to add aratioon the likelihood of choosing one of the options. As a last modelling construct it is possible to denotereuseof data provided by a service.
Fig. 2 shows onwhichservices the cost of Subscribed- News and NewsRequest depend andhowthese dependen- cies look like. The cost of composite service Subscribed- News is dependent on the cost of NewsUpdate with both CP1 and CP2, indicated with an AND-split (cf. Fig. 2).
Moreover, NewsUpdate data is used more than once (i.e.
the company sends more than once the same data to differ- ent customers). Thisreuseis 100 times of data from CP1 and 80 times from CP2 (cf. Fig. 2). Note that data from CP1 are more often reused than data from CP2 because the former are also used in another unrelated service offered by the company.
The cost of composite service NewsRequest is depen- dent on both costs of Request from CP1 and CP2. This is again indicated with an AND-split (cf. Fig. 2). So, even though the customer only receives data from one service provider, he pays for fast delivery, namely the cost of in- voking two content providers. Data for a news request are not reused.
3.2. Dependency Model for Response Time SubscribedNews and NewsRequest both contain an SLO with atimeconstraint (cf. Table 1 and 2). Next, we intro-
AND CP1
CP2
Customer Company
News Update
Sub scribed
News
100
News 80
Update
(a) SubscribedNews
AND CP1
CP2
Customer Company Request
News Request Request
(b) NewsRequest
Figure 2. Cost Dependency Model
# Construct Explanation
1 A B Service B depends on service A.
Also: serial execution of services.
2 AND-split: parallel execution.
3 XOR-split.
4 DB
n n n
Database, DB, with reuse of data.
Table 4. Response Time Constructs
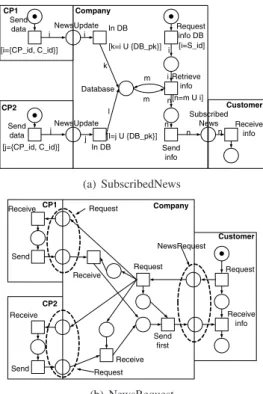
duce the domain specificresponse time dependency model for both examples. Apart from the general modelling re- quirements for dependency models as depicted in Sect. 3, also the order in which services are executed is relevant for response times. For example, if the services on which the composite service depends can be executed in paral- lel, the response time will be faster than when compared to serialized execution. Workflow modelling techniques are highly suitable for modelling response time dependencies, allowing ordering of messages. We use Coloured Petri Nets (CPN) [11] for these models. Table 4 discusses the require- ments as summarized in Sect. 3 for Petri Nets. We illustrate how the different requirements can be modelled. Note that by using Petri Nets these requirements can be modelled in many different ways.
The response time for SubscribedNews is dependent on NewsUpdate services of both CP1 and CP2 (cf. Fig. 3).
The CPN depicts how CP1 and CP2 send data which are then stored in the database of the company. Both content providers send their id (CP id) together with the content (i.e., news items,C id). The company adds this informa- tion to the database while inserting a primary key (DB pk).
Independent from filling the database, the company sends daily updates to customers with specific interests by re- questing data from the database (S id). Data used to com- pose a news report for the customer can be reused for other reports. Therefore, information requested from the database are also returned (m). The resulting report is sent to the cus- tomer.
Response time dependencies for NewsRequest are de- pendent on the response times of Request services invoked
i i [i={CP_id, C_id}]
[j={CP_id, C_id}]
j j CP2
CP1 Company
Customer Send
data Send
data In DB
In DB k
[k=i U {DB_pk}]
[l=j U {DB_pk}]
l
Request info DB [i=S_id]
i
Retrieve info m i
m n[n=m U i]
n n Send
info
Receive n info Database
NewsUpdate
NewsUpdate
Subscribed News
(a) SubscribedNews
CP2
CP1 Company
Customer Receive
Request Request
Send first
Receive info Send
Receive
Receive
Send
Receive Request
Request
NewsRequest
(b) NewsRequest
Figure 3. Time Dependency Models
by the company to both content providers (cf. Fig. 3). For readability purposes we omit coloring of the Petri Net. As soon as the company receives a response from one of the two content providers, it sends out this information to the customer (Send first). This enables faster response times for the customer.
4. Impact Analysis
The dependency model for an SLO depicts on which ser- vices a composite service depends. However, not every ser- vice the composite service depends on, has the same im- pacton the composite service. For example, if costs for a composite service depend on services A and B, but service A costs on average only ten percent of service B, the im- pact of service B on the price of the composite service is much higher than the impact of service A. Therefore, our approach allows to do animpact analysisfor every depen- dency model. The impact a service has on the compos- ite service can be determined by analyzing the dependency model. Each construct (e.g. AND-split) in the dependency model affects the impact of the service it connects to the composite service in a different way. For example, an AND- split in a cost dependency model denotes that costs for a composite service are influenced by both services it depends on. Opposed to this, an XOR-split indicates that the costs
Graph Equation Cost Response Time
x Ar y I(A) =xAr A A y=x
xAND y z
y=x AND All parallel
x=z splits and joins
xXOR y z r s
y=rx XOR All exclusive
z=sx choices
x OR y z r s
y=rx All m-out-of-n
z=sx choices
x DBy y= 0 All databases
and storages
x RE y y= REx x
Table 5. Nodes of Abstraction Graph
for the composite service is influenced by only one of the two services it depends on (i.e., a service only has an im- pact on part of the composite service instances), which de- creases the impact of these services with 50% (i.e., each ser- vice only occurs in half of the composite service instances).
This impact factor indicates how likely it is that the service influenced the performance of the composite service.
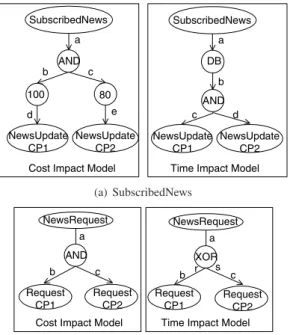
To calculate this impact factor, we need to go through the dependency model, starting at the composite service through all constructs, ending at the services. By consid- ering the effects of each construct on the impact while go- ing through the model, we can calculate the impact of the service. For analyzing the dependency model in a struc- tured way we create anabstraction graphto depict the im- pact models. For each construct in the dependency model a node with its impact equation is created. Table 5 denotes the graph notationandequationfor all constructs of cost and response time dependency models. The comparison impact value of the composite service is always 1.
The impact factor of service A (I(A)) on a composite service is equal to factorxon the incoming edge times the value of serviceAtimes number of loopsr(cf. Table 5).
Value A is either the estimated cost or the estimated re- sponse time. The number of loopsr will be important if one service gets invoked more than once for one composite service. For example, if for a composite service the com- pany invokes twice (r= 2) the same service A of its content provider with a response time of 3 ms before responding to a request of its customer. If serviceAresults in the invo- cation of another service (serialism) the outgoing edge (y) will have the same impact factor as the incoming one (x) (cf.
Table 5). The second construct is anAND-splitwhere out- going edges (yandz) have the same impact factor as the in- coming edge (x). The third construct is anXOR-splitwhere estimated ratio r:s determines the impact of edgesyandz. Assume that for fulfilling a composite service a company
SubscribedNews
AND
NewsUpdate CP1
NewsUpdate CP2
80 100
a
d e
c b
SubscribedNews
AND
NewsUpdate CP1
NewsUpdate CP2 a
d c
b DB
Cost Impact Model Time Impact Model (a) SubscribedNews
a
c b
Cost Impact Model Time Impact Model NewsRequest
AND
Request CP1
Request CP2
a
c b
NewsRequest
XOR
Request CP2 Request
CP1 r s
(b) NewsRequest
Figure 4. Impact Models
chooses between two content providers. The first offers fast, but expensive data, the second offers slow but cheap data.
Depending on the customer, the company chooses either of the two. Estimations by the company are that it will choose 3:1 (r:s) for the fast service. The fourth construct is anOR- splitto enable modelling response time dependencies on a subsetof a set of services (i.e., m-out-of-n services). For ex- ample, choosing the first three responses on ten invocations.
The equation is the same as for the XOR equation except thatr+s≥1holds. The fifth construct enables modelling a databaseorstorage. When the results of a service are stored in a database or, with physical goods, in a storage then the dependency on response time for the composite service will disappear. Therefore, the impact of services adding infor- mation or goods to a database or storage on the composite service regarding response time is zero. The last construct in Table 5 enables modelling reuse which influences the cost impact factor. When information is reused the cost for the service is divided among these services. Therefore, the im- pact factor for costs is divided by the estimated number of reuses.
To ensure completeness for our impact model constructs we analyzed all Workflow Patterns [1]. The influence on the response time for each of these patterns is evaluated and can be represented with the constructs of the abstraction graph.
Fig. 4 depicts impact graphs for both response time and cost of the SubscribedNews service as abstracted from the de- pendency model. Forcostthe service depends on both Up- dateNews services with a reuse element in between, to mit-
Impact Factor Equation Result
I cost(N ewsU pdateCP1) 1001 40 0.4 I cost(N ewsU pdateCP2) 80130 0.375 I time(N ewsU pdateCP1) 0 0 I time(N ewsU pdateCP2) 0 0 I cost(RequestCP1) 0.20 0.20 I cost(RequestCP2) 0.15 0.15 I time(RequestCP1) 3times3 9 I time(RequestCP2) 1times4 4
Table 6. Impact Factors of Examples
igate the influence. Fig. 4 also depicts the impact graphs for response timeandcostof the NewsRequest service. The im- pact factor for response time is now influenced by the esti- mated ratio r:s on the XOR-split. Using the equations in Ta- ble 5 and both graphs in Fig. 4 cost and time impact factors can be calculated and are depicted in Table 6. Note that the average cost of NewsUpdateCP1 cannot directly be derived from the SLO (cf. Table 1) since it states0.50euro per item with a maximum price of 50 euro per day. The same holds for NewsUpdateCP2. Now, the company makes an estima- tion on the average value based on previous observations:
NewsUpdateCP1= 40and NewsUpdateCP2= 30. For the impact on response time for NewsRequest estimations are made on the XOR-split ratio r:s. Since RequestCP1 should respond on average faster than RequestCP2, ratio r:s is es- timated on 3:1. Recall that the agreed upon response times by CP1 and CP2 for Request are 3 and 4 ms. The impact factor is an absolute value, i.e., when an impact value of a service is 5 in Model A and 10 in Model B then the impact of that service on the composite service is really twice as big in Model B as Model A.
5. Monitoring
To manage composite services it is important for a com- pany to monitor and evaluate the dependency models. For example, identifying constant violations of an SLO by a provider may lead to ending collaboration with this part- ner. On the other hand, when the company can easily meet the agreed service level, it might be able to make a more competitive offer with a higher level of service. Especially, monitoring dependencies gives insight into the causes for under or over performance of an SLO, supporting decision making on service level changes. Combining this informa- tion with impact factors of each service and bilateral moni- toring information results in a complete picture of how the composite services are functioning. First, we describe how to abstract necessary data from event logs which are created for bilateral monitoring in Sect. 5.1. Subsequently, Sect. 5.2 discusses how to combine this information with the impact
factors and the identified dependencies.
5.1. Event Log Model
All data necessary to evaluate the dependency models are present in event logs. These are produced during message exchanges. The challenge is to abstractusefulinformation and tostructure it in a meaningful way. The focus of our monitoring approach is on the different SLOs of a compos- ite service. Therefore, we capture information concerning the SLO (e.g., timestamps to measure response times and payment information for cost calculations). In addition we capture data to correlate different messages. A more de- tailed discussion on how to structure Event Log Models can be found in [6]. To enable abstraction of event log data, we need to correlate the following information:
1. Messages exchanged between provider and customer during invocation of the composite service.
2. Services (and their messages) invoked by the compos- ite service, i.e., the services a composite service de- pends on. This is achieved by either matching identi- fiers (as available for example with a BPEL implemen- tation) or by doing semantic matching.
3. Instances of services belonging to one specific type of service (e.g., all instances of a premium account).
4. Grouping classes of services belonging to one busi- ness activity (e.g., all premium and normal account in- stances for service X).
5. Instances of services that are exchanged with the same business partner (e.g., all instances of services ex- changed with content provider A).
6. Composite services that reuse data from the same ser- vice. Again this information is correlated through identifiers or by semantic matching.
SLOs of one SLA can have different levels ofabstrac- tion. When one SLO is defined on a lower level (e.g. ev- ery invocation of a composite service has a certain response time) while another SLO is defined on a higher level (e.g.
all invocations of this composite service over a year have an average cost value of y) then both levels of abstraction are represented in the event log model. For easy represen- tation and implementation, we use sets and tuples. To meet the identified correlation criteria we structure our event log model according to the following definitions. For brevity we denote timestamps in relative ms instead of complete date and time notation.
Definition 1 (Message) A message x is represented as tu- ple (a,b,c,d) with time(x)= a, issuer(x)=b, recipient(x)=c, content(x)= d.
Definition 2 (Service) A service is represented as a tuple containing:
• The set of messages exchanged to execute the service
• The cost of the service
Definition 3 (Composite Service) A composite service in the event log model is represented as a tuple containing:
• The issuer of the composite service
• The type of service issued
• The cost of the service
• The set of messages exchanged with the issuer
• The set of service instances this composite service de- pends on
An example of one instance of NewsRequest by a cus- tomer in event log model notation is as follows.
Composite Service:
CS(id1)=
CustomerX, NewsRequest, 0.50,{M(id2),M(id3)},{S(id4), S(id5)} Services:
S(id4)= (M(id6), M(id7), 0.20) S(id5)= (M(id8), M(id9), 0.15) Messages:
M(id2)= (1.0, CustomerX, Company, ”Dutch politics”) M(id3)= (5.5, Company, CustomerX, ContentY) M(id6)= (2.0, Company, CP1, ”Dutch politics”) M(id7)= (4.2, CP1, Company, ContentY) M(id8)= (2.1, Company, CP2, ”Dutch politics”) M(id9)= (5.1, CP2, Company, ContentZ)
Here, composite service NewsRequest CS(id1) is issued by CustomerX for the cost of 0.50 euro. Between the com- pany and CustomerX two messages M(id2) and M(id3) were exchanged, and the two services S(id4) and S(id5) were used by the company to fulfill the composite service.
Both services S(id4) and S(id5) consist of two messages and cost 0.20 and 0.15 euro, respectively. Each message M(idX) consists of timestamp, issuer, recipient, and content of the message. In this case, the customer wants an update on Dutch politics. Both CP1 and CP2 deliver news items (ContentY and ContentZ). The company sends ContentY since this is the first to arrive (4.2 ms<5.1 ms).
5.2. Monitoring Dependencies
Analysis of dependencies between services during de- velopment phase (cf. Sect. 3), and analysis of impact these services have on the composition (cf. Sect. 4) are used to support monitoring composite services during runtime. The event log model, containing results of bilateral communi- cation, is compared with the SLOs. For example, if the SLO states that response time will be on average 3 ms, the achieved average response time can be easily calculated us- ing the timestamps. These bilateral results are combined
using the dependency models and impact analysis done at development phase. As a result not only bilateral SLOs are assessed but a complete picture on how the composite ser- vice, with the different SLAs, is functioning is provided.
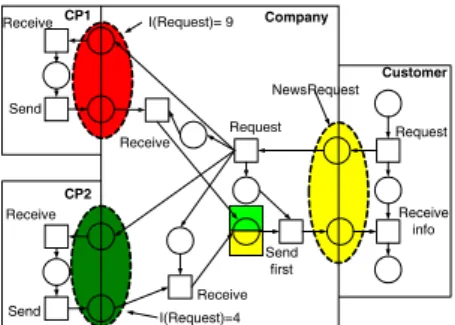
This combined result of development phase model anal- ysis and runtime event log data is graphically represented by coloringthe services in the dependency models (cf. Fig. 5).
A service is coloredgreenwhen the constraint of the SLO is met during runtime,yellowwhen the constraint is not met with a maximum negative deviation of 10%,redwhen the constraint is not met with a deviation greater than 10%, and dark green if the constraint was easily met (i.e., the con- straint could have been more than 10% tighter). Of course, these deviation percentages can be changed by the user. An important aspect of this evaluation is thetime frameas de- fined in the SLO. The SLO time frame of the composite ser- vice might differ from the time frame defined in the SLOs of the services it depends on. For example, the cost SLO for SubscribedNews with the customer evaluates an average of one monthwhile the time frame for the two services it de- pends on is a maximumper day(cf. Table 1). Since we aim at monitoring the composite service, we choose to evaluate each SLO with the time frame used in the composite ser- vice. This means that for evaluating the composite service some SLOs of services it depends on, have to be adapted.
In case of the cost SLO for SubscribedNews this means that the costs of UpdateNews services are gathered for the entire month. Now, the constraint of “not more than 40 euro per day” (cf. Table 1) is evaluated by checking whether there was no violation during that month.
Estimations are also evaluated. For example, the com- pany estimated that in 75% of all cases CP1 would be the first to deliver content to a request of data (cf. Sect. 4). This is represented as a ratio on the XOR-split. These estima- tions on constructs are evaluated based on combining infor- mation from different bilateral monitoring results. The re- sults are again graphically represented by coloring the con- structs.
As a last addition the impact factors, as calculated in Sect. 4, are considered. The result of these three parts (evaluating the SLOs, estimations on constructs, and im- pact factors) combined form a solid basis to evaluate the composite service. As an example, the response time SLO of NewsRequest is evaluated and graphically represented in (cf. Fig. 5). Using the event log model, it is calculated that the average response time to a NewsRequest is 5.2 ms, this is less than 10% under performance and therefore colored yellow. It turns out that ratio r:s (cf. Sect. 4) is not 3:1 but 4:1. CP1 was more often favored over CP2 than expected.
As a result the upper half of the XOR-join is green and the lower half yellow. The response time by CP1 was on av- erage 3.4 ms which is more than 10% worse than agreed upon. As a result the service colors red. CP2 responded
CP2
CP1 Company
Customer Receive
Request Request
Send first
Receive info Send
Receive
Receive
Send
Receive I(Request)= 9
I(Request)=4
NewsRequest
Figure 5. Coloring of a Dependency Model
on average in 3.6 ms which is more than 10% better than agreed. Therefore, the service colors dark green.
The result of our approach enables users to identify which services are performing good and which bad. In this case a possible cause of violating the response time SLO for NewsRequest is bad performance of CP1. Especially con- sidering that the impact factor of this service is more than twice as big as the impact factor of the other NewsRequest service (9 against 4). Also estimations on choices, repeti- tions, and reuse are evaluated. In this way, estimations in the dependency models can be compared to real life data, enabling decision support for managing composite services.
6. Related Work
An importantframework for specifying composite ser- vices is the WSLA framework by Keller et al. [12]. We use their structure and requirements on SLA definitions for our approach. Their framework enables the specification of SLAs which enables monitoring composite services al- though this is not treated explicitly. Another framework for specifying web services is the WSOL framework by Tosic et al. [15]. Unique in this approach is that it enables offering services inclassesrather than per instance. Tosic et al. also treat the dependencies between different services in [9].
Sahai et al. [14] aim at automated SLA monitoring by specifying SLAs and not only considering provider side guarantees but focus also on distributed monitoring, taking the client side into account. Barbon et al. [3] enable run- time monitoring while separating the business logic from the monitoring functionality. For each instance of a pro- cess a monitor is created. Unique in this approach is the ability to also monitor classes of instances, enabling ab- straction from an instance level. The smart monitoring ap- proach of Baresi et al. [4] implements the monitor itself as a service. There are three types of monitors available for different aspects of the system. Their approach is de- veloped to monitor specifically contracts with constraints.
In [5] Baresi et al. present an approach to dynamically
monitor BPEL processes by adding monitoring rules to the different processes. These rules are executed during run- time. Our approach does not require modifications to the process descriptions what might suit better to some applica- tion areas. An interesting approach in this direction is work by Mahbub et al. [13] who, as en exception, do consider the whole state of the system in their monitoring approach.
They aim at monitoring derivations of behavior of the sys- tem. The requirements for monitoring are specified in event calculus and evaluated with run-time data. Although many of above mentioned approaches do consider third parties and also allow abstraction of results for composite services, none of them addresses how to create this abstraction in de- tail. Problems like matching messages from different pro- cesses as in our SubscribedNews example where databases are used, are not considered.
Another research community analyzesroot causesin ser- vices. In responding approaches dependency models are used to find causes of violationswithin a company. Here, composite services are not considered but merely services the company is responsible for on its own. For example, Agarwall et al. [2] determine the cause of a problem by us- ing dependency graphs. Especially finding the cause of a problem when a service has an SLA with different metrics is here a challenging topic. Also Caswell et al. [8] use de- pendency models for managing internet services. Again, fo- cussing on finding internal causes for problems. In our work we identify causes of violations in other services rather than internally. Furthermore, our dependencies between differ- ent services are on the same level of abstraction while in root cause analysis one service is evaluated on different lev- els of abstraction.
7. Summary and Outlook
In this paper we describe our MoDe4SLA approach which combines analysis information on dependency re- lations between services, and their impact factor on the composite service during development phase with bilateral monitoring results during runtime. The result supports the company in managing its composite services for detection and coverage of SLA violations. More specifically, deci- sions on whether or not to change content provider, whether or not to change certain SLAs, and which SLAs should be reconsidered are supported by depicting dependencies be- tween services.
In the near future we plan to finalize the implementation and evaluation of our approach. Extensive testing on com- plex composite services is needed. Furthermore, we plan to extend our dependency based approach with handling com- plex SLAs where also dependenciesbetweenandwithindif- ferent SLOs occur. For example, SLAs where two different SLOs concern response time, or where one SLO concerns
not only response time but also cost.
References
[1] Workflow patterns. http://www.workflowpatterns.com.
[2] M. K. Agarwal, K. Appleby, M. Gupta, G. Kar, A. Neogi, and A. Sailer. Problem determination using dependency graphs and run-time behavior models. InDSOM, volume 3278, pages 171–182. Springer, 2004.
[3] F. Barbon, P. Traverso, M. Pistore, and M. Trainotti. Run- time monitoring of instances and classes of web service compositions. InICWS ’06: Proc. of the IEEE Int. Confer- ence on Web Services, pages 63–71, Washington, DC, USA, 2006. IEEE Computer Society.
[4] L. Baresi, C. Ghezzi, and S. Guinea. Smart monitors for composed services. InICSOC ’04: Proc. of the Int. Confer- ence on Service Oriented Computing, pages 193–202, New York, NY, USA, 2004.
[5] L. Baresi and S. Guinea. Towards dynamic monitoring of WS-BPEL processes. InICSOC, volume 3826, pages 269–
282. Springer-Verlag, 2005.
[6] L. Bodenstaff, A. Wombacher, and M. Reichert. On formal consistency between value and coordination models. Tech- nical Report TR-CTIT-07-91, Univ. of Twente.
[7] J. Cardoso, A. Sheth, J. Miller, J. Arnold, and K. Kochut.
Quality of service for workflows and web service processes.
Web Semantics: Science, Services and Agents on the World Wide Web, 1(3):281–308, 2004.
[8] D. Caswell and S. Ramanathan. Using service models for management of internet services.IEEE Journal on Selected Areas in Communications, 18(5):686–701, 2000.
[9] B. Esfandiari and V. Tosic. Towards a web service com- position management framework. InICWS ’05: Proc. of the IEEE Int. Conference on Web Services, pages 419–426, Washington, DC, USA, 2005. IEEE Computer Society.
[10] M. C. Jaeger, G. Rojec-Goldmann, and G. Muhl. QoS aggre- gation in web service compositions. InProc. of the Int. Con- ference on e-Technology, e-Commerce and e-Service, pages 181–185, Washington, DC, USA, 2005. IEEE Computer So- ciety.
[11] K. Jensen. Coloured Petri Nets. Basic Concepts, Analysis Methods and Practical Use. Springer, 1997. Three Volumes.
[12] A. Keller and H. Ludwig. The WSLA framework: Spec- ifying and monitoring service level agreements for web services. Journal of Network and Systems Management, 11(1):57–81, 2003.
[13] K. Mahbub and G. Spanoudakis. Run-time monitoring of requirements for systems composed of web-services: Ini- tial implementation and evaluation experience. InProc. of the Int. Conference on Web Services, pages 257–265. IEEE Computer Society, 2005.
[14] A. Sahai, V. Machiraju, M. Sayal, A. P. A. van Moorsel, and F. Casati. Automated SLA monitoring for web services. In DSOM ’02: Proc. of the 13th IFIP/IEEE Int. Workshop on Distributed Systems: Operations and Management, pages 28–41, London, UK, 2002. Springer-Verlag.
[15] V. Tosic, B. Pagurek, K. Patel, B. Esfandiari, and W. Ma.
Management applications of the web service offerings lan- guage (WSOL).Information Systems, 30(7):564–586, 2005.