MNF-bioc-401: Master Thesis
Fine-scale vertical distribution of zooplankton in the oxygen minimum zone off Peru
Submitted by:
Sahed Ahmed Palash Matriculation Number: 1113532 Master of Biological Oceanography
GEOMAR Helmholtz Centre of Ocean Research Kiel, Germany Supervisors:
1. Dr. Rainer Kiko Environmental Physiology
GEOMAR Helmholtz Centre of Ocean Research Kiel, Germany 2. Prof. Dr. Martin Wahl
Benthic Ecology
GEOMAR Helmholtz Centre of Ocean Research Kiel, Germany
Declaration of authorship
I hereby certify that this thesis is my work and no other than the declared references were used. This thesis has not been submitted in any other examination procedure. The printed version is consistent with the version provided on a digital data carrier.
--- Kiel, October 10, 2019
Acknowledgement
This work couldn't be done with the kind support from both my supervisor. Thanks to Dr. Rainer Kiko and Dr. Helena Hauss for being with me as a mentor and scientific guide during the sample processing, imaging, validation and coding and also teaching me the scientific way of doing the project and writing the thesis.
Special thanks to Helena Hauss for the sampling of the zooplankton and Rainer Kiko for his patience throughout this project. I would also like to thank Dr. Gerd Krahmann for the correction of multinet O2
measurement and Professor Dr. Martin Wahl for being my examiner and giving me his valuable time. Last but not least, thanks to my daughter Fiha for motivating me through her Pictography.
Abstract
In the modern ocean, waters with <20 µmol kg ¹ of dissolved oxygen are known as oxygen minimum zones⁻ (OMZs) and occupy ~1% of the global ocean. Zooplankton plays an important role in marine ecosystems, as a trophic link between primary producers and larger animals. Zooplankton is also an integral part of the biological carbon pump. Diel vertical migrations (DVM) between midwater depths at daytime and surface waters at nighttime is a unique process conducted by zooplankton in the ocean that impacts ecological interactions and nutrients cycles. Zooplankton DVM can be responsible for the transfer of a significant amount of carbon and nutrient from the surface to depth. Most available data on the vertical distribution of zooplankton rely on vertically stratified net samples with relatively thick integrated depth strata sampled.
Above the intense OMZ off Peru, the upper oxycline is viewed as the single most important barrier structuring the water column. Up to now, the fine-scale distribution of zooplankton relative to this barrier has not been resolved in detail. In the present study, I determined the fine-scale vertical distribution of zooplankton abundance and biomass and its correlation to O2. During the cruise, zooplankton was collected at eight stations in different O2 strata from the upper OMZ to the surface using a towed Hydrobios multinet, with three nets sampling the oxycline (which was often only a few meters thick. At the same stations, vertical hauls with fixed depth intervals (1000-600-300-200-100-0) to a maximum of 1000 m depth were conducted.
Zooplankton >500 µm from the trawl hauls and >1000 µm from the vertical hauls were used for the data analysis. The oxycline (Zoxy) and thermocline (Ztherm) in the OMZ off Peru ranged between ~20-50 m and were shallower at onshore compared to offshore stations indication of higher biomass distribution but similar abundance. In terms of abundance, calanoida and eucalanidae copepods are the most dominant organisms in the system. However, both in terms of biomass and in migrating biomass, euphausiacea (in waters deeper than 250m) and the endemic P. monodon (on the shelf) are the most important contributors to nighttime biomass in surface waters. Differences in zooplankton day/night abundances and biomass in different oxygen bins indicate DVM from the surface to OMZ and vice-versa with the complete absence of euphausiacea and P. monodon in the surface water during the day. During DVM, calanoida and eucalanidae show accumulation in the water column just on top of the oxycline where dissolved oxygen concentration ranges from 0-20 µmol kg ¹ during the day. During the night, ⁻ P. monodon along with calanoida and eucalanidae show accumulation in the more oxygenated near-surface bins. The biomass distribution during the night and day in different O2 bins have similar trends of having large size copepods down towards oxycline during the day and other-way-around at night (ANOVA, p < 0.017 for calanoida, p < 0.01 for eucalanidae). The nighttime distribution of euphausiacea is not restricted to the oxygenated surface water (ANOVA, p < 0.00000001) but reached into hypoxic conditions in the oxycline, indicating that the oxycline may be a hot spot of bacterial activity where anoxic metabolic pathways are periodically supplied with zooplankton excretion and defecation products. Variability in catch efficiency and zooplankton distribution between vertical and trawl sampling is providing us an opportunity to determine the best technique from these two. Last but not the least, a study needs to carry for the increasing taxonomic resolution along with fine-tuning of the imaging instrument (capturing 4D zooplankton community dynamics) to determine the exact species and their depth preferences in terms of oxygen concentrations.
Keywords: Eastern Tropical South Pacific (ETSP), Oxygen Minimum Zones, Zooplankton Community, Diel Vertical Migration (DVM) and Biomass Distribution.
List of figures
1. Location of major upwelling regions page 7
2. Diel vertical migration and aggregation page 10
3. Sampling sites in the OMZ off Peru page 11
4. Online multinet measurement page 12
5. Hydrobios multinet midi page 12
6. Sampling preparation and handling page 13
7. Zooplankton learning set page 15
8. Predicted zooplankton categories page 16
9. O2 profile comparison before calibration page 18
10. O2 profile comparison after calibration page 20
11. Hydrographic profiles from towed multinet page 21
12. Hydrographic profile from vertical multinet page 23
13. Integrated abundance of zooplankton page 24
14. Abundance of zooplankton in O2 bin page 26
15. Abundance of large zooplankton in O2 bin page 27
16. Abundance of medium zooplankton in O2 bin page 28
17. Offshore distribution of zooplankton taxa page 29
18. Onshore distribution of zooplankton taxa page 30
19. Comparison between trawl and vertical catch (calanoida and eucalanidae) page 31 20. Comparison between trawl and vertical catch (calanoida and eucalanidae) page 32
21. Spatial distribution of zooplankton biomass page 33
22. Biomass distribution of different zooplankton groups in O2 bin page 35 23. Large size zooplankton biomass distribution in O2 bin page 36 24. Medium size zooplankton biomass distribution in O2 bin page 37
List appendix
1. Metadata from trawl hauls page 44
2. Metadata from vertical hauls page 46
3. Correction coefficients for multinet O2 page 47
4. Script for ANOVA test (calanoida) page 50
5. Script for ANOVA test (eucalanidae) page 52
6. Script for ANOVA test (euphausiacea) page 54
7. Script for ANOVA test (pleuroncodes) page 56
Contents
1. Introduction page 5
2. Research questions and hypothesis page 10
3. Materials and methods page 11
4. Results page 18
5. Discussion and conclusion page 38
6. References page 41
1. Introduction:
In the Global Ocean, the Eastern Boundary Upwelling System (EBUS) is a unique phenomenon where the cold and nutrient-rich deep water is upwelled to the surface. Major coastal upwelling ecosystems are situated in the EBUS of the Atlantic and Pacific (Fig. 1). Upwelling results in a high primary production, which translates into the biomass of primary consumers and fish (Carr et al. 2002; Messié et al. 2014). While the EBUS areas cover only 0.2 % of the Global Ocean, they are responsible for just over 50% of the global fish catch (Paulmier et al. 2009). The Peruvian marine ecosystem located within the northern segment of the Humboldt system is unequaled in sheer tonnage of fishery landings and furthermore, it has been named the
"heavyweight champion of the world" in terms of producing fish biomass (Bakun et al. 2008). So, what is special about the Peruvian coast that allows for this kind of upwelling and productivity? It has been found that the steady winds that blow equatorward drive strong wind-induced coastal upwelling. Below the upwelling zone, the upwelling-favorable wind flow bisects from the coast and turns off the shore to accelerate into the westward trade wind flow that characterizes the near-equatorial band of the Pacific Ocean (Paulik, 1981).
Fig.
1
Location (shaded rectangle) of major regional eastern upwelling systems. Darker-shaded rectangle denote Peruvian and northern Benguela near equatorial subsystems of the respective Humboldt current and Benguela current regional upwelling system (Bakun et
al. 2008).
The EBUS off Peru is situated at the Eastern Tropical South Pacific (ETSP). The ETSP is characterized by a permanent midwater Oxygen Minimum Zone (OMZ) (Criales-Hernández et al. 2008). OMZs are considered refuge for the many species who enter the zone to avoid predation or competition. Importantly, these species are adapted to such a low O2 concentration (Levin, 2002, Kiko et al. 2016; Kiko et al. 2015) in the OMZs. As the Global Ocean oxygen content has steadily declined due to the effects of climate change, the oxygen in our oceans has become a critical research topic in oceanography within recent years (Karstensen J et al.
consumes O2 under the highly productive surface water, on the other hand, natural upwelling process speed- up the primary production leading to enhance the organic matter export to the underlying oxygen-depleted water (Liu et al. 2007). The upper boundary of the OMZ, the oxycline, represents the most significant ecological barrier for pelagic organisms (Chavez et al. 2010), and oxygen appeared to be the most important environmental factor determining the abundance and distribution of the zooplankton community in the Peruvian OMZs (Judkins, 1980). Off the coast of Chile, the upper oxycline is located 100 m or deeper with O2 concentrations around 22 µmol kg ¹ (Helly et al. 2004). OMZs play an essential role in the global⁻ nitrogen cycle where many different chemical species and different bacterial processes intervene. At the oxycline layer nitrification transforms NH4 to NO3 under the oxic condition (Paulmier et al. 2009);⁺ ⁻ however, OMZs are more related to denitrification, a bacterial process occurring only in the O2 depleted water bodies in the Global Ocean (Codispoti et al. 1985).
The Diel Vertical Migration (DVM) is one of the most important constituents in the life of many zooplankton. DVM of zooplankton in the marine ecosystem is a cycle of displacement from the food-rich euphotic layers where most of the feeding activities take place during the nighttime to the darker and deeper layer during the day time to avoid visual predation and conserve energy. This pattern of ascent at sunset and descent at sunrise is common for many zooplankton species throughout the Global Ocean (Antezana, 2009).
Many zooplankton species have photoreceptors sensitive to the spectral region at the dawn and dusk (Warrant et al. 2004). Therefore, the main cue for migration timing is a rapid change in the irradiance level (Cohen et al. 2009). There are many primary advantages of Diel Vertical Migration for the zooplankton. One advantage for the zooplankton is forage at different depth by scheduling foraging bouts at the surface with the high concentration of food when visual predation is inhibited during twilight and night (Lampert, 2006;
Hays et al. 1997). DVM also influences the metabolism of migrating species as they encounter lower temperatures and reduced oxygen at depth (Lampert, 2006), leading to suppression of respiration and ammonium excretion (Kiko et al. 2016).
There is a long history of DVM studies carried out almost everywhere around the world. Among them, many have taken place to quantify the role of DVM in biogeochemical cycling (Longhurst et al., 1988; Buesseler et al. 2009). However, DVM is rarely considered in global biogeochemical models (Aumont et al.2018). That the organism feed at the surface and metabolize at depth means that DVM also affects the transport and cycling of nutrients, carbon, and oxygen in the ocean (Bianchi et al. 2016). Zooplankton-mediated active transport of organic matter typically ranges between 10-50% of the local sinking flux of organic particles (Dam, 1998; Hidaka et al. 2002). The ocean depth plays a huge role in determining the contribution of DVM in biogeochemical cycles as the rate of ocean ventilation decreases rapidly with increasing depth (Bianchi et al. 2013). The thermocline and oxycline off Peru divide the upper 30 m into distinct copepod and non- copepod faunal zones (Smith et al. 1980). The larvae, juveniles and adults of Euphausia mucronata were found mostly in the upper 50 m layers during night hours, migrating to deeper layers at sunrise. Most of the copepods are found in the upper 40 m of the water column during day and night (Smith et al. 1980). The OMZ layer has created a lower boundary for the distribution of many organisms but the limitation to the upper 20 m also maintains the zooplankton community within surface currents which may vary to a certain extent and have an influence on the onshore-offshore dimension (Brink et al. 2008).
In this study, I will examine the zooplankton distribution and migratory pattern in the shelf-water off Peru.
This area was specifically chosen as the shallow oxygen minimum layer potentially limit the available vertical amplitudes of migratory species. The Eastern Equatorial Pacific and Humboldt Current Ecosystem (HCE) and its OMZs limits the vertical extent of most migratory zooplankton but the endemic euphausiacea species Euphausia mucronata is a notable exception (Brinton, 1979). The vertical movement and also the horizontal distribution of the whole population needs to be quantified to examine their role in the transport of energy and matter in this upwelling region. Many studies determined vertical distribution and DVM in marine zooplankton (Hays et al. 1997), relating them to the distribution of oxygen (Criales-Hernández et al.
2008, Bianchi et al. 2013) or even tested the effect of abiotic factors on the migration of zooplankton (Cohen et al. 2009), but none has determined the fine-scale distribution within the oxycline, which may be of paramount importance because of the very close proximity of zooplankton-derived organic matter (feces) and inorganic nitrogen compounds (e.g. ammonium) and the anoxic habitat where certain microbial processes can occur. As the oxycline is only about a few meters thick, we specifically used a towed
Hydrobios Multinet which online transmission of conductivity, temperature, density, pressure, volume, flow ratio and oxygen in the water. The Opening and closing of the nets were conducted at preselected oxygen concentrations. Our main preference was to measure all important parameters and zooplankton community in the water column on top of the oxycline at different depth intervals.
2. Research questions and hypothesis:
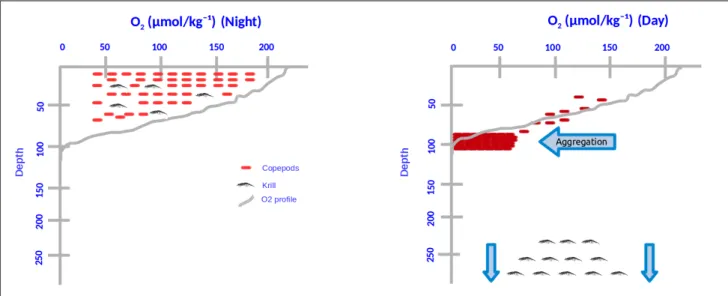
The main focus of this study is on the distribution and migration behavior of zooplankton to environmental variables. Because in the process of DVM, I expect that most copepods show an aggregation (Fig. 2) at the oxycline during the day as they are unable to migrate further down to the anoxic zone due to physiological constraints but still attempt to move away from the brightly lit surface. On the other hand, more tolerant species like Euphausia mucronata go down to the OMZ core seemingly to avoid predation (Antezana, 2009) and can survive 12 hours under anoxia (Boyd CM et al. 1991). For these, it will be more interesting to determine the boundary conditions from diurnal, spatial and size fraction distribution and biomass of the major zooplankton taxa. Alternatively, it is also hypothesized that the scattered aggregation of copepods and other major taxa at different depth intervals depending on physiological preference and have different distribution and biomass depending on diurnal, spatial and size fraction distribution and biomass. To find the answer of the questions on top I have set the research questions for this study and they are as follows:
A. Are there any differences in biomass distribution between coastal and offshore stations along the coast of Peru between 10 and 16°S?
B. Is there a zooplankton accumulation during the day at the upper oxycline in the OMZ off Peru?
C. How are zooplankton groups distributed relative to the upper oxycline at day and night at different stations off Peru?
D. What are the oxygen thresholds for different zooplankton groups at day and night?
Fig. 2 DVM and hypothesized aggregation at the oxycline
3. Materials and Methods:
3.1 Sampling:
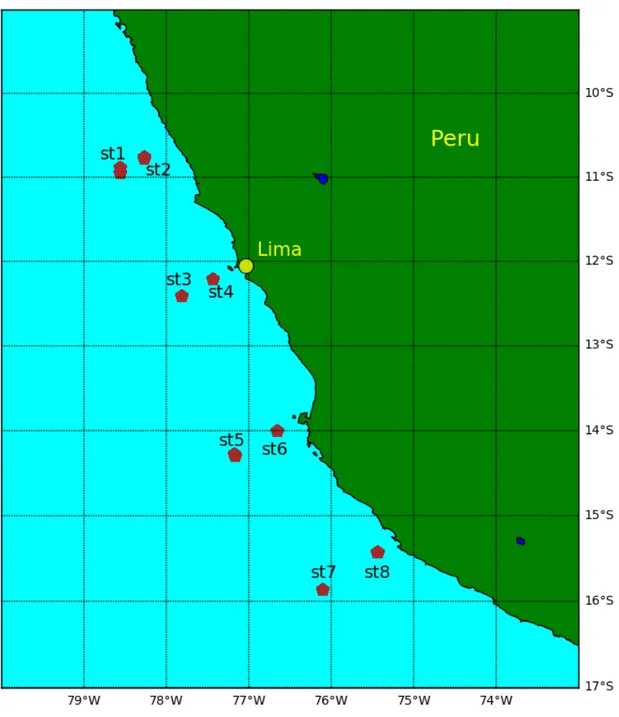
During a process study cruise off Peru in June 2017 with research vessel Meteor (cruise M138) the upper oxycline was specifically sampled with stratified plankton net hauls during day and night. All samples were preserved in 4% borax-buffered formaldehyde in seawater solution and later transported to the lab at GEOMAR Helmholtz Centre for Ocean Research in Kiel, Germany for further analysis. Our study will focus only on the samples which were collected from eight different sampling stations on and off-shore of Lima, Peru (Fig. 3). Meta and CTD data were also collected during the cruise.
Fig. 3 Multinet sampling sites during M138 off Peru
3.1.1 Sampling strategy:
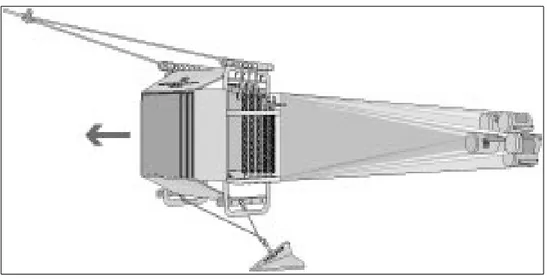
On-board of RV Meteor a Hydrobios Multinet was deployed the Hydrobios Multinet (Fig. 5) at eight sampling sites. The multinet consists of five nets with a mesh size of 200 µm and also has a CTD-O2 sensor pack to measure different parameters online. Depending on the online measurement of dissolved O2
concentration (Fig. 4), each net was opened and closed. Net 1 was used for the base of the oxycline (less than approximately 10 µmol kg ¹, while net 2, 3 and 4 were used to resolve the gradient, which was often⁻ only a few meters thick. Since the last net (net 5) cannot be closed, this net was used to fully cover the oxygenated mixed layer. Because the oxycline is only a few meters thick, the net was towed over the side at a ship speed of two to three knots and hauled slowly with a winch speed of 0.2 m s-1 or less in the oxycline.
Fig. 4 Online measurement of parameters. The blue line is oxygen concentration, red line temperature, black line salinity, green line sampling volume per net and yellow line active (open) net.
Fig. 5 Hydrobios multinet midi in towing mode with V-fin and soft cod-ends attached
3.1.2 Sample preservation and handling:
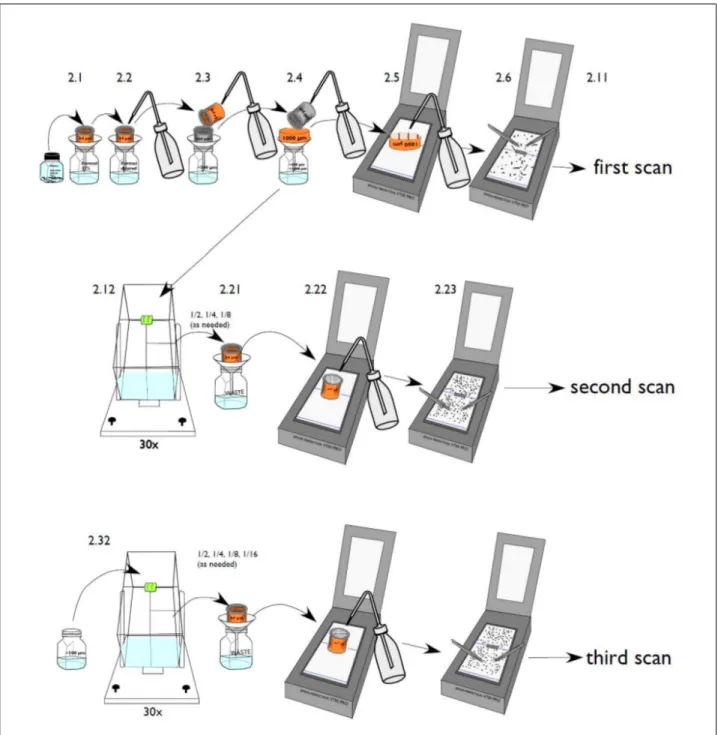
After collection, organisms were preserved in formaldehyde and shipped to GEOMAR in Kiel. Once all the samples arrived in Kiel, they were rinsed using artificial seawater (35 psu). The samples were separated into three size fractions (large >1000 µm, medium <1000 µm > 500 µm and small <500 µm) using the sieve with the respective mesh size and a Motoda zooplankton splitter for very dense samples to be able to distribute them on the scanner without items touching each other (Fig. 6). It was aimed to have approximately 1000 objects on the scanning plate.
Fig. 6 Schematic presentation of sample preparation and handling for scanning (taken from Christiansen, 2013)
3.1.3 Sample Scanning:
Once the samples are ready to be scanned, a desktop-scanner EPSON PERFECTION V750 PRO and scan- chamber constructed of a glass-plate with a plastic frame were used to scan all the samples. All the large size organisms were collected into the respective sieve (2.4 in fig. 6) and then poured onto the glass-plate using a water bottle (2.5 in fig. 6). For scanning software, the application Epson Scan for Epson Perfection v700/v750 was used.
3.2 Image Processing:
3.2.1 Vignetting:
The raw scan-images from the desktop-scanner were processed with the ZooProcess plug-in for the program ImageJ. This resulted in a single image for each organism with measurements of many different parameters (e.g. area, length, width, grey-level, ferret-diameter etc.)
3.2.2 Creating a Learning set:
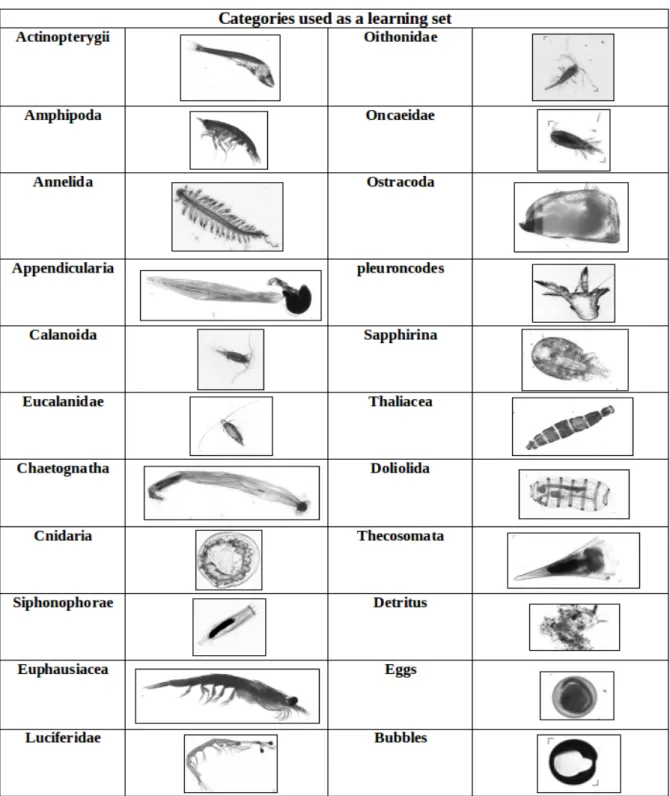
All kinds of objects that are in the samples should have a corresponding category in the learning set (Gorsky et al. 2010). To perform the automatic sorting of the vignettes, a learning set of different zooplankton categories was created. The list (Fig. 7) is considered to be relevant to analyze because they cover certain objects from the samples.
Fig. 7 Zooplankton categories used as a learning set in Ecotaxa
3.2.3 Prediction and manual validation:
Once all the vignettes were created, they were uploaded to ECOTAXA, a web-based application (https://ecotaxa.obs-vlfr.fr/login) for collaborative sorting of large plankton image datasets. First, the large size fraction and later the medium one was uploaded. When the prediction was performed by Ecotaxa based on the learning set, all the vignettes were transferred automatically into different categories (Fig. 8). I have manually checked and validated all the vignettes according to relevant categories.
Fig. 8 Predicted browser view of Ecotaxa (predicted images in the eucalanidae category (source:https://ecotaxa.obsvlfr.fr)
4. Data Collection:
All the CTD files, vertical and towed multinet files were collected from the cruise. Temperature, salinity and dissolved oxygen from CTD files were analyzed. The geographical position, pressure, net, volume, flow, temperature, conductivity, salinity, density and dissolved oxygen concentrations data ware derived from both vertical and towed multinet files. Both the CTD and multinet files are a plain text document. All zooplankton counting data files of the large and medium size fraction were imported separately from Ecotaxa as tab separated value (TSV) document and later they were converted to comma separated value (CSV) document for the flexibility of analysis.
5. Data Analysis:
I have used the Python Programming language and the libraries Numpy, Pandas, Matplotlib, and basemap for data analysis. Initially, all multinet files were concatenated with correspondent CTD data files (Seabird CTD cast at the same station nearest in time to the multinet deployment) to calibrate the O2 measurement from the multinet CTD. This was necessary because the multinet lacks Niskin bottles for a direct calibration. To overcome this problem, multinet CTD files and Seabird CTD data files were paired on density. During calibration, it became evident that the Hydrobios sensor has a slower response time than the Seabird CTD.
The calculation scripts for determining the coefficient is in Appendix IX. Once O2 profiles were calibrated I have calculated the mean O2 concentration at each mean depth for all nets and created plots for each sampling station day and night. Depth was calculated from pressure using the “Seawater” python library. I have calculated the abundance of different zooplankton groups in each net and plot them against the mean
depth and mean oxygen to determine the thresholds. Later, biomass calculation was conducted using the image related measurement info from the ecotaxa output file and mathematical equations from literature (Lehette & Hernandez-Leon 2011; Gorsky et al. 2010). All python scripts regarding data analysis can be found in https://github.com/sapgeomar/master-thesis.git.
6. Statistical Test:
The biomass data of four zooplankton taxa were tested against three different parameters (oxygen bin, onshore and offshore, day and night) to see how significantly different they are in their spectrum and in between them as well. A multi-factorial ANOVA was performed followed by the Tukeyś HSD test to have more in detail of interactions inside the parameters. All the test was performed using R programming language and the scripts in Appendix IV-VII. The results from the multi-factorial ANOVA test are in the following table.
Variables Df Sum Sq Mean F value Pr(>F)
# Calanoida
Oxygen bins 4 1576.0 394.0 4.1 0.005 **
Onshore and offshore 1 49.5 49.4 0.5 0.475 Day and night 1 583.2 583.1 6.0 0.016 * Oxygen bins*Onshore and Offshore 4 289.6 72.4 0.7 0.558
Oxygen bins*Day and night 4 963.5 240.8 2.5 0.0510 .
Onshore and Offshore*Day and night 1 170.5 170.5 1.7 0.187 Oxygen bins*Onshore and offshore**Day and night 4 578.1 144.5 1.5 0.211586
# Eucalanidae
Oxygen bins 4 181.4 45.3 0.4 0.773 Onshore and offshore 1 83.2 83.2 0.8 0.368 Day and night 1 128.0 127.9 1.2 0.265 Oxygen bins*Onshore and Offshore 4 1065.9 266.4 2.6 0.043*
Oxygen bins*Day and night 4 477.8 119.4 1.1 0.329 Onshore and Offshore*Day and night 1 38.0 38.0 0.3 0.542 Oxygen bins*Onshore and offshore**Day and night 4 394.3 98.5 0.9 0.429
# Euphausiacea
Oxygen bins 4 138857 3471 0.6 0.646 Onshore and offshore 1 596891 5968 10.7 0.001 **
Day and night 1 2073869 2073 37.3 8.42e-08 ***
Oxygen bins*Onshore and Offshore 4 126084 3152 0.5 0.686 Oxygen bins*Day and night 4 371148 9278 1.6 0.168 Onshore and Offshore*Day and night 1 821397 8213 14.7 0.0002 ***
Oxygen bins*Onshore and offshore**Day and night 4 260972 6524 1.1 0.331
# Pleuroncodes
Oxygen bins 4 77001 1925 0.7 0.533 Onshore and offshore 1 44490 4449 1.8 0.180 Day and night 1 85796 8579 3.5 0.064 Oxygen bins*Onshore and Offshore 4 64409 1610 0.6 0.619 Oxygen bins*Day and night 4 87675 2191 0.9 0.467 Onshore and Offshore*Day and night 1 98502 9850 4.0 0.048 * Oxygen bins*Onshore and offshore**Day and night 4 33132 8283 0.3 0.848
4. Results:
4.1.1 comparison of the dissolved oxygen concentration from multinets and CTD:
Fig. 9 O2 profile comparison between vertical multinet and CTD before and aftercalibration in all the nighttime stations between 11 and 16°S.
Before generating the trawl multinets profile, a calibration technique was needed because the oxygen sensor in the hydrobios multinet instrument (Fig. 5) had a slower response in terms of temporal intervals than the CTD sensors in the cruise. The time delay was about 4 seconds to the temperature, salinity and pressure measurements of the multinet CTD whereas the oxygen off Peru is zero often but the multinet measurement showed a value of about 10 µmol kg ¹ at levels where the cruise CTD showed zero, therefore there was an⁻ offset too. This was always the case as it was the sensor's response time. These means that after a step change in oxygen 90% of the step was reached after 5 seconds and for comparison, the CTD's sensor had T63 of 2-5s (depending on temperature) so that was comparable. This was comparable to the CTD and then had to determine and apply the calibration coefficients. The calibration technique could be generated based on the datasets from trawl multinets and compared with cruise CTD to see the coincide. But this process could not be fully trusted because trawl multinets were towed with spatial and respective depth intervals which was different than cruise CTD for each station. On the other hand, vertical multinets were deployed along with the cruise CTD which very much comparable for calibration technique which we can trust and this is why the vertical multinets were used for the calibration technique to get the precise coincide with CTD profile. Uncalibrated profile comparison (Fig. 9 and 10) between vertical multinets (red line) and CTD (blue line) did exposed no coincide towards each other (day and night time hauls). To overcome this problem it was much more efficient to compare at the same density instead of pressure. So, the density for the CTD data were calculated and plotted salinity against density for both systems. The salinities of the Hydrobios system were too high and then subtracted 0.06 PSU and recalculated the hydrobios densities and plotted again. Once had a decent salinity and thus density, plotted oxygen against density the same way. The oxygen of the hydrobios system was in general 10 umol kg ¹ too high. Later, moved oxygen backward in time by 3-⁻ 4 seconds In the regular CTD processing so that it matched T and S in time. Then automatically up and down agreed much better. Considering cruise CTD measurement as the base, O2 measurement was calibrated from vertical multinets (Fig. 9 and 10) based on the process and calibration coefficient (Appendix X). Once calibrated, day and nighttime profiles from vertical multinet (green line) were compared with the corresponding cruise CTD (blue line) which was far better than the uncalibrated and precisely coincide with each other. After all, due to internal waves, 100% coincide was not expected because measurements on the same pressure even if the profiles were taken only minutes apart from each other internal waves had shift everything up and down significantly.
Fig. 10 O2 profile comparison between vertical multinet and CTD before and aftercalibration in all the daytime stations between 11 and 16°S.
4.1.2. Hydrographical conditions at the sampling stations (corrected data from vertical multinet):
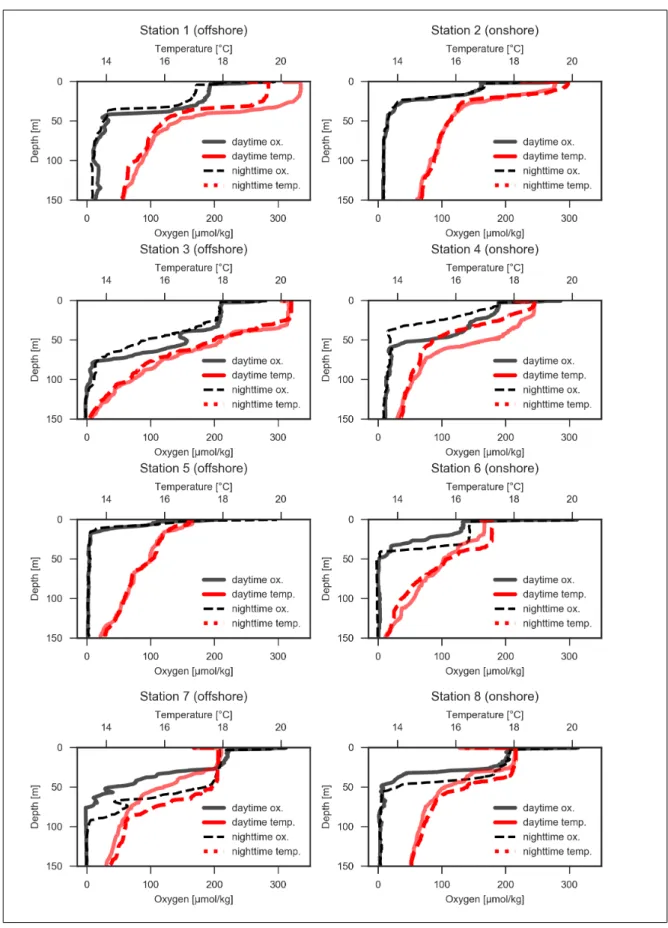
Fig. 11 Hydrographical profiles (temperature and oxygen from vertical multinet) during the day and night in all the stations between
The sampling depth for vertical hauls was ~1000 meter but I have truncated it to 150 meters to ha d a better comparison with the towed hauls (Fig. 11). Among all the station, st 1,2,5,6, and 8 had a shallow cline whereas station 3,4 and 7 were the deepest. Dissolved oxygen concentrations ranged from 120 to 300 µmol kg ¹. Station 8 had the highest dissolved oxygen concentration at the ocean surface and station 5 had the⁻ lowest. The temperature ranged from 17-21°C in all the stations between 11 to 16°S. In the ocean surface at station 1 had the highest temperature and station 5 had the lowest. All the onshore stations had a shallow oxycline (Zoxy) and thermocline (Ztherm) except station 4 at 12°S. On the other hand, all the offshore stations had a deep oxycline (Zoxy) and thermocline (Ztherm) except station 3 at 12°S.
4.1.3. Hydrographical conditions at the sampling stations (data from towed multinet after O2
calibration):
The calibration technique was also applied to the towed and vertical multinets as well to had the precise measurement. The depth intervals during the sampling time in all the eight stations were chosen in terms of oxycline depth between 11 to 16°S and therefore the maximum depth sampled varied between a maximum of 160 m and a minimum of 43 m (Fig. 12). The temperature in the surface water of the ocean was warmer in the northern stations than the southern ones, with approximately 18 to 20.5°C at stations 1-4 (mean 19.3°C) and approximately 17 to 18°C at stations 5-8 (mean 17.5°C), respectively. Surface oxygen values were around or more than 200 µmol kg ¹ at all stations except at 12°S onshore station, At 14°S the⁻ thermocline/oxycline was shallowest with approximately 50 m and 55 m at S6 (onshore) and S5 (offshore), respectively. Day and night profiles generally followed the same pattern, but there was a slight difference in the location and steepness of the oxygen and temperature gradients between the day and night sampling at stations 3, 4, 5, and 8.
The dissolved oxygen concentration at the surface water was highest at S3 and lowest at S4. In the OMZ core, At the oxycline, a dissolved oxygen concentration reached 0 µmol kg ¹ at all stations except 2 and 4.⁻ Sea surface temperature was highest at stations 1, 2 and 3 and lowest at 5 and 6. The temperature was changing rapidly with depth at the stations that show a shallow thermocline. The oxycline was shallower in stations 2 and 6. The oxycline (Zoxy) and thermocline (Ztherm) in the onshore stations were very shallow around 50 m meter depth except for S8 where it was at 100-meter depth. At the offshore stations, Zoxy and Ztherm
were much deeper compared to the onshore stations. In most of the offshore stations, it was found at 100- meter depth but at station 5, the Zoxy and Ztherm were at 50 m depth.
4. 2. Community Composition:
Fig. 13 Integrated abundance (large and medium combined) of calanoida (Cal.), eucalanidae (Eucal.), euphausiacea (Eupha.) and P.
monodon (Pleu.) over all nets in the surface layer of Peru. The maximum sampling depth as in Fig. 12. Blue and orange represents day and nighttime abundance.
Zooplankton composition in the upper mixed layer was dominated by crustaceans which were mostly copepods (calanoida, eucalanidae), euphausiacea and P. monodon (Fig. 13). For simplicity, I had restricted the analyses to those groups dominant (both numerically and biomass-wise) were copepods, euphausiacea and P. monodon. The taxa composition of zooplankton were similar among the sampling sites except a few.
Both at day and night, calanoids were dominant abundance-wise, with ~10000 to 76000 individual m ²⁻ followed by eucalanidae (~120 to 10000 individual m ²) , euphausiacea (~500 to 3344) individuals m ³) and⁻ ⁻ only a few P. monodon. But during the day these numbers were changing among the taxa where calanoida ranged from ~1300 to 100000 individuals m ² followed by eucalanidae (~100-7500 individuals m ²),⁻ ⁻ euphausiacea (~10-944 individuals m ²), euphausiacea (~0-85 individuals m ²). The daytime abundances of⁻ ⁻ calanoida were higher than the nighttime in most of the stations except station 3, 7 and 8. But eucalanidae did not show huge variability in diurnal distribution though their numbers were very low compared to calanoida. But the number of euphausiacea was on average two-fold higher during the night than in the daytime. P. monodon had higher abundance during the day. Offshore stations were rich in zooplankton numbers compared to the onshore except station number 8 where the Zoxy and Ztherm were much deeper than the other onshore stations. P. monodon was found to be the least abundant in numbers in all the offshore stations. Calanoida and euphausiacea were the groups with much more variability in terms of their number in all the stations.
4. 3. Zooplankton community in different oxygen concentration:
4.3.1 Night and daytime bins:
I had grouped the oxygen concentrations based on mean of the respective net into different bins ranging from 0-10 (bin 1), 10-20 (bin 2), 20-50 (bin 3), 50-150 (bin 4) and 150-250 (bin 5) µmol kg ¹ and compared the⁻ relative day and night abundance in these bins across all stations (Fig. 14). Calanoida and eucalanidae (large and medium size combined) were the most dominant taxa in the system depending on oxycline and thermoclines throughout the water column. During the night, calanoida were well distributed in higher bins ranged (median) from 500 to 520 individual m ³. Whereas the abundance was low in the lower oxygen bins⁻ (oxygen concentration 0-10 µmol kg ¹) during the night but during the day it was 120 individual m ³.⁻ ⁻ Calanoida abundance in bin 3 during the daytime was higher than the nighttime by 500 individual m ³.⁻ Similarly, eucalanidae abundance was higher in the higher bin during the nighttime with a median value of 42 individual m ³ in bin 5 followed by bin 2 with ⁻ a median of 25 individual m ³ respectively. Bin 4 has the⁻ median of 10 individual m ³. There was almost nothing in bin 1 seems like these ⁻ were not the right oxygen bins for the eucalanidae during the nighttime. On the other hand, some of them preferred lower bins which were almost empty during the nighttime. Most accumulation during the daytime was in bin 3 (dissolved oxygen concentration 20-50 µmol kg ¹) which was even less than 10 individual m ³ during the daytime.⁻ ⁻ During the night the abundance of P. monodon was high in the lower bins ranges between 0-5 individual m ³ and continuously decrease with higher bins where at bin 5 it ranged between only 0-1 individual m ³.⁻ ⁻ But during the day its completely other-way-around where all the bins were empty except bin 1 with few.
The numbers of euphausiacea in different bins during the night were ranged between 0 to 90 individual m ³. During the night the euphausiacea were in all bins mostly in bin 5 around 15 to 85 individual m ³. All⁻ ⁻ the higher bins had a similar median around ~ 20 individual m ³ followed by bin 1 with 2 and bin 2 with 18⁻ individual m ³. Euphausiacea during the night seemed highly abundant in all the bins but bin 5 the most. The⁻ conventional diel vertical migration below the oxycline by the euphausiacea left all the bins almost empty during the day.
Fig. 14 Abundance of calanoida, eucalanidae, P. monodon and euphausiacea over different O2 bins from the trawl hauls between 11 to 16°S. In the boxes, the horizontal middle line is the median, lower ending of the box is the 1st quartile and upper ending of the box is the 3rd quartile upper horizontal like of box is the maximum value and lower horizontal line is the minimum value. Each black dot is
the observed value and black dots out of boxes are the outliers.
4.3.2 Large and medium size organism in the oxygen bins:
Large calanoida (> 1000 µm) were well distributed in all the bins ranges between 0-18 individual m ³ (Fig.⁻ 15) but they were well short in number in the lower bins during the day but high in bin 3,4 and 5 ranges between 0-30 individual m ³. Eucalanidae distribution was similar in all the bins during night and daytime⁻ with a range from 0 to 60 individual m ³. Besides, the distribution of ⁻ P. monodon was still as same as the overall distribution. During the night, the large size euphausiacea was almost equally distributed with a median of 20 individual m ³ and almost nothing during the day. ⁻
Medium size >500 µm calanoida were super high in numbers (Fig. 16) than the large size fraction but the distribution pattern was similar with a range from 0-1500 individual m ³ during the night and 0-1900⁻ individual m ³ during the day. Eucalanidae were distributed in all the bins during the day where lower bin 1⁻ (0-10 µmol kg ¹) was almost empty and the rest of the bins ranges between 120 to 1500 individual m ³. But⁻ ⁻ during the day lower bin 1 was higher than the night time with a huge accumulation ranges between 0-100 individual m ³. In other bins, this distribution was almost like similar ranges from 0 to 100 individual m ³.⁻ ⁻ P. monodon was empty in this size fraction due to no catch. euphausiacea were more abundant in higher bins during the night with a range of 0-80 individual m ³. In contrast to nighttime, they were more abundant (0-⁻ 70 individual m ³) in the water column with dissolved oxygen concentration from 50-150 µmol kg ¹.⁻ ⁻
Fig. 16 Abundance of medium size (>500<1000 µm) calanoida, eucalanidae, P. monodon and euphausiacea over different O2 bin from the trawl hauls.
4.3.3 Spatial distribution of organisms in the oxygen bins:
Fig. 17 The offshore distribution of calanoida, eucalanidae, P. monodon and euphausiacea over different O2 bin from the trawl hauls.
The distribution pattern of calanoida in the oxygen bins during the nighttime in the offshore stations has little variability. Most accumulation was in bin 2 which has low oxygen concentrations (10-20 µmol kg ¹)⁻ followed by bin 5 and 4 within a range between 100-1250 individual m ³ (Fig. 17). But during the day they⁻
super low in numbers with a range from 0-20 and 5-25 individual m ³ respectively. But during the daytime,⁻ these numbers had increased significantly in bin 1 and 5 ranges between 5-110 and 20-130 individual m ³.⁻ Most accumulation during the daytime was in bin 3. P. monodon number was high in bin 1 during the nighttime and leaving other bins almost empty but during the daytime bin 3 and 4 were having accumulation.
euphausiacea distribution in the offshore stations shows similar patterns where they were present in all the bins during the night and very less in numbers during the daytime.
Fig. 18 The onshore distribution of calanoida, eucalanidae, P. monodon and euphausiacea over different O2 bin from the trawl hauls.
The accumulation of calanoida and eucalanidae in the onshore stations during the daytime in the lower bins was higher than the nighttime. The number of calanoida was almost zero in bin 1 during the night and during the daytime, it was between 10-300 individual m ³ (Fig. 18). Eucalanidae was showing even more⁻ accumulation in bin 1 during the day with a number between 5 to 65 individual m ³ whereas during the⁻ night it was only between 2-12 individual m ³. ⁻ P. monodon was mostly in bin 3 (20-50 µmol kg ¹) during⁻ the day and almost nothing in the night. But euphausiacea were on the surface during the day mostly in bin 5 and during the night there were still some organisms in the system.
4.3.4. Comparison between zooplankton abundance from trawl and vertical multinet catch:
Calanoida and eucalanidae were well distributed in all the towed hauls with higher variability in numbers but its other-way-around in the vertical hauls (Fig. 19). Calanoida during the night in towed hauls had lower numbers (ranged from 0-15 individuals m ³) than the calanoida during the night in vertical hauls (ranged⁻ from 0-30 individuals m ³). The daytime distribution of calanoida was even higher in the vertical hauls. A⁻ similar kind of feature was with eucalanidae during the nighttime as well. It was ranged from 0 to 25 individuals m ³ in the towed hauls and 0 to 55 individuals m ³ in the vertical hauls. The daytime⁻ ⁻ distribution in towed hauls was as same as the vertical hauls. But euphausiacea catch was different (Fig. 20).
The nighttime distribution in towed hauls was very higher (ranged from 0 to 90 individuals m ³) than the⁻ vertical hauls (ranged from 0 to 20individuals m ³). But the daytime distribution was as similar to the⁻ vertical hauls except on net in towed hauls. P. monodon was very low in numbers in both cases but during the night towed hauls were higher in numbers than the vertical hauls.
Fig. 20 Night and daytime distribution of Euphausiacea and P. monodon from trawl and vertical hauls
4. 4. Biomass distribution:
4.4.1 Total biomass in all the stations from trawl hauls:
The integrated biomass of calanoida, eucalanidae, euphausiacea and P. monodon ranges between ~20 to 50 mg C m ² (Fig. 21). Biomass in all the nearshore stations was higher than the offshore ones except station⁻ number 8 at 15°S. Biomass in station 8 was very low which was 20 mg C m ² compared to the other onshore⁻ stations. In contrast to this, the biomass in the onshore station 2,4 and 6 was 46, 45 and 39 mg C m ²⁻ respectively. Compared to the corresponding onshore stations, all the offshore stations had a more or less similar amount of total biomass ranged from 19 to 29 mg C m ². The biomass of euphausiacea was⁻ significantly higher in the onshore stations (ANOVA, p < 0.001) than the offshore stations.
Overall, the zooplankton biomass was much higher in onshore stations than the offshore stations.
euphausiacea was the major contributor and their biomass number equally the same in both onshore and offshore stations ranged from 14 to 44 mg C m ² followed by the ⁻ P. monodon which was relatively high in biomass compared to calanoida in most of the stations ranged from 0 to14 mg C m ² , calanoida 0 to 4⁻ mgCm ², eucalanidae 0 to 5 mg C m ². The overall difference between the onshore and offshore stations⁻ ⁻ was relatively high in 11 to 12°S and lower in 14 to 16°S.
4.4.2 Day and nighttime biomass distribution (large and medium combined) of the zooplankton taxa in different O2 bin:
The nighttime hauls had a significantly higher biomass distribution of calanoida (ANOVA, p < 0.04) and euphausiacea (ANOVA, p < 0.0000000842) than the day time hauls in the oxygen minimum zones off Peru between 11 to 16°S (Fig. 22). Euphausiacea biomass was the most dominating in the system having 0-1500 µg C m ³ during the night in the water column of 50-150 µmol kg ¹ and during the day it was other-way-⁻ ⁻ around throughout the water column. The second most dominated group in the system was P. monodon with biomass of ~0-1000 µg C m ³ in the lower bin number 1 having oxygen concentrations from 0-10 µmol⁻ kg ¹. There was a little change in the biomass distribution of calanoida copepods (large and small combined)⁻ during the night and day. Calanoida biomass in the oxygen bins were significantly different than each other (ANOVA, p < 0.005) and during the night was more dominant in the oxygen concentration of 10-20 µmol kg ¹ indicating taxa with large body size. The biomass of eucalanidae during the day was a little higher⁻ which was 0-35 µg C m ³ than the nighttime which was 58 µg C m ³. ⁻ ⁻
4.4.3 Biomass distribution of different size class in O2 bin:
Fig. 23 Biomass distribution of large size (>1000 µm) calanoida, eucalanidae, P. monodon and euphausiacea in different O2 bins.
The biomass distribution of the large size calanoida was distributed in all the oxygen bins during the nighttime (Fig. 23) but were largely found in higher bins during the day. The biomass of eucalanidae were mostly found in the water column with a dissolved oxygen concentration of 50-150 µmol kg ¹ during the⁻ night and almost similar during the day. P. monodon biomass during the night was mostly in lower bins and almost nothing during the day. Biomass of large euphausiacea was very high in the water with a dissolved oxygen concentration 50-150 µmol kg ¹ during the night and nothing during the day. The biomass of⁻ medium size calanoida was highly distributed in bin 4 with dissolved oxygen concentration of 50-150 µmol kg ¹ and a large increase in bin 2 during the night where it was almost empty at day (Fig. 24). Eucalanidae⁻ biomass were largely distributed in the bin 4 during the night and also during the day but increase in the biomass of bin 1. Eucalanidae was also in bin 2 during the night whereas it was almost nothing during the day. Medium size P. monodon biomass was zero because of no catch. Euphausiacea biomass was largely distributed in bins 3 and 4 during the night and almost nothing during the day.
5. Discussions and conclusions:
5.1 General remarks
The paired day and night multinets during the M138 cruise in June 2017 have provided us vertically stratified zooplankton data in conjunction with abiotic factors including oxygen, temperature, salinity, density and depth. The thermocline and oxycline were shallower along the coast and other-way-around in offshore except few stations. For example, Criales-Hernandez (2007) have found a shallow oxycline and thermocline located at 10-20 m depth at the nearshore stations.
5.2 Biomass distribution from 11 to 16°S
Off Peru, crustaceans are numerically dominant and among them, copepods and euphausiids are the main groups (Ayon et al. 2008). Onshore stations were most dominant in zooplankton biomass between 11 to 16°S the only exception was with station 8 which also had deeper clines compared to the other onshore stations.
Kiko et al. (2019) found that the total integrated biomass was lower in two of the nearshore stations despite the upwelling and productivity at the shelf stations. This spatial variability could be a reason for the dominance of small copepods and shallow oxycline which restricts them to conduct the DVM but the only exception by P. monodon which partly resides on the seafloor during the day (Kiko et al. 2015). Biomass of euphausiacea was very interesting in the system where it's very high during the night and almost nothing during the daytime which was due to diel vertical migration pattern. Kiko et al. (2019) have found biomass of euphausiacea very low in the upper 200 m and high at the nighttime in the oxygenated surface layer and this day-night variations in euphausiacea biomass distribution indicate that they spend daytime in the oxygen minimum zone and migrated to the surface at nighttime. Pritha Tutasi et al. (2019) also found high biomass aggregates above the oxycline, associated with more oxygenated surface waters and most taxa were able to perform DVM even eucalanidae and euphausiids can exhibit a large migration amplitude around 500 m remaining either temporarily or permanently during the day or night condition within the core of the OMZ.
Whereas P. monodon was also very high in biomass during the night and leaving the water column during the day like euphausiacea. Escribano, R. (2006) suggested that in the oxygen minimum zone the vertical migration of Euphausia mucronata significantly contributes to the carbon economy of the subsurface, low- oxygen waters. The large sized euphausiacea and copepods were particularly important in the process of organic material transport from the euphotic zone into the OMZ because of their abundance, biomass and vertical migration behavior.
5.3 Abundances in surface mixed layer
In the surface mixed layer off Peru, in terms of abundance, copepods like calanoida and eucalanidae were dominating the zooplankton community followed by euphausiacea and P. monodon. In terms of biomass, however, euphausiacea were contributing most at all stations sampled. M. I. Criales-Hernández et al. (2008) have found similar results where calanoida were the most important taxa with Acartia tonsa (72.86%), Centropages brachiatus (7.5%), and Paracalanus parvus (3.1%). Finding also were shown by Pritha Tutasi et al. (2019) in which the most dominant taxa in each station both daytime and night conditions, were small and large sized calanoids. Escribano et al. (2009) in the water column off Chile also found eucalanidae and euphausiacea the most numerous organism in the system. Though day and nighttime distribution have high variability in the water column 10 to 16°S. The calanoida, eucalanidae and P. monodon forage in the upper mixed layer of the water column during the night where the concentration of dissolved oxygen ranged between 50 to 150 µmol kg ¹ but small calanoida and eucalanidae were also present in the lower boundary⁻ of the oxycline where oxygen concentration close to anoxic. The day and nighttime distribution of the zooplankton in this study shows a clear difference for euphausiacea and P. monodon (both being almost absent from the mixed layer during the night), indicating vertical migration to the mesopelagic or deeper (Kiko et al. 2015) which is the behavioral processes determining the daytime preference; one could be the diel vertical migration and another is reverse diel vertical migration (Ohman, Frost and Cohen, 1983).
Zooplankton taxa with all size classes were more abundant in the offshore stations than the nearshore.
Distribution of eucalanidae between day and night was significantly different at shelf break and offshore stations which shows the occurrence of diel vertical migration (Judkins, 1980). In terms of depth strata, they
were more in the surface waters where oxygen concentration is high and they decreased with depth. M. I.
Criales-Hernández et al. (2008) have found a similar distribution concerning a strong, shallow oxycline where the highest total abundance was always in the upper, well-oxygenated layer. In general, the higher abundance was in the shallower strata and well oxygenated and then decreased rapidly in the strata associated with OMZ core (Pritha Tutasi et al., 2019).
5.4 Diel vertical migration of zooplankton
Diel vertical migration is a very flexible behavior depending on the environmental condition which can be adopted by a planktonic organism (Criales-Hernández et al. 2008). The vertical migration of calanoida and eucalanidae taxa within the surface layer off Peru during the day and night indicates both directional (upward and downward) movement. Among the species permanently conducting diel vertical migrations into the OMZ is the euphausiacea feeding at night and descending during daytime which ranged even in the shallower depths from ~18 to 34 meter (Criales-Hernández et al. 2008). They regularly migrate into the strongly hypoxic anoxic core of the ETSP OMZ and as a result exposure to low oxygen levels could lead to a reduction of few physiological processes including respiration and ammonium excretion in euphausiacea (Kiko et al. 2016). Calanoida were mostly distributed in the upper mixed layer. However, our fine-scale sampling showed that they do undertake a vertical migration in both directions. They do not migrate into the OMZ though, but stop at a depth where oxygen concentration was sufficiently high to support their metabolism (20-50 µmol kg ¹), but low enough to exclude some of their predators.⁻ Eucalanidae migrate even to the lower oxycline during the day where oxygen concentration was close 0 µmol kg ¹. ⁻ Though they showed different oxygen preferences which could be the results of many different things altogether including species-specific preferences (Saltzman & Wishner, 1997; Hidalgo et al. 2005) and This pattern may be related to the avoidance of predators, which are limited to oxygenated layers. Eucalanidae had performed the greatest vertical distribution in eastern equatorial Pacific (Fleminger 1973) but remained near the base of the oxycline in the OMZ (Hidalgo et al. 2005). Eucalanidae could survive in the anoxic water layers for a period of 12 h (Boyd et al. 1981; Mackas et al. 1981).
In contrast to small zooplankton, euphausiacea and P. monodon were showing the classical diel vertical migration where they were absent in the water column during the day and migrating well below the oxycline.
Kiko et al. (2015) also found that P. monodon can be found in the sea surface water during the night. During the day, they were observed on the seafloor at the shallow shelf stations, but given that in the resent study there were also found in deeper waters, it may be possible that they spend the day in the mesopelagic (which seems energetically more costly because it required constant swimming). Whereas oxygen preference of euphausiacea during the day coincide with the hypothesis of this study. They were relatively present equally in all the bins during the night and leaving them empty during the day traveling well bellow the oxycline in the OMZ core. This could be the result of diet specialization where they feed on the small copepods during the night which was more abundant in the oxycline.
Migration can also be reversed. Calanoida community was quite diverse and seems to be composed by species that migrate slightly down as described above, but also some that migrate upward. Judkins (1980) found that some taxa from calanoida with assemblages in the higher oxygenated water albeit predation risk and similar conditions have observed in this study as well. At nighttime, they were very abundant in this water but in the daytime, they move upward direction to the higher bins. This kind of inverse migration pattern has also been observed in few calanoida taxa suggested that predator avoidance was the clue for this migratory behavior (Hernandez_Leon et al. 2001; Ohman et al. 1983; Escribano, 2006). But the upward movement of the eucalanidae was not observed in this study though Eucalanus inermis showed singular upward movement or “emersion” just above the oxycline during day and night (Criales-Hernández et al.
2008). The aggregation of copepods is also well connected with the oceanic nutrient cycle in the means of respiration and excretion.
Temporal and spatial differences between the vertical and horizontal sampling play a very important role.
This difference in abundance also draws a thin line in between the vertical and horizontal sampling and
Peru was very much similar but with little difference. The hydrographic conditions also showed some variability on a diurnal time scale, as shown by the oscillation of thermo and oxycline depths (Zoxy and Ztherm). The oscillation in Cline depth may be responsible for stimulating the diel vertical migration in some of the copepods species. The abundance of Calanus sp. was significantly correlated to oxygen concentration which could be due to physical process and changes in vertical distribution generated by the advection of different water masses with a different distribution of organisms (Criales-Hernández et al. 2008). Along with these, water column physical intervention including internal wave could also cause community shift spatially in 24-hour temporal differences and therefore a further investigation should have carried to look in more in- depth interventions. This rippled-structured distribution of plankton is basically generated by the plankton which has a distribution pattern to clump together and in order to move they need to depend on the internal wave or movement of the water masses in the ocean (Haumahu, 2005).
5.5 Study outcomes in highlights
a. Between 11 to 16°S, oxycline was deep offshore and shallow near the coast with the indication of higher biomass distribution onshore than offshore but similar abundance.
b. During the daytime, diel vertical migration into the OMZ core was performed by euphausiacea and P.
monodon crossing and calanoida and eucalanidae performed both the diel and reverse diel vertical migration with a lesser amplitude, i.e. mostly within the mixed layer.
c. During the day, calanoida prefers layers with dissolved oxygen concentration from 20 to 250 µmol kg ¹⁻ and eucalanidae shows accumulation during the day in the oxycline.
d. Results confirm the hypothesis of zooplankton accumulation (at least copepods) during the day on top of the lower boundary of oxycline but also reveals their presence during the night as well.
e. Results indicate a high abundance of krill below the oxycline during the night. It remains unclear whether individuals undertake short excursions to the surface to pay their oxygen debt (since they already spend the day at anoxia or near-anoxia)
f. Further investigation can be carried for the increasing taxonomic resolution along with fine-tuning of the imaging instrument (capturing 4D zooplankton community dynamics) to determine the exact species and their depth preferences in terms of oxygen concentrations.
References:
Antezana T (2009) Species-specific patterns of diel migration into the Oxygen Minimum Zone by euphausiacea in the Humboldt Current Ecosystem. Progress in Oceanography, 83(1–4), 228–236.
Aumont O, Maury O, Lefort S, Bopp L (2018) Evaluating the potential impacts of the diurnal vertical migration by marine organisms on marine biogeochemistry. Global Biogeochemical Cycles 32, 1622–1643.
Ayon, Patricia & Criales, Maria & Schwamborn, Ralf & Hirche, Hans-Jürgen. (2008). Zooplankton research off Peru: A review.
Progress in Oceanography, 79. 238-255. DOI: 10.1016/j.pocean.2008.10.020.
Bakun A, Weeks SJ (2008) The marine ecosystem off Peru : What are the secrets of its fishery productivity and what might its future hold ? Progress in Oceanography, 79(2–4), 290–299.
Bollens SM, Frost BW (2013) Ovigerity, selective predation and variable diel vertical migration in Euchaeta elongata. Oecologia, volume 87(2), 155–161.
Boyd CM, Smith SL, Cowles J (1980) Grazing patterns system off Peru. Limnology and Oceanography, 25(4), 583–596.
Brink KH, Halpern D, Smith RL (2008) Circulation in the Peruvian upwelling system near 15°S. Journal of Geophysical Research, 85(C7), 4036. DOI: 10.1029/jc085ic07p04036.
Brinton E (1979) Parameters relating to the distributions of planktonic organisms, especially euphausiacea in the eastern tropical Pacific. Progress in Oceanography, 8(3), 125–189. doi: 10.1016/0079-6611(79)90001-6.
Buesseler KO, Boyd PW (2009) Shedding light on processes that control particle export and flux attenuation in the twilight zone of the open ocean. Limnology and Oceanography, 54(4), 1210–1232. DOI: 10.4319/lo.2009.54.4.1210
Carr M, Strub PT, Thomas AC (2002) Evolution of 1996 – 1999 La Nina and El Nino conditions off the western coast of South America : A remote sensing perspective. Journal of Geophysical Research, 107(c12), 29 (1-16). DOI: 10.1029/2001JC001183.
Chavez FP, Messié M (2009) A comparison of Eastern Boundary Upwelling Ecosystems. Progress in Oceanography, 83(1–4), 80–96.
DOI: 10.1016/j.pocean.2009.07.032.
Codispoti LA, Christensen JP (1985) Nitrification, denitrification and nitrous oxide cycling in the eastern tropical South Pacific ocean. Marine Chemistry, 16(4), 277–300. DOI: 10.1016/0304-4203(85)90051-9.
Cohen J, Forward R (2009) Zooplankton Diel Vertical Migration‚A Review Of Proximate Control. In Oceanography and Marine Biology, Vol. 47, pp. 77–109. DOI: 10.1201/9781420094220.ch2.
Criales-Hernández MI, Schwamborn R, Graco M, Ayón P, Hirche HJ, Wolff M (2008) Zooplankton vertical distribution and migration off Central Peru in relation to the oxygen minimum layer. Helgoland Marine Research, 62(2 SUPPL.1), 85–100.
DOI: 10.1007/s10152-007-0094-3.
Dale AW, Sommer S, Lomnitz U, Montes I, Treude T, Liebetrau V, Wallmann K (2015) Organic carbon production, mineralisation and preservation on the Peruvian margin. Biogeosciences, 12(5), 1537–1559. DOI: 10.5194/bg-12-1537-2015.
Dam HG (1998) Downward export of carbon by diel migrant mesozooplankton in the central equatorial Pacific, 2191–2202. Deep sea research part II: Tropical studies in oceanography. Volume 44, Issues 9–10, 1997, Pages 2191-2202. DOI: 10.1016/S0967- 0645(97)00060-X.
Ekau W, Auel H, ortner HO, Gilbert D (2010) Impacts of hypoxia on the structure and processes in pelagic communitiesPP (zooplankton, macro-invertebrates and fish). Biogeosciences, 7(5), 1669–1699. DOI: 10.5194/bg-7-1669-2010.
Escribano R (2006) Zooplankton interactions with the oxygen minimum zone in the eastern South pacific. Gayana (Concepción) Vol.
70. DOI: 10.4067/S0717-65382006000300005.
Escribano R, Hidalgo P, Krautz C (2009). Zooplankton associated with the oxygen minimum zone system in the northern upwelling region of Chile during March 2000. Deep-Sea Research Part II: Topical Studies in Oceanography, 56(16), 1073–1082. DOI:
10.1016/j.dsr2.2008.09.009.
Fleminger A (1973) pattern, number, variability, and taxonomic significance of integumental organs (sensilla and glandular pores) in
Gorsky G, Ohman MD, Picheral M, Gasparini SP, Stemmann L, Romagnan JB,, Alison C, Cawood A, Pesant S, Garcia-Comas C, Prejger F (2010) Digital zooplankton image analysis using the ZooScan integrated system. Journal of Plankton Research, 23(3), 285-303.
Haumahu S (2005) Distribusi Spasial Fitoplankton di Perairan Teluk Haria Saparua, Maluku Tengah. Ilmu Kelautan, Indonesian Journal of Marine Sciences, vol. 10, no. 3, pp. 126-134.
Hays GC, Harris RP, Head RN (1997) The vertical nitrogen flux caused by zooplankton diel vertical migration. Marine Ecology Progress Series, 160 , 57–62. DOI: 10.3354/meps160057.
Helly JJ, Levin LA (2004) Global distribution of naturally occurring marine hypoxia on continental margins. Deep-Sea Research Part I: Oceanographic Research Papers, 51(9), 1159–1168. DOI: 10.1016/j.dsr.2004.03.009.
Hernandez_Leon S, Almeida C, Gomez M, Torres S, Montero I, Portillo-Hahnefeld A (2001) Zooplankton biomass and indices of feeding and metabolism in island-generated eddies around Gran Canaria. Journal of Marine System, 30(1-2), 51-66.
Hidaka K, Kawaguchi K, Murakami M, Takahashi M (2002) Downward transport of organic carbon by diel migratory micronekton in the western equatorial Pacific: Deep Sea Research Part I: Oceanographic Research Papers, 48(8), 1923–1939.
Hidalgo P, Escribano R, Morales CE (2005) Ontogenetic vertical distribution and diel migration of the copepod Eucalanus inermis in the oxygen minimum zone off northern Chile (20-21° S). Journal of Plankton Research, 27(6), 519–529.
Judkins DC (1980) Vertical distribution of zooplankton in relation to the oxygen minimum off Peru. Deep Sea Research Part A, Oceanographic Research Papers, 27(6), 475–487. DOI: 10.1016/0198-0149(80)90057-6.
Karstensen J, Stramma L, Visbeck M (2008) Oxygen minimum zones in the eastern tropical Atlantic and Pacific oceans. Progress in Oceanography, 77(4), 331–350.
Kiko R, Hauss H, Dengler M, Sommer S, Melzner F (2015) The P. monodon tolerates anoxic “ dead zone ” conditions off Peru.
Marine Biology, 162(9), 1913–1921. DOI: 10.1007/s00227-015-2709-6.
Kiko R, Hauss H, Buchholz F, Melzner F (2016) Ammonium excretion and oxygen respiration of tropical copepods and euphausiids expüosed to oxygen minimum zone condition. Biogeoscience 13(20): 2241-2255. DOI: 10.5194/bgd-12-17329-2015.
Kiko R, Hauss H (2019) Modulation of zooplankton-mediated fluxes in the Peruvian Upwelling System (paper accepted by the frontiers, marine biogeochemistry).
Lam P, Kuypers MMM (2010) Microbial Nitrogen Cycling Processes in Oxygen Minimum Zones. Annual Review of Marine Science, 3(1), 317–345. DOI: 10.1146/annurev-marine-120709-142814.
Lampert W (2006) The Adaptive Significance of Diel Vertical Migration of Zooplankton. Functional Ecology, 3(1), 21.
Lehette P, Hernández-León S (2011) Zooplankton biomass estimation from digitized images: a comparison between subtropical and Antarctic organisms. Limnology and Oceanography: Methods, 7(4), 304–308. doi: 10.4319/lom.2009.7.304.
Levin LA (2002) Deep-Ocean life where oxygen is scarce. American Scientist, 90(5), 436–444. DOI: 10.1511/2002.33.756.
Liu KK, Quinones R, Atkinson L (2007). Carbon and nutrient fluxes in Continental Margins. Global Change, The IGBP Series.
Longhurst AR, Harrison WG (1988) Vertical nitrogen flux from the oceanic photic zone by diel migrant zooplankton and nekton.
Deep Sea Research Part A, Oceanographic Research Papers, 35(6), 881–889. DOI: 10.1016/0198-0149(88)90065-9.
Messié M, Chavez F (2014) Seasonal regulation of primary production in eastern boundary upwelling systems. Progress in Oceanography, 134, 1-18.
Ohman MD, Frost BW, Cohen EB (1983) Reverse Diel Vertical Migration: An Escape from Invertebrate Predators. Science, 220(4604), 1404–1407.
Paulmier A, Ruiz-pino D (2009) Progress in Oceanography Oxygen minimum zones (OMZs ) in the modern ocean. Progress in Oceanography, 80(3–4), 113–128. DOI: 10.1016/j.pocean.2008.08.001.
Paulik GJ (1981) Anchovies, Birds and Fishermen in the Peru Current. John Wiley & Sons, New York.
Saltzman J, Wishner KF (1997) Zooplankton ecology in the eastern tropical Pacific oxygen minimum zone above a seamount:
vertical distribution of copepods. Deep-Sea Research Part I: Oceanographic Research Papers, 44(6), 931–954.
Smith S, Boyd CM, Lane PVZ (1981) Short term variation in the vertical distribution of copepods off the coast of northern Peru.
United States. Doi:10.2172/5376007.
Tutasi P, Escribano R (2019) Zooplankton diel vertical migration and downward C into the Oxygen Minimum Zone in the highly productive upwelling region off Northern Chile. Biogeosciences Discuss (manuscript under review for journal Biogeosciences).
Warrant EJ, Locket NA (2004) Vision in the deep sea. Biological Reviews of the Cambridge Philosophical Society, 79(3), 671–712.
DOI: 10.1017/S1464793103006420.
Wishner KF, Ashjian CJ, Gelfman C, Gowing MM, Kann L, Levin LA, Mullineaux S, Saltzman J (1995) Pelagic and benthic ecology of the lower interface of the Eastern Tropical Pacific oxygen minimum zone. Deep-Sea Research Part I, 42(1), 93–115. DOI:
10.1016/0967-0637(94)00021-J.