1
Appendix A3
A3.1 Climatology uncertainties
pressure (hPa)
ACE−FTS Jan
−90 −60 −30 0 30 60 90 0.1
1 10 100
ACE−FTS Feb
−90 −60 −30 0 30 60 90 0.1
1 10 100
ACE−FTS Mar
−90 −60 −30 0 30 60 90 0.1
1 10
100 sampling bias (%)
−10
−5 0 5 10
pressure (hPa)
ACE−FTS Apr
−90 −60 −30 0 30 60 90 0.1
1 10 100
ACE−FTS May
−90 −60 −30 0 30 60 90 0.1
1 10 100
ACE−FTS Jun
−90 −60 −30 0 30 60 90 0.1
1 10
100 sampling bias (%)
−10
−5 0 5 10
pressure (hPa)
ACE−FTS Jul
−90 −60 −30 0 30 60 90 0.1
1 10 100
ACE−FTS Aug
−90 −60 −30 0 30 60 90 0.1
1 10 100
ACE−FTS Sep
−90 −60 −30 0 30 60 90 0.1
1 10
100 sampling bias (%)
−10
−5 0 5 10
latitude
pressure (hPa)
ACE−FTS Oct
−90 −60 −30 0 30 60 90 0.1
1 10 100
latitude ACE−FTS Nov
−90 −60 −30 0 30 60 90 0.1
1 10 100
latitude ACE−FTS Dec
−90 −60 −30 0 30 60 90 0.1
1 10
100 sampling bias (%)
−10
−5 0 5 10
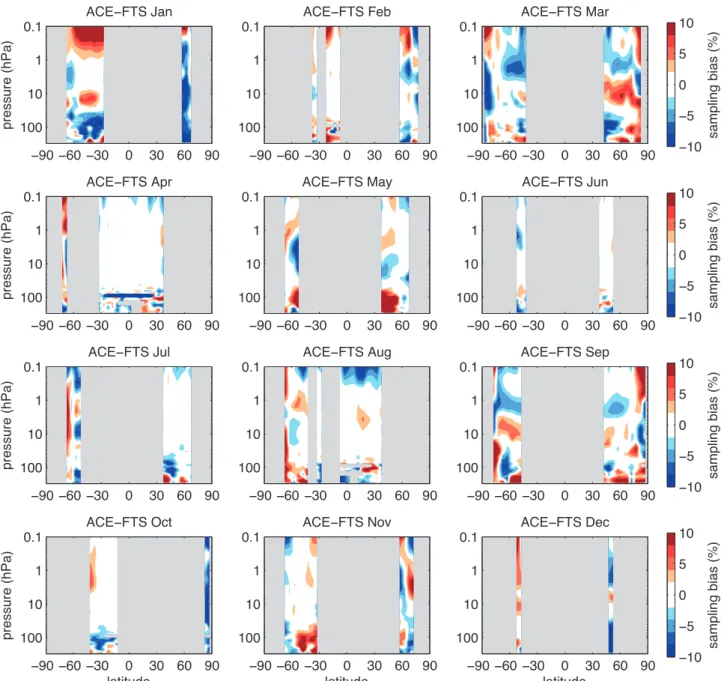
Figure A3.1.1: Sampling error for ACE-FTS. Latitude-height sections of calculated sampling error for ACE-FTS O
3for all
months. Grey regions denote regions of no measurements.
pressure (hPa)
Aura MLS Jan
−90 −60 −30 0 30 60 90 0.1
1 10 100
Aura MLS Feb
−90 −60 −30 0 30 60 90 0.1
1 10 100
Aura MLS Mar
−90 −60 −30 0 30 60 90 0.1
1 10
100 sampling bias (%)
−10
−5 0 5 10
pressure (hPa)
Aura MLS Apr
−90 −60 −30 0 30 60 90 0.1
1 10 100
Aura MLS May
−90 −60 −30 0 30 60 90 0.1
1 10 100
Aura MLS Jun
−90 −60 −30 0 30 60 90 0.1
1 10
100 sampling bias (%)
−10
−5 0 5 10
pressure (hPa)
Aura MLS Jul
−90 −60 −30 0 30 60 90 0.1
1 10 100
Aura MLS Aug
−90 −60 −30 0 30 60 90 0.1
1 10 100
Aura MLS Sep
−90 −60 −30 0 30 60 90 0.1
1 10
100 sampling bias (%)
−10
−5 0 5 10
latitude
pressure (hPa)
Aura MLS Oct
−90 −60 −30 0 30 60 90 0.1
1 10 100
latitude Aura MLS Nov
−90 −60 −30 0 30 60 90 0.1
1 10 100
latitude Aura MLS Dec
−90 −60 −30 0 30 60 90 0.1
1 10
100 sampling bias (%)
−10
−5 0 5 10
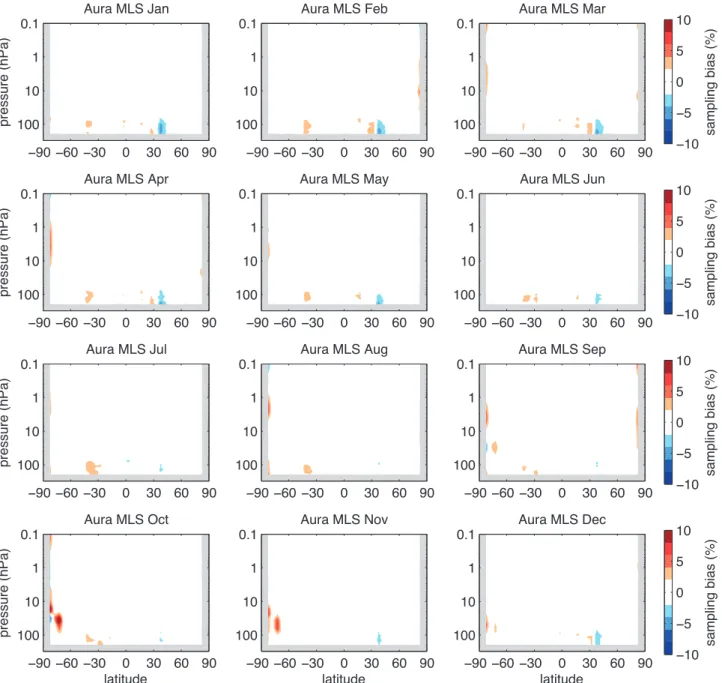
Figure A3.1.2: Sampling error for Aura-MLS. Latitude-height sections of calculated sampling error for Aura-MLS O
3for all
months. Grey regions denote regions of no measurements.
pressure (hPa)
GOMOS Jan
−90 −60 −30 0 30 60 90 0.1
1 10 100
GOMOS Feb
−90 −60 −30 0 30 60 90 0.1
1 10 100
GOMOS Mar
−90 −60 −30 0 30 60 90 0.1
1 10
100 sampling bias (%)
−10
−5 0 5 10
pressure (hPa)
GOMOS Apr
−90 −60 −30 0 30 60 90 0.1
1 10 100
GOMOS May
−90 −60 −30 0 30 60 90 0.1
1 10 100
GOMOS Jun
−90 −60 −30 0 30 60 90 0.1
1 10
100 sampling bias (%)
−10
−5 0 5 10
pressure (hPa)
GOMOS Jul
−90 −60 −30 0 30 60 90 0.1
1 10 100
GOMOS Aug
−90 −60 −30 0 30 60 90 0.1
1 10 100
GOMOS Sep
−90 −60 −30 0 30 60 90 0.1
1 10
100 sampling bias (%)
−10
−5 0 5 10
latitude
pressure (hPa)
GOMOS Oct
−90 −60 −30 0 30 60 90 0.1
1 10 100
latitude GOMOS Nov
−90 −60 −30 0 30 60 90 0.1
1 10 100
latitude GOMOS Dec
−90 −60 −30 0 30 60 90 0.1
1 10
100 sampling bias (%)
−10
−5 0 5 10
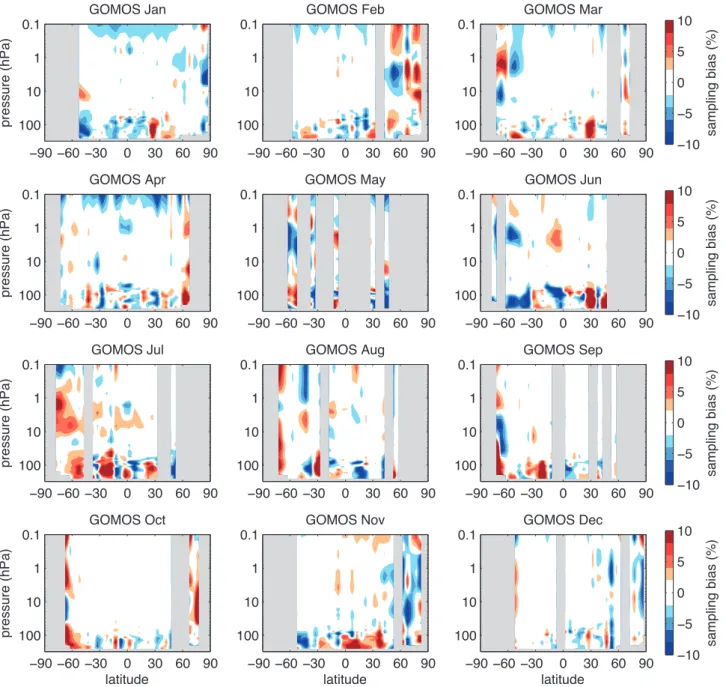
Figure A3.1.3: Sampling error for GOMOS. Latitude-height sections of calculated sampling error for GOMOS O
3for all
months. Grey regions denote regions of no measurements.
pressure (hPa)
HALOE Jan
−90 −60 −30 0 30 60 90 0.1
1 10 100
HALOE Feb
−90 −60 −30 0 30 60 90 0.1
1 10 100
HALOE Mar
−90 −60 −30 0 30 60 90 0.1
1 10
100 sampling bias (%)
−10
−5 0 5 10
pressure (hPa)
HALOE Apr
−90 −60 −30 0 30 60 90 0.1
1 10 100
HALOE May
−90 −60 −30 0 30 60 90 0.1
1 10 100
HALOE Jun
−90 −60 −30 0 30 60 90 0.1
1 10
100 sampling bias (%)
−10
−5 0 5 10
pressure (hPa)
HALOE Jul
−90 −60 −30 0 30 60 90 0.1
1 10 100
HALOE Aug
−90 −60 −30 0 30 60 90 0.1
1 10 100
HALOE Sep
−90 −60 −30 0 30 60 90 0.1
1 10
100 sampling bias (%)
−10
−5 0 5 10
latitude
pressure (hPa)
HALOE Oct
−90 −60 −30 0 30 60 90 0.1
1 10 100
latitude HALOE Nov
−90 −60 −30 0 30 60 90 0.1
1 10 100
latitude HALOE Dec
−90 −60 −30 0 30 60 90 0.1
1 10
100 sampling bias (%)
−10
−5 0 5 10
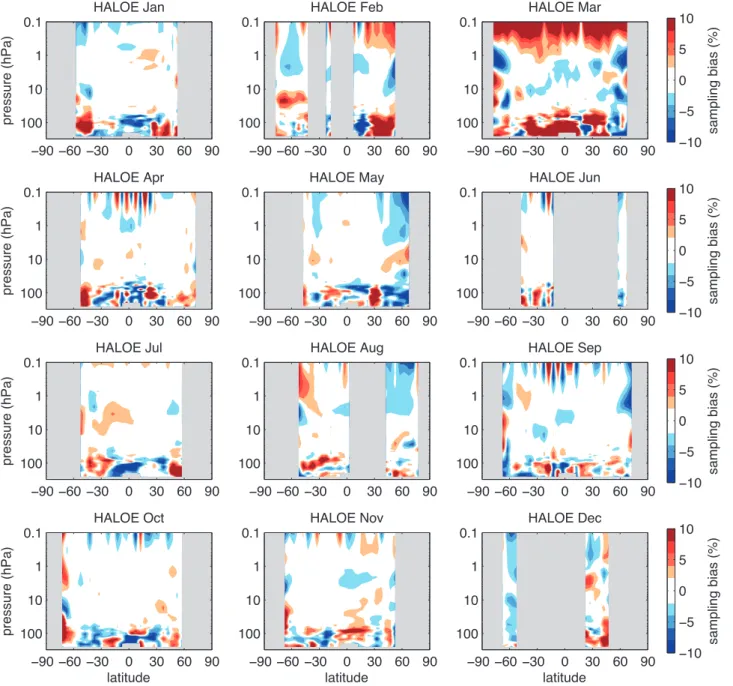
Figure A3.1.4: Sampling error for HALOE. Latitude-height sections of calculated sampling error for HALOE O
3for all months.
Grey regions denote regions of no measurements.
pressure (hPa)
HIRDLS Jan
−90 −60 −30 0 30 60 90 0.1
1 10 100
HIRDLS Feb
−90 −60 −30 0 30 60 90 0.1
1 10 100
HIRDLS Mar
−90 −60 −30 0 30 60 90 0.1
1 10
100 sampling bias (%)
−10
−5 0 5 10
pressure (hPa)
HIRDLS Apr
−90 −60 −30 0 30 60 90 0.1
1 10 100
HIRDLS May
−90 −60 −30 0 30 60 90 0.1
1 10 100
HIRDLS Jun
−90 −60 −30 0 30 60 90 0.1
1 10
100 sampling bias (%)
−10
−5 0 5 10
pressure (hPa)
HIRDLS Jul
−90 −60 −30 0 30 60 90 0.1
1 10 100
HIRDLS Aug
−90 −60 −30 0 30 60 90 0.1
1 10 100
HIRDLS Sep
−90 −60 −30 0 30 60 90 0.1
1 10
100 sampling bias (%)
−10
−5 0 5 10
latitude
pressure (hPa)
HIRDLS Oct
−90 −60 −30 0 30 60 90 0.1
1 10 100
latitude HIRDLS Nov
−90 −60 −30 0 30 60 90 0.1
1 10 100
latitude HIRDLS Dec
−90 −60 −30 0 30 60 90 0.1
1 10
100 sampling bias (%)
−10
−5 0 5 10
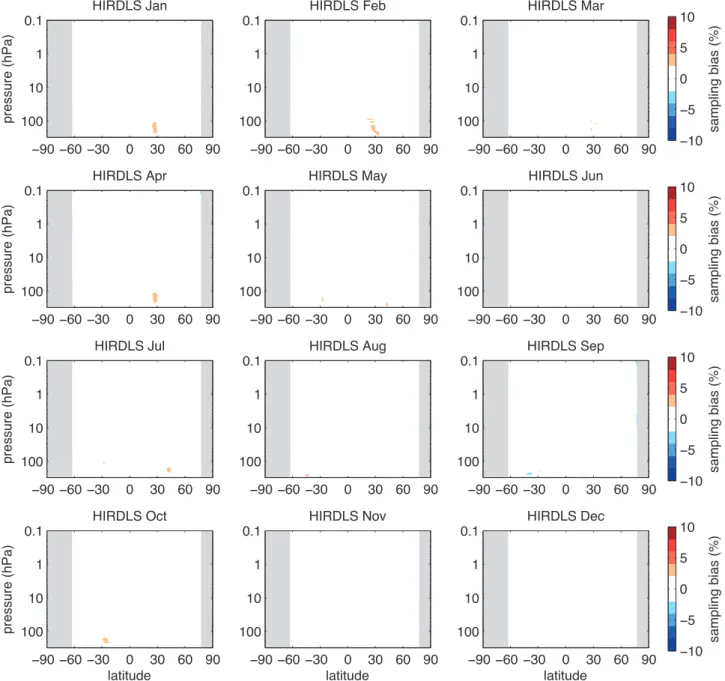
Figure A3.1.5: Sampling error for HIRDLS. Latitude-height sections of calculated sampling error for HIRDLS O
3for all
months. Grey regions denote regions of no measurements.
pressure (hPa)
MIPAS Jan
−90 −60 −30 0 30 60 90 0.1
1 10 100
MIPAS Feb
−90 −60 −30 0 30 60 90 0.1
1 10 100
MIPAS Mar
−90 −60 −30 0 30 60 90 0.1
1 10
100 sampling bias (%)
−10
−5 0 5 10
pressure (hPa)
MIPAS Apr
−90 −60 −30 0 30 60 90 0.1
1 10 100
MIPAS May
−90 −60 −30 0 30 60 90 0.1
1 10 100
MIPAS Jun
−90 −60 −30 0 30 60 90 0.1
1 10
100 sampling bias (%)
−10
−5 0 5 10
pressure (hPa)
MIPAS Jul
−90 −60 −30 0 30 60 90 0.1
1 10 100
MIPAS Aug
−90 −60 −30 0 30 60 90 0.1
1 10 100
MIPAS Sep
−90 −60 −30 0 30 60 90 0.1
1 10
100 sampling bias (%)
−10
−5 0 5 10
latitude
pressure (hPa)
MIPAS Oct
−90 −60 −30 0 30 60 90 0.1
1 10 100
latitude MIPAS Nov
−90 −60 −30 0 30 60 90 0.1
1 10 100
latitude MIPAS Dec
−90 −60 −30 0 30 60 90 0.1
1 10
100 sampling bias (%)
−10
−5 0 5 10
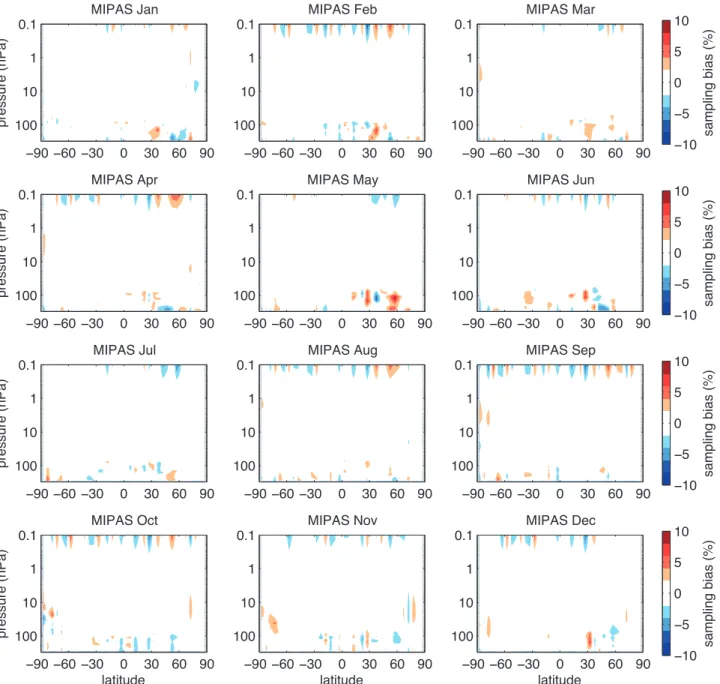
Figure A3.1.6: Sampling error for MIPAS. Latitude-height sections of calculated sampling error for MIPAS O
3for all months.
Grey regions denote regions of no measurements.
pressure (hPa)
OSIRIS Jan
−90 −60 −30 0 30 60 90 0.1
1 10 100
OSIRIS Feb
−90 −60 −30 0 30 60 90 0.1
1 10 100
OSIRIS Mar
−90 −60 −30 0 30 60 90 0.1
1 10
100 sampling bias (%)
−10
−5 0 5 10
pressure (hPa)
OSIRIS Apr
−90 −60 −30 0 30 60 90 0.1
1 10 100
OSIRIS May
−90 −60 −30 0 30 60 90 0.1
1 10 100
OSIRIS Jun
−90 −60 −30 0 30 60 90 0.1
1 10
100 sampling bias (%)
−10
−5 0 5 10
pressure (hPa)
OSIRIS Jul
−90 −60 −30 0 30 60 90 0.1
1 10 100
OSIRIS Aug
−90 −60 −30 0 30 60 90 0.1
1 10 100
OSIRIS Sep
−90 −60 −30 0 30 60 90 0.1
1 10
100 sampling bias (%)
−10
−5 0 5 10
latitude
pressure (hPa)
OSIRIS Oct
−90 −60 −30 0 30 60 90 0.1
1 10 100
latitude OSIRIS Nov
−90 −60 −30 0 30 60 90 0.1
1 10 100
latitude OSIRIS Dec
−90 −60 −30 0 30 60 90 0.1
1 10
100 sampling bias (%)
−10
−5 0 5 10
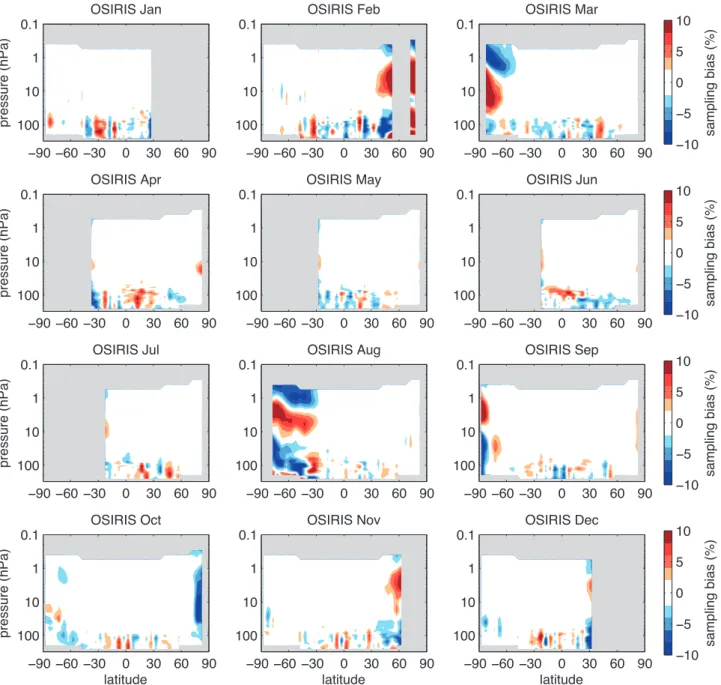
Figure A3.1.7: Sampling error for OSIRIS. Latitude-height sections of calculated sampling error for OSIRIS O
3for all months.
Grey regions denote regions of no measurements.
pressure (hPa)
POAM II Jan
−90 −60 −30 0 30 60 90 0.1
1 10 100
POAM II Feb
−90 −60 −30 0 30 60 90 0.1
1 10 100
POAM II Mar
−90 −60 −30 0 30 60 90 0.1
1 10
100 sampling bias (%)
−10
−5 0 5 10
pressure (hPa)
POAM II Apr
−90 −60 −30 0 30 60 90 0.1
1 10 100
POAM II May
−90 −60 −30 0 30 60 90 0.1
1 10 100
POAM II Jun
−90 −60 −30 0 30 60 90 0.1
1 10
100 sampling bias (%)
−10
−5 0 5 10
pressure (hPa)
POAM II Jul
−90 −60 −30 0 30 60 90 0.1
1 10 100
POAM II Aug
−90 −60 −30 0 30 60 90 0.1
1 10 100
POAM II Sep
−90 −60 −30 0 30 60 90 0.1
1 10
100 sampling bias (%)
−10
−5 0 5 10
latitude
pressure (hPa)
POAM II Oct
−90 −60 −30 0 30 60 90 0.1
1 10 100
latitude POAM II Nov
−90 −60 −30 0 30 60 90 0.1
1 10 100
latitude POAM II Dec
−90 −60 −30 0 30 60 90 0.1
1 10
100 sampling bias (%)
−10
−5 0 5 10
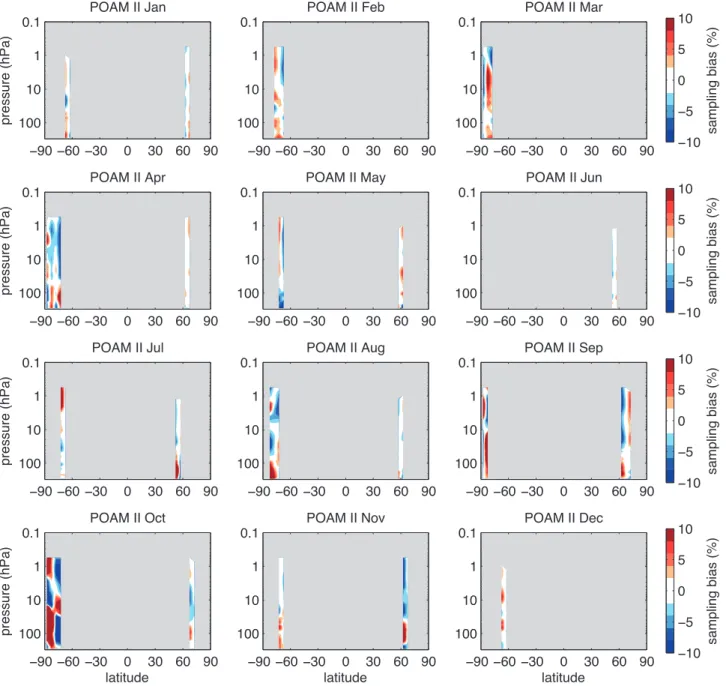
Figure A3.1.8: Sampling error for POAM II. Latitude-height sections of calculated sampling error for POAM II O
3for all
months. Grey regions denote regions of no measurements.
pressure (hPa)
POAM III Jan
−90 −60 −30 0 30 60 90 0.1
1 10 100
POAM III Feb
−90 −60 −30 0 30 60 90 0.1
1 10 100
POAM III Mar
−90 −60 −30 0 30 60 90 0.1
1 10
100 sampling bias (%)
−10
−5 0 5 10
pressure (hPa)
POAM III Apr
−90 −60 −30 0 30 60 90 0.1
1 10 100
POAM III May
−90 −60 −30 0 30 60 90 0.1
1 10 100
POAM III Jun
−90 −60 −30 0 30 60 90 0.1
1 10
100 sampling bias (%)
−10
−5 0 5 10
pressure (hPa)
POAM III Jul
−90 −60 −30 0 30 60 90 0.1
1 10 100
POAM III Aug
−90 −60 −30 0 30 60 90 0.1
1 10 100
POAM III Sep
−90 −60 −30 0 30 60 90 0.1
1 10
100 sampling bias (%)
−10
−5 0 5 10
latitude
pressure (hPa)
POAM III Oct
−90 −60 −30 0 30 60 90 0.1
1 10 100
latitude POAM III Nov
−90 −60 −30 0 30 60 90 0.1
1 10 100
latitude POAM III Dec
−90 −60 −30 0 30 60 90 0.1
1 10
100 sampling bias (%)
−10
−5 0 5 10
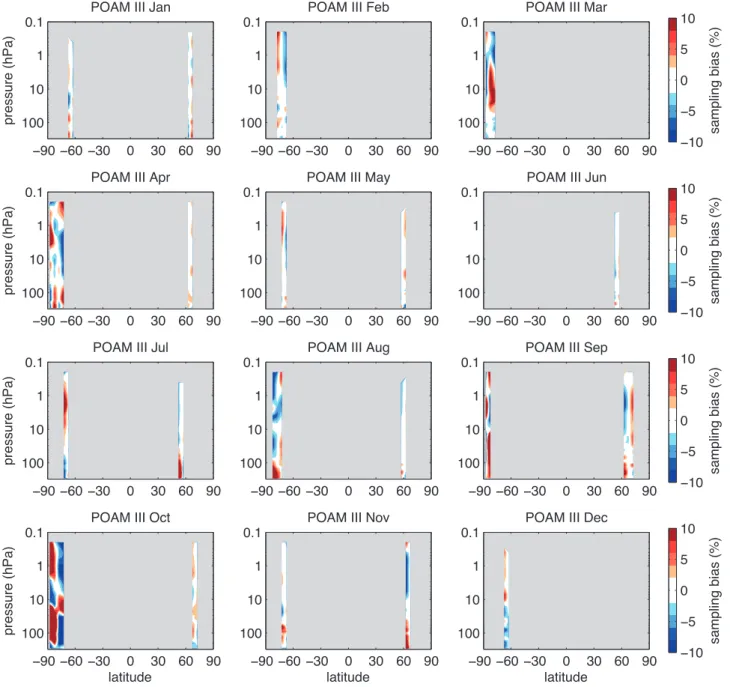
Figure A3.1.9: Sampling error for POAM III. Latitude-height sections of calculated sampling error for POAM III O
3for all
months. Grey regions denote regions of no measurements.
pressure (hPa)
SAGE II Jan
−90 −60 −30 0 30 60 90 0.1
1 10 100
SAGE II Feb
−90 −60 −30 0 30 60 90 0.1
1 10 100
SAGE II Mar
−90 −60 −30 0 30 60 90 0.1
1 10
100 sampling bias (%)
−10
−5 0 5 10
pressure (hPa)
SAGE II Apr
−90 −60 −30 0 30 60 90 0.1
1 10 100
SAGE II May
−90 −60 −30 0 30 60 90 0.1
1 10 100
SAGE II Jun
−90 −60 −30 0 30 60 90 0.1
1 10
100 sampling bias (%)
−10
−5 0 5 10
pressure (hPa)
SAGE II Jul
−90 −60 −30 0 30 60 90 0.1
1 10 100
SAGE II Aug
−90 −60 −30 0 30 60 90 0.1
1 10 100
SAGE II Sep
−90 −60 −30 0 30 60 90 0.1
1 10
100 sampling bias (%)
−10
−5 0 5 10
latitude
pressure (hPa)
SAGE II Oct
−90 −60 −30 0 30 60 90 0.1
1 10 100
latitude SAGE II Nov
−90 −60 −30 0 30 60 90 0.1
1 10 100
latitude SAGE II Dec
−90 −60 −30 0 30 60 90 0.1
1 10
100 sampling bias (%)
−10
−5 0 5 10
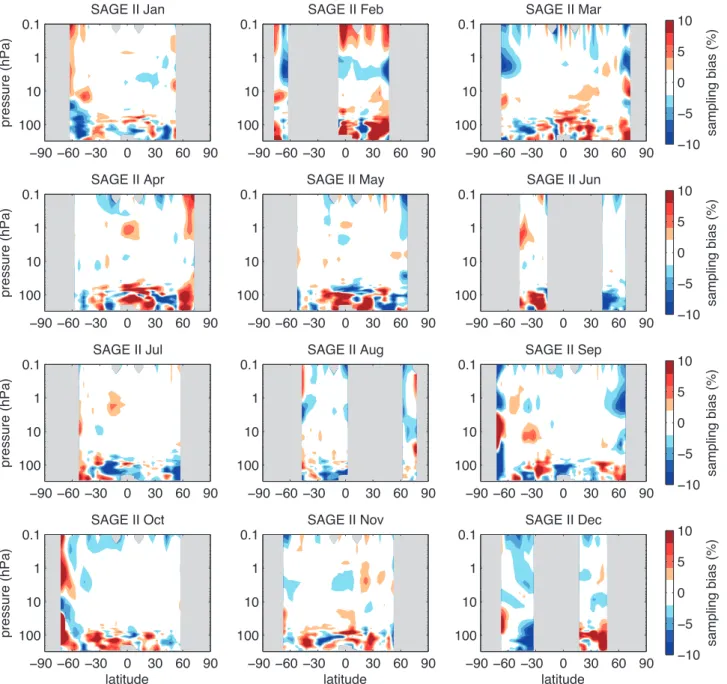
Figure A3.1.10: Sampling error for SAGE II. Latitude-height sections of calculated sampling error for SAGE II O
3for all
months. Grey regions denote regions of no measurements.
pressure (hPa)
SAGE III Jan
−90 −60 −30 0 30 60 90 0.1
1 10 100
SAGE III Feb
−90 −60 −30 0 30 60 90 0.1
1 10 100
SAGE III Mar
−90 −60 −30 0 30 60 90 0.1
1 10
100 sampling bias (%)
−10
−5 0 5 10
pressure (hPa)
SAGE III Apr
−90 −60 −30 0 30 60 90 0.1
1 10 100
SAGE III May
−90 −60 −30 0 30 60 90 0.1
1 10 100
SAGE III Jun
−90 −60 −30 0 30 60 90 0.1
1 10
100 sampling bias (%)
−10
−5 0 5 10
pressure (hPa)
SAGE III Jul
−90 −60 −30 0 30 60 90 0.1
1 10 100
SAGE III Aug
−90 −60 −30 0 30 60 90 0.1
1 10 100
SAGE III Sep
−90 −60 −30 0 30 60 90 0.1
1 10
100 sampling bias (%)
−10
−5 0 5 10
latitude
pressure (hPa)
SAGE III Oct
−90 −60 −30 0 30 60 90 0.1
1 10 100
latitude SAGE III Nov
−90 −60 −30 0 30 60 90 0.1
1 10 100
latitude SAGE III Dec
−90 −60 −30 0 30 60 90 0.1
1 10
100 sampling bias (%)
−10
−5 0 5 10
Figure A3.1.11: Sampling error for SAGE III. Latitude-height sections of calculated sampling error for SAGE III O
3for all
months. Grey regions denote regions of no measurements.
pressure (hPa)
SCIAMACHY Jan
−90 −60 −30 0 30 60 90 0.1
1 10 100
SCIAMACHY Feb
−90 −60 −30 0 30 60 90 0.1
1 10 100
SCIAMACHY Mar
−90 −60 −30 0 30 60 90 0.1
1 10
100 sampling bias (%)
−10
−5 0 5 10
pressure (hPa)
SCIAMACHY Apr
−90 −60 −30 0 30 60 90 0.1
1 10 100
SCIAMACHY May
−90 −60 −30 0 30 60 90 0.1
1 10 100
SCIAMACHY Jun
−90 −60 −30 0 30 60 90 0.1
1 10
100 sampling bias (%)
−10
−5 0 5 10
pressure (hPa)
SCIAMACHY Jul
−90 −60 −30 0 30 60 90 0.1
1 10 100
SCIAMACHY Aug
−90 −60 −30 0 30 60 90 0.1
1 10 100
SCIAMACHY Sep
−90 −60 −30 0 30 60 90 0.1
1 10
100 sampling bias (%)
−10
−5 0 5 10
latitude
pressure (hPa)
SCIAMACHY Oct
−90 −60 −30 0 30 60 90 0.1
1 10 100
latitude SCIAMACHY Nov
−90 −60 −30 0 30 60 90 0.1
1 10 100
latitude SCIAMACHY Dec
−90 −60 −30 0 30 60 90 0.1
1 10
100 sampling bias (%)
−10
−5 0 5 10
Figure A3.1.12: Sampling error for SCIAMACHY. Latitude-height sections of calculated sampling error for SCIAMACHY O
3for all months. Grey regions denote regions of no measurements.
pressure (hPa)
SMILES Jan
−90 −60 −30 0 30 60 90 0.1
1 10 100
SMILES Feb
−90 −60 −30 0 30 60 90 0.1
1 10 100
SMILES Mar
−90 −60 −30 0 30 60 90 0.1
1 10
100 sampling bias (%)
−10
−5 0 5 10
pressure (hPa)
SMILES Apr
−90 −60 −30 0 30 60 90 0.1
1 10 100
SMILES May
−90 −60 −30 0 30 60 90 0.1
1 10 100
SMILES Jun
−90 −60 −30 0 30 60 90 0.1
1 10
100 sampling bias (%)
−10
−5 0 5 10
pressure (hPa)
SMILES Jul
−90 −60 −30 0 30 60 90 0.1
1 10 100
SMILES Aug
−90 −60 −30 0 30 60 90 0.1
1 10 100
SMILES Sep
−90 −60 −30 0 30 60 90 0.1
1 10
100 sampling bias (%)
−10
−5 0 5 10
latitude
pressure (hPa)
SMILES Oct
−90 −60 −30 0 30 60 90 0.1
1 10 100
latitude SMILES Nov
−90 −60 −30 0 30 60 90 0.1
1 10 100
latitude SMILES Dec
−90 −60 −30 0 30 60 90 0.1
1 10
100 sampling bias (%)
−10
−5 0 5 10
Figure A3.1.13: Sampling error for SMILES. Latitude-height sections of calculated sampling error for SMILES O
3for all
months. Grey regions denote regions of no measurements.
pressure (hPa)
SMR Jan
−90 −60 −30 0 30 60 90 0.1
1 10 100
SMR Feb
−90 −60 −30 0 30 60 90 0.1
1 10 100
SMR Mar
−90 −60 −30 0 30 60 90 0.1
1 10
100 sampling bias (%)
−10
−5 0 5 10
pressure (hPa)
SMR Apr
−90 −60 −30 0 30 60 90 0.1
1 10 100
SMR May
−90 −60 −30 0 30 60 90 0.1
1 10 100
SMR Jun
−90 −60 −30 0 30 60 90 0.1
1 10
100 sampling bias (%)
−10
−5 0 5 10
pressure (hPa)
SMR Jul
−90 −60 −30 0 30 60 90 0.1
1 10 100
SMR Aug
−90 −60 −30 0 30 60 90 0.1
1 10 100
SMR Sep
−90 −60 −30 0 30 60 90 0.1
1 10
100 sampling bias (%)
−10
−5 0 5 10
latitude
pressure (hPa)
SMR Oct
−90 −60 −30 0 30 60 90 0.1
1 10 100
latitude SMR Nov
−90 −60 −30 0 30 60 90 0.1
1 10 100
latitude SMR Dec
−90 −60 −30 0 30 60 90 0.1
1 10
100 sampling bias (%)
−10
−5 0 5 10
Figure A3.1.14: Sampling error for SMR. Latitude-height sections of calculated sampling error for SMR O
3for all months.
Grey regions denote regions of no measurements.
pressure (hPa)
TES Jan
−90 −60 −30 0 30 60 90 0.1
1 10 100
TES Feb
−90 −60 −30 0 30 60 90 0.1
1 10 100
TES Mar
−90 −60 −30 0 30 60 90 0.1
1 10
100 sampling bias (%)
−10
−5 0 5 10
pressure (hPa)
TES Apr
−90 −60 −30 0 30 60 90 0.1
1 10 100
TES May
−90 −60 −30 0 30 60 90 0.1
1 10 100
TES Jun
−90 −60 −30 0 30 60 90 0.1
1 10
100 sampling bias (%)
−10
−5 0 5 10
pressure (hPa)
TES Jul
−90 −60 −30 0 30 60 90 0.1
1 10 100
TES Aug
−90 −60 −30 0 30 60 90 0.1
1 10 100
TES Sep
−90 −60 −30 0 30 60 90 0.1
1 10
100 sampling bias (%)
−10
−5 0 5 10
latitude
pressure (hPa)
TES Oct
−90 −60 −30 0 30 60 90 0.1
1 10 100
latitude TES Nov
−90 −60 −30 0 30 60 90 0.1
1 10 100
latitude TES Dec
−90 −60 −30 0 30 60 90 0.1
1 10
100 sampling bias (%)
−10
−5 0 5 10
Figure A3.1.15: Sampling error for TES. Latitude-height sections of calculated sampling error for TES O
3for all months. Grey
regions denote regions of no measurements.
pressure (hPa)
UARS MLS Jan
−90 −60 −30 0 30 60 90 0.1
1 10 100
UARS MLS Feb
−90 −60 −30 0 30 60 90 0.1
1 10 100
UARS MLS Mar
−90 −60 −30 0 30 60 90 0.1
1 10
100 sampling bias (%)
−10
−5 0 5 10
pressure (hPa)
UARS MLS Apr
−90 −60 −30 0 30 60 90 0.1
1 10 100
UARS MLS May
−90 −60 −30 0 30 60 90 0.1
1 10 100
UARS MLS Jun
−90 −60 −30 0 30 60 90 0.1
1 10
100 sampling bias (%)
−10
−5 0 5 10
pressure (hPa)
UARS MLS Jul
−90 −60 −30 0 30 60 90 0.1
1 10 100
UARS MLS Aug
−90 −60 −30 0 30 60 90 0.1
1 10 100
UARS MLS Sep
−90 −60 −30 0 30 60 90 0.1
1 10
100 sampling bias (%)
−10
−5 0 5 10
latitude
pressure (hPa)
UARS MLS Oct
−90 −60 −30 0 30 60 90 0.1
1 10 100
latitude UARS MLS Nov
−90 −60 −30 0 30 60 90 0.1
1 10 100
latitude UARS MLS Dec
−90 −60 −30 0 30 60 90 0.1
1 10
100 sampling bias (%)
−10
−5 0 5 10