Contents lists available atScienceDirect
Marine Environmental Research
journal homepage:www.elsevier.com/locate/marenvrev
Trophic importance of microphytobenthos and bacteria to meiofauna in soft- bottom intertidal habitats: A combined trophic marker approach
L.H. van der Heijden
a,b,∗, M. Graeve
c, R. Asmus
b, J. Rzeznik-Orignac
d, N. Niquil
e, Q. Bernier
a, G. Guillou
a, H. Asmus
b, B. Lebreton
aaUMR 7266 Littoral, Environment et Societies (CNRS–University of La Rochelle), Institute du littoral et de l'environnement, 2 rue Olympe de Gouges, 17000, La Rochelle, France
bAlfred Wegener Institute Helmholtz Centre for Polar- and Marine Research, Wattenmeerstation Sylt, Hafenstraße 43, 25992, List, Sylt, Germany
cAlfred Wegener Institut Helmholtz Centre for Polar- and Marine Research, Am Handelshafen 12, 27570, Bremerhaven, Germany
dUMR 8222 Laboratoire d’Ecogéochimie des Environnements Benthiques, (CNRS–Sorbonne Université), Observatoire Océanologique de Banyuls, 1 avenue Pierre Fabre, 66650, Banyuls-sur-Mer, France
eUMR 7208 Unité Biologie des Organismes et Ecosystèmes Aquatiques (MNHN–CNRS–IRD–Sorbonne Université–Université de Caen Normandie–Université des Antilles), Esplanade de la Paix, 14000, CAEN, France
A R T I C L E I N F O
Keywords:
Free-living marine nematodes Benthic copepods
Benthic diatoms Bacteria Trophic markers Seagrass beds Mudflats Sandflats
A B S T R A C T
Meiofauna can play an important role in the carbonfluxes of soft-bottom coastal habitats. Investigation of their feeding behavior and trophic position remains challenging due to their small size. In this study, we determine and compare the food sources used by nematodes and benthic copepods by using stable isotope compositions, fatty acid profiles and compound specific isotope analyses of fatty acids in the mudflats, seagrass beds and a sandflat of the Marennes-Oléron Bay, France, and the Sylt-Rømø Bight, Germany. Suspended particulate organic matter was much more13C-depleted than other food sources and meiofauna, highlighting its poor role in the different studied habitats. The very low proportions of vascular plant fatty acid markers in meiofauna demon- strated that these consumers did not rely on this food source, either fresh or detrital, even in seagrass beds. The combined use of stable isotopes and fatty acids emphasized microphytobenthos and benthic bacteria as the major food sources of nematodes and benthic copepods. Compound specific analyses of a bacteria marker confirmed that bacteria mostly used microphytobenthos as a substrate.
1. Introduction
Soft-bottom habitats are important in coastal ecosystems due to their high primary production (Hemminga and Duarte, 2000;McLusky and Elliott, 2004; Underwood and Kromkamp, 1999), high rates of benthic metabolism (Gazeau et al., 2004) and their complex food webs based on a large diversity of potential food sources (Duarte and Cebrián, 1996). Coastal ecosystems are under constant pressure due to anthropogenic activities, global change and natural evolution (i.e. se- diment erosion and accretion) (Davis and Fitzgerald, 2004). Such pressures can affect primary production at spatial and/or temporal scales, e.g. degradation of seagrass beds, eutrophication, changes of sediment grain size,floods and droughts (Baeta et al., 2011;Dolbeth et al., 2007; Short and Wyllie-Echeverria, 1996; Valle et al., 2014), which may alter the functioning of food webs, depending on the fate of these primary sources.
Among consumers relying on these primary food sources, meiofauna has been suggested to play an important role in the carbonfluxes of soft-bottom coastal habitats due to their high biomass (Danovaro et al., 2002;Escaravage et al., 1989;van der Heijden et al., 2018), high sec- ondary production (from 4 to 29 g C m−2year−1) (Chardy and Dauvin, 1992;Danovaro et al., 2002;Escaravage et al., 1989) and high turnover rate (Kuipers et al., 1981), as well as their intermediate position in food webs (Giere, 2009), potentially fueling the higher trophic levels (Coull, 1999;Leguerrier et al., 2003). The large species diversity of meiofauna (Heip et al., 1985) results in different feeding behaviors (Giere, 2009), likely leading to different responses when dealing with changes in food sources. The feeding behavior of meiofauna has been studied in dif- ferent coastal ecosystems using various methods. In bare coastal habi- tats, many meiofauna appear to rely largely on microphytobenthos (Maria et al., 2011;Moens et al., 2014;Rzeznik-Orignac et al., 2008), whereas it has been reported that meiofauna use a larger range of food
https://doi.org/10.1016/j.marenvres.2019.05.014
Received 9 January 2019; Received in revised form 22 April 2019; Accepted 20 May 2019
∗Corresponding author. UMR 7266 Littoral, Environment et Societies (CNRS–University of La Rochelle, Institute du littoral et de l'environnement, 2 rue Olympe de Gouges, 17000, La Rochelle, France.
E-mail address:luuk.van_der_heijden@univ-lr.fr(L.H. van der Heijden).
Marine Environmental Research 149 (2019) 50–66
Available online 22 May 2019
0141-1136/ © 2019 Elsevier Ltd. All rights reserved.
T
sources in vegetated sediments, e.g. microphytobenthos, phytoplankton and seagrass material (Lebreton et al., 2012; Leduc et al., 2009;
Vafeiadou et al., 2014). Nevertheless, the role of some of these food sources is still under debate—e.g. seagrass material (Leduc et al., 2009), suspended particulate organic matter (SPOM; Vafeiadou et al., 2014)—or, poorly studied, like bacteria (Vafeiadou et al., 2014). The combination of several trophic markers appears to be very promising to address some limitations highlighted in previous studies, and therefore to better define the food sources of meiofauna, as these methods are complementary.
The feeding behavior of nematodes, typically the predominant taxon in meiofauna, is often determined using the morphology of the buccal cavity (Wieser, 1953). However, classifications based on buccal cavities have limitations, for instance in that they tend to describe a range of potentially utilized resources rather than actual food pre- ferences (Moens and Vincx, 1997). Hence, the use of stable isotopes to describe the food resources of nematodes and other meiofauna taxa has been applied in a variety of coastal benthic ecosystems (Iken et al., 2001; Middelburg et al., 2000; Moens et al., 2005; Vafeiadou et al., 2014). Isotope compositions of carbon and nitrogen can provide in- formation about the food sources and the trophic level of meiofauna (Fry, 1988;Rzeznik-Orignac et al., 2008; Vafeiadou et al., 2014), as well as thefluxes of energy (Moens et al., 2002). However, in coastal ecosystems, the high variability and the similar isotope compositions of some potential food sources (Fry, 2006;Mutchler et al., 2004) may limit isotope data interpretation (Lebreton et al., 2012;Leduc et al., 2009;
Vafeiadou et al., 2014). Moreover, bacteria, which also are a potential food source (Guilini et al., 2012;Vafeiadou et al., 2014), usually have isotope compositions that closely resemble those of their substrate (Boschker et al., 2000) and are difficult to isolate using stable isotope analysis (Coffin et al., 1990;Pelz et al., 1997). Fatty acid (FA) profiles are therefore very complementary to isotope compositions to dis- criminate the various food sources in complex systems (Sargent and
Whittle, 1981) and to determine trophic interactions in coastal food webs (Kelly and Scheibling, 2012). Primary producers (e.g. diatoms, flagellates, vascular plants) and bacteria indeed synthesize specific FAs which can be used as trophic markers since consumers incorporate some of these FAs unchanged (Dalsgaard et al., 2003; Graeve et al., 1997;Parrish et al., 2000). Complementary to bulk FA analyses, com- pound specific isotope analysis of FAs can be utilized to determine the origin of the different primary producers (e.g. bacteria, diatoms) in composite food sources, such as sediment organic matter (SOM) and suspended particulate organic matter (SPOM), and consumers (Braeckman et al., 2015;Middelburg, 2014;van Gaever et al., 2009).
Discriminating food sources with the use of multiple trophic markers is a novel approach to determine the food sources of meiofauna in soft- bottom coastal systems and has been shown to be effective in advancing the understanding of complex food webs (Jaschinski et al., 2008;
Lebreton et al., 2011;Leduc et al., 2009;Nyssen et al., 2005).
Using this combination of trophic markers, the aim of this study was to determine if food sources used by two major groups of meiofauna (i.e. nematodes and benthic copepods,van der Heijden et al., 2018) are modified when biomasses of these food sources are changing. In this aim, we assessed the contributions of different food sources to nema- todes and benthic copepods related to habitat type (i.e. mudflats, sea- grass beds and a sandflat in the Marennes-Oléron Bay, France, and the Sylt-Rømø Bight, Germany) and seasons (spring and autumn). The comparison of these different cases (i.e. habitats and different seasons) provided several food web scenarios (e.g. high or low load of detrital material, pulses of phytoplankton) to determine how meiofauna uses the different potential food sources depending on their availability. The comparisons of these scenarios provided answers about 1. the role of seagrass material (as fresh or as detritus) as a food sources to meio- fauna, 2. the importance of the trapped SPOM for meiofauna—and therefore the role of benthic-pelagic coupling—and 3. the role of benthic diatoms and bacteria in the diet of meiofauna.
Fig. 1.Sampling stations in the mudflats, seagrass beds and the sandflats in the Marennes-Oléron Bay (MO) and the Sylt-Rømø Bight (SR) along the European Atlantic coast. Pelagic sampling stations, where samples for suspended particulate organic matter were taken, are indicated with roman numbers in Marennes-Oléron Bay (I- II) and Sylt-Rømø Bight (III–V).
2. Material and methods
2.1. Study area
The study was carried out in intertidal habitats of the Marennes- Oléron Bay, in the middle of the western Atlantic coast of France, and the Sylt-Rømø Bight, in the southeastern North Sea in Germany (Fig. 1).
The Marennes-Oléron Bay is dominated by bare intertidal mudflats (Gouleau et al., 2000) and influenced by oceanic and continental inputs of organic matter. The semi-enclosed basin of the Sylt-Rømø Bight is dominated byArenicolasandflats (Asmus and Asmus, 2005,1985) and has negligible continental inputs. Sampling was carried out in three intertidal habitats within the two bays (see van der Heijden et al.
(2018), for additional information): a bare mudflat (mudflat MO) and a seagrass bed (seagrass MO) in the Marennes-Oléron Bay, and a bare mudflat (mudflat SR), a seagrass bed (seagrass SR) and a sandflat (sandflat SR) in the Sylt-Rømø Bight (Fig. 1). In both areas, seagrass beds were formed by the dwarf seagrass Zostera noltii Hornemann.
Based on knowledge already obtained about these habitats (Baird et al., 2007; Leguerrier et al., 2003; Pacella et al., 2013; Saint-Béat et al., 2013), one sampling station was designated for each of thesefive lo- cations.
2.2. Sampling and laboratory processing of benthic primary producers, composite food sources and meiofauna
Sampling was carried out in two seasons, in spring (from May 17 to June 17, 2016) and in autumn (from November 14 to December 15, 2016), to compare a season with high primary production with a season with high load of detrital material (Galois et al., 1996).
2.2.1. Benthic primary producers and composite food sources
Benthic sampling campaigns were carried out during low tide, starting about one hour before the time of the lowest water level.
Sediment organic matter (SOM), detritus, and seagrass leaves and roots were collected using sediment cores (ø = 19 cm; three replicates) which were separated in two layers (a surface layer from 0 to 1 cm, a sub- surface layer from 1 to 5 cm). Each sediment layer was gently sieved with a 500μm mesh (1 mm mesh for sandflat SR samples) after which the upper fraction (> 500μm) was separated into seagrass leaves, roots and detritus (brown to black colored leaves and roots). Epiphytes were not removed from seagrass leaves as their biomass was very low as demonstrated in the Marennes-Oléron Bay (Lebreton et al., 2009). SOM analyses were carried out on the lower fraction (< 500μm). Micro- phytobenthos was collected by scraping surficial sediment in thefield which was then spread on trays in the laboratory some hours after collection, and covered with three nylon nets (250μm mesh). Thanks to this extraction method fromRiera and Richard (1996), slightly mod- ified byHerlory et al. (2007), epipelic diatoms migrate towards the surface and accumulate on the upper net. Diatoms are collected after one day by rinsing offthe upper net with filtered seawater. Micro- phytobenthos was mainly made up of benthic diatoms (e.g.Pleurosigma spp.,Naviculaspp.,Diploneisspp.) (Asmus, 1983;Haubois et al., 2005).
Extracted samples were checked for cleanliness (i.e. absence of detrital material) with a microscope and concentrated by centrifugation. All samples were freeze-dried and a subsample was ground to afine and homogeneous powder using a ball mill (MM 400, Retsch, Germany), except for SOM for which the sediment was ground using a mortar and pestle. Samples were stored at−20 °C for stable isotope analysis and at
−80 °C under nitrogen atmosphere for fatty acid analysis.
Between 10 and 100 ml (for stable isotope analyses) and 50 L (for fatty acid analyses) of surface seawater was sampled during high tide to collect suspended particulate organic matter (SPOM), in the same timeframe as the benthic samples. Water samples were collected at two stations (I and II) in the Marennes-Oléron Bay and three stations (III, IV and V) in the Sylt-Rømø Bight for stable isotopes (Fig. 1). For fatty acid
analyses, water samples were collected at stations I, II, and V. Station I, in the north of the Brouage bare mudflat, represented the water mass covering the mudflat MO station. Station II, near the inlet of the Mar- ennes-Oléron bay, represented the water mass influencing the seagrass MO station. Station II is sampled every two weeks in the framework of the SOMLIT surveys (data provided by“Service d’Observation en Milieu Littoral, INSU-CNRS, La Rochelle station”). Water samples collected at stations III and IV represented water masses covering the sandflat SR (III), and the mudflat SR and seagrass SR stations (IV), respectively.
Station V, near the entrance of the Sylt-Rømø Bight, represented the SPOM originating from the North Sea. Water was pre-filtered with a 250-μm sieve to eliminate large particles/organisms and thenfiltered on precombusted (4 h, 450 °C) Whatman GF/F glassfiberfilters (0.7μm nominal porosity, 13 mm diameter for stable isotopes and 47 mm dia- meter for fatty acids) under moderate vacuum. Filters were freeze-dried and then stored at−20 °C for stable isotope analysis and at−80 °C under nitrogen atmosphere for fatty acid analysis.
2.2.2. Meiofauna
Meiofauna was sampled using sediment cores (ø = 19 cm; three replicates) which were separated in two layers (a surface layer from 0 to 1 cm, and a deep layer from 4 to 5 cm) to study the changes of meio- fauna diet related to sediment depth. Samples were sieved with a 500- μm mesh to eliminate macrofauna and large detritus. Meiofauna must be collected alive to allow evacuation of gut contents. Therefore, meiofauna was extracted from the sediment using a Ludox HS-40-based protocol (Sigma Aldrich, France) (de Jonge and Bouwman, 1977), slightly modified byLebreton et al. (2012), which allows the recovery of living organisms. The collected meiofauna was pooled and kept at 4 °C for 72 h to empty their gut content (Riera et al., 1996) and then stored at−80 °C. Meiofauna samples were well diluted and individuals showed little movement which reduced interaction and thus predation of meiofauna while emptying their gut content. The starvation period has a negligible effect on the fatty acid composition of the consumers (Haubert et al., 2004).
2.3. Analytical procedures 2.3.1. Bulk stable isotope analyses
Carbonates were removed from SOM and SPOM samples forδ13C measurements. For SOM, carbonates were removed by adding HCl at 2 mol l−1 drop-by-drop on sediment samples until cessation of bub- bling, then samples were dried at 60 °C. Dried samples were re-homo- genized into ultrapure water using an ultrasonic bath, freeze-dried and ground again. Filters with SPOM were acidified for 4 h using HCl fumes.
δ15N analyses were carried out on non-acidified samples.
A bulk of nematodes and benthic copepods were randomly picked withfine forceps (#55, Dumont). From 25 to 50 individuals (depending on the size ranges) were picked, cleaned in ultrapure water and trans- ferred into a tin capsule, which had been previously weighed ( ± 1μg, ME 5, Sartorius, Germany) andfilled with ultrapure water. Tin capsules were then freeze-dried.
All freeze-dried samples were precisely weighed ( ± 1μg) and were analyzed for isotope compositions using an elemental analyzer (Flash, 2000; Thermo Scientific, Milan, Italy) coupled to an isotope ratio mass spectrometer (Delta V Plus with a Conflo IV interface, Thermo Scientific, Bremen, Germany). Analyses were conducted at the Littoral, Environment and Societies Joint Research Unit stable isotope facility (University of La Rochelle, France). Results are expressed in theδno- tation as deviations from standards (Vienna Pee Dee Belemnite forδ13C and N2in air forδ15N) following the formula:δ13C orδ15N = [(Rsample/ Rstandard)-1] * 103, where R is13C/12C or15N/14N. Calibration was done using reference materials (USGS-24, -61, −62, IAEA-CH6, -600 for carbon; USGS-61, -62, IAEA-N2,–NO–3, -600 for nitrogen). The ana- lytical precision of the measurements was < 0.15‰ for carbon and nitrogen based on analyses of USGS-61 and USGS-62 used as laboratory
internal standards.
2.3.2. Fatty acid analyses
Lipids of primary producers and composite food sources were ex- tracted from freeze-dried powdered samples using an accelerated sol- vent extractor (ASE 200, Dionex, Sunnyvale, USA) following the pro- cedure from Folch et al. (1957), slightly modified. Samples were extracted three times with chloroform:methanol mixtures (1:2, 2:1 and 4:1, v/v) after which NaCl (1%) solution was added to the extracted sample to separate it into two phases. The lower phase (containing li- pids) was then collected and stored in the dark at −20 °C. A bulk of nematodes from surface- and deep layers (80–400 individuals) as well as benthic copepods (100–600 individuals) were randomly picked, cleaned in ultrapure water, placed in GC vials filled with ultrapure water and then freeze dried. Samples were extracted manually fol- lowing a similar protocol as for potential food sources and stored in the dark at−20 °C.
All samples were transmethylated by acid catalysis at 80 °C for 4 h using a H2SO4-methanol (3%, w/v) reagent. Two internal standards (23:0 and 25:0) were added before transmethylation for the quantifi- cation of fatty acid methyl esters (FAMEs). FAME solution was ex- tracted withn-hexane and washed three times by addition of ultrapure water andn-hexane. FAMEs of SOM and detrital material samples were purified using a high performance liquid chromatograph (HPLC) equipped with a Merck Hitachi L-6200A pump, a Rheodyne 7725-i in- jection valve (Techlab, Braunschweig, Germany) and a Sedex 75 ELSD detector (Sedere, Olivet, France). Samples were purified using a Merck Chromolith®Performance Si 100-4.6 column (Merck AG, Darmstadt, Germany) with a solvent mixture of Ethylacetate:Cyclohexane (475:25;
v/v) at a flow rate of 1.4 ml min−1. The FAMEs were eluted after 1.0–2.5 min.
FAME compositions were determined at the Alfred Wegener Institute in Bremerhaven using a gas chromatograph (GC-6890N, Agilent Technologies) equipped with an automatic sampler andfitted with a J&W DB-FFAP column (60 m, 0.25 mm internal diameter, 0.25μmfilm). Inlet and FID detector temperatures were set at 250 and 260 °C, respectively. Helium was used as a carrier gas in constantflow mode at an average linear velocity of 25 cm s−1. Oven temperature was set up at 80 °C for 2 min, then increased following two ramps (till 160 °C at 20 °C min−1, and then till 240 °C at 2 °C min−1) with afinal hold time of 20 min at 240 °C. FAME identification was performed by com- paring relative retention times with those of known mixtures, essen- tially from Arctic and Antarctic copepods.
2.3.3. Compound-specific stable isotope analyses of fatty acids
Isotope compositions of 15:0 and 20:5(n-3) were determined using a Thermo GC-c-IRMS system (Thermo Scientific Corporation, Bremen, Germany), equipped with a Trace GC Ultra gas chromatograph, a GC Isolink and a Delta V Plus isotope ratio mass spectrometer connected via a Conflo IV interface. FAMEs, dissolved in hexane, were injected in splitless mode and separated on a J&W DB-FFAP column (60 m, 0.25 mm internal diameter, 0.25μmfilm thickness). Inlet temperature was set at 280 °C. Helium was used as a carrier gas in constant flow mode (1.6 ml min−1). Oven configuration was the same as for the fatty acid analyses. Quality controls and analytical precision of the FAME carbon stable isotope compositions were established by analyzing two certificated standards (supplied by Indiana University, Arndt Schimmelmann) every 5 samples: FAME 16:0 (certified δ13C:
−30.67‰, measured δ13C: −30.42‰± 0.25) and 18:0 (certified δ13C:−23.24‰, measuredδ13C:−23.71‰± 0.27).
2.4. Data treatment and statistical methods 2.4.1. Isotope data treatment
Bayesian stable isotope mixing model MixSIAR was applied to cal- culate the contributions of the different food sources to the diet of
benthic copepods and nematodes. TheMixSIARpackage (Stock et al., 2018) was used withδ13C andδ15N values (mean and standard devia- tion) of SPOM, SOM, microphytobenthos, seagrass leaves, seagrass roots, and detritus as input data. To reduce the number of food sources, which enhances the performance of the isotope mixing model (Middelburg, 2014; Parnell et al., 2010), detrital material, seagrass leaves and roots were pooled as one single group called“seagrass ma- terial”. Isotope compositions of bacteria could not be measured in this study: they have been rarely measured and merely the carbon isotope composition of sulfide-oxidizing bacteria has been determined till now (Robinson and Cavanaugh, 1995). Isotope composition of sulfide-oxi- dizing bacteria was considered usingδ13C values (−35.0 ± 5‰) based on data fromRobinson and Cavanaugh (1995)used inVafeiadou et al.
(2014) and δ15N values (4.0 ± 0.5‰) based on estimations from Vafeiadou et al. (2014). Trophic fractionation factors utilized were 1.0‰± 1.2 forδ13C and 2.5‰± 2.5 forδ15N (vander Zanden and Rasmussen, 2001). Mixing models were run with 100,000 iterations (of which thefirst 50,000 iterations were discarded), without food sources contribution data defined a priori. Median values, 50% and 90%
credibility intervals (CI) were computed. The models were conducted for the mudflats, seagrass beds and sandflat of the Marennes-Oléron Bay and the Sylt-Rømø Bight.
2.4.2. FA data analyses
FA data are expressed as percentage of each FA relative to the sum of all identified FAs. Identification of FA trophic markers was done using published literature (Table 1), and FAs were combined in several groups: bacteria, diatoms,flagellates, vascular plants, animals, ubiqui- tous, and others. The ratios between bacteria FA markers/(bac- teria + diatom FA markers) and vascular plant FA markers/(vascular plant + diatom FA markers) were calculated for potential food sources and consumers, and were used to discriminate potential food sources for meiofauna. Discrimination between primary producers, composite food sources and meiofauna was enhanced by plotting the carbon iso- tope compositions against percentages of FAs from bacteria, diatoms, flagellates, and vascular plants (Lebreton et al., 2011;Nyssen et al., 2005).
2.4.3. Statistical methods
Data analysis and statistical tests were performed using the R soft- ware (R Core Team, 2013) and all hypotheses were tested at a p < 0.05
Table 1
Fatty acids used as trophic markers in the mudflats, seagrass beds and sandflat in the Marennes-Oléron Bay (MO) and Sylt-Rømø Bight (SR) food webs.
Abbreviations: i = iso, ai = anteiso.
Group FA biomarkers Reference
Diatoms 14:0, 16:1(n-7), 20:5(n-3)
Dunstan et al., 1994;Ramos et al., 2003;Volkman et al., 1989 16:2(n-4), 16:3(n-4),
16:4(n-1)
Graeve et al. (1994)
Bacteria i-15:0, ai-15:0, i-17:0, ai-17:0
Rajendran et al., 1993;Sargent, 1987;
Volkman et al., 1980 15:0, 17:1, 17:1(n-9),
19:1(n-9)
Rajendran et al., 1993;Volkman et al., 1980
17:0, 18:1(n-7), 19:0 Sargent (1987) Flagellates 18:4(n-3), 22:6(n-3) Ramos et al. (2003)
22:5(n-3) Galois et al. (1996)
Vascular plants 18:2(n-6), 18:3(n-3) Kharlamenko et al., 2001;Viso et al., 1993
24:0 Viso et al. (1993)
Ubiquitous 16:0, 18:0, 18:1(n-9) Sargent, 1987;Sargent and Whittle, 1981
20:4(n-6) Dunstan et al. (1988)
level. For each habitat, isotope compositions (δ13C or δ15N) of food sources and consumers were compared using permutational multi- variate analyses of variance (PERMANOVA;Anderson, 2001), based on Euclidean distance dissimilarity of isotope compositions (9999 permu- tations). Afterwards,posteriorpairwise comparisons of levels (Bonfer- roni's method, Euclidean distance) were performed to determine which food sources and/or consumers were different. PERMANOVA were also used to compare isotope compositions of food sources and consumers between habitats and seasons. Sediment layers (i.e. surface vs. sub- surface) were also considered as a factor in comparisons of isotope compositions of SOM, detritus and nematodes.Posteriorpairwise com- parisons of levels were performed to test which habitats had different isotope compositions. PERMANOVA and pairwise comparisons were performed using the vegan package (Oksanen et al., 2017). To test whether temporal differences of isotope compositions occurred within specific habitats, Kruskal-Wallis tests were applied (followed by Dunn's multiple comparisons of means, Bonferroni's method, using the PMCMRplus package, Pohlert, 2018). Ellipses representing 95% con- fidence regions for isotope compositions of meiofauna were estimated based on bootstrap resampling (n= 1000) utilizing the CIplot_biv function (Greenacre, 2016) and ellipses were illustrated using theellipse package (Murdoch and Chow, 1996).
FA profiles of food sources and meiofauna were compared between habitats, seasons, and sediment layers using Pearson's Chi-squared tests and differences were visualized by average hierarchical clusters (Ward.D2 method, Chi-squared distance) using a modified version of thepvclustpackage (Suzuki and Shimodaira, 2015). To define the sig- nificance of identified clusters, the p-values were calculated based on multiscale bootstrap resampling (n= 10,000).
3. Results
3.1. Primary producers
3.1.1. Isotope compositions of bulk material
Mean δ13C values of microphytobenthos ranged from −17.3‰ (mudflat SR, spring) to−7.2‰(sandflat SR, spring) (Fig. 2). Mean δ13C values of seagrass leaves ranged from −13.1‰ (seagrass SR, spring) to −10.4‰(seagrass MO, autumn) and those of roots were between −13.3‰(seagrass SR, spring) and−10.6‰(seagrass MO, autumn). Seagrass leaves and roots had similarδ13C values (Kruskal- Wallis tests, lowest p-value: 0.15), and are therefore grouped in the following sections as a single food source referred to as“seagrass ma- terial”. Meanδ13C values of detrital material ranged from−19.0‰
(mudflat SR, spring) to−11.1‰(seagrass MO, autumn). Food sources had different carbon isotope compositions (PERMANOVA, p-values <
0.001, Table A.1 Appendix) with microphytobenthos having lower δ13C values than seagrass and detrital material at the seagrass MO, and detrital material being more depleted in13C than seagrass material at seagrass SR (pairwise tests, highest p-value 0.03, Table A.2 Appendix).
As for food source comparisons, no general pattern could be observed in δ13C values at the spatial or at the temporal scales, but some limited differences were observed, that are detailed in the following section.
About temporal variations, δ13C values of seagrass material and detrital material were lower in spring than in autumn when habitats were considered altogether (PERMANOVA, highest p-value: 0.009, Table A.3 Appendix), but such variations were not significant when habitats were assessed separately (Kruskal-Wallis tests, lowest p-value:
0.1,Table A.4 Appendix). About spatial variations, seagrass and detrital material had higherδ13C values in the Marennes-Oléron Bay (i.e. from
−12.9 to−10.4‰) than in the Sylt-Rømø Bight (i.e. from−20.0 to
−11.9‰) (PERMANOVA, p-values < 0.001, Table A.3 Appendix, followed by pairwise tests, highest p-value: 0.015, Table A.5 Appendix).
A significant interaction was observed between the factors habitats and seasons onδ13C values of microphytobenthos (PERMANOVA, p-value:
0.013, Table A.3 Appendix). Microphytobenthos had the highestδ13C
values in sandflat SR (from−11.6 to−7.2‰) and was generally more
13C-enriched in autumn than in spring, except in sandflat SR (Table A.4 Appendix).
Meanδ15N values of microphytobenthos were relatively variable, ranging from 3.7‰(seagrass MO, spring) to 13.8‰(sandflat SR, au- tumn) (Fig. 2). Seagrass leaves and roots had similar δ15N values, ranging from 7.2‰ (seagrass MO, autumn) to 8.1‰ (seagrass SR, spring) and from 5.9‰(seagrass SR, spring) to 7.4‰(seagrass SR, autumn), respectively (Kruskal-Wallis tests, lowest p-value: 0.23) and were therefore grouped in the following sections as a single food source referred to as“seagrass material”. Meanδ15N values of detrital material ranged from 6.3‰to 9.7‰among sites. No clear temporal or spatial patterns could be observed forδ15N values of primary producers except for detrital material which was more 15N-enriched in the Sylt-Rømø Bight (from 8.2 to 9.6‰) than in the Marennes-Oléron Bay (6.7‰, PERMANOVA, p-values < 0.001, Table A.3 Appendix, followed by pairwise tests, p-values < 0.001, Table A.6 Appendix). As for δ13C values, a significant interaction was observed between the factors ha- bitats and seasons onδ15N values of microphytobenthos (PERMANOVA, p-value < 0.001,Table A.3 Appendix). Microphytobenthos was gen- erally more15N-enriched in autumn than in spring, except in mudflat SR (Table A.4 Appendix).
3.1.2. Fatty acid compositions
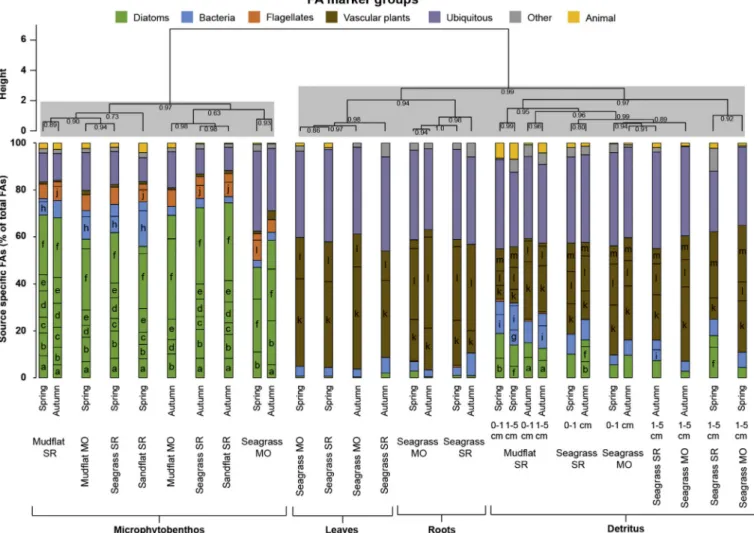
Microphytobenthos FA compositions were very different from those of seagrass material (i.e. leaves, roots) and detritus (hierarchical cluster analysis, Fig. 3, Table A.7 Appendix). Microphytobenthos was com- posed of high amounts of diatom markers (47–75%, most abundant diatom FAs: 16:1(n-7), 16:3(n-4), 16:4(n-1), 20:5(n-3)), and contained moderate amounts of bacteria markers (3–19%, primarily 15:0) and flagellate markers (5–11%, mainly 18:4(n-3) and 22:6(n-3)), as well as ubiquitous FAs (10–34%, primarily 16:0). FA profiles of seagrass leaves and roots were composed of high amounts of vascular plant markers (45–60%, mainly 18:2(n-6), 18:3(n-3) and 24:0) and of ubiquitous FAs (35–40%, mainly 16:0). Detritus were also composed of relatively high amounts of vascular plant markers (21–54%) and of ubiquitous FAs (26–41%), with a higher influence of bacteria markers (4–18%, mainly 18:1(n-7)) and diatom markers (3–19%, most abundant FAs: 14:0, 16:1(n-7) and 20:5(n-3)). Hierarchical clusters highlighted no temporal variation for FA compositions of microphytobenthos, seagrass leaves, seagrass roots and detrital material.
3.2. Composite food sources
3.2.1. Isotope compositions of bulk material
SPOM had meanδ13C values ranging from−27.6‰(sandflat SR, spring) to−22.5‰(seagrass MO, spring) and meanδ15N values ran- ging from 3.5‰(mudflat MO, autumn) to 7.5‰(sandflat SR, spring, Fig. 2). Isotope compositions were similar between spring and autumn (PERMANOVA, lowest p-value: 0.122,Table A.3 Appendix) but spatial patterns occurred (PERMANOVA, p-values < 0.001, Table A.3 Appendix). SPOM from the Marennes-Oléron Bay (δ15N: 4.8‰± 1.5) was more 15N-depleted than in the Sylt-Rømø Bight (δ15N:
7.2‰± 0.8; pairwise tests, highest p-value: 0.053, Table A.6 Appendix). At the local scale, the SPOM from seagrass MO was much more 13C-enriched (−22.5‰± 1.3) than in mudflat MO (−26.9‰± 0.9, pairwise test, p < 0.001), while SPOM isotope compositions were similar at all locations in the Sylt-Rømø Bight (Tables A.5 and A.6 Appendix).
Meanδ13C values of SOM ranged from−22.5‰in the sub-surface layer of mudflat MO in spring to −17.7‰ in the surface layer of sandflat SR in spring (Fig. 2). Theδ13C values of SOM varied at the scale of the habitat. SOM was indeed the most13C-depleted in the mudflats (mudflat MO: from −22.5 to −21.9‰, mudflat SR: −21.9 to
−21.3‰) and the most13C-enriched in the sandflat (from−17.9 to
−17.7‰) with SOM from seagrass beds having intermediate δ13C
values (seagrass SR: from −20.7 to −20.6‰, seagrass MO: from
−19.6 to−18.8‰). Besides an interaction effect between habitats and seasons (PERMANOVA, p-value < 0.001, Table A.3 Appendix), no clear pattern could be observed at the temporal scale. In the mudflat MO differences were observed between sediment layers, with higher δ13C values of SOM from surface layers (pairwise tests, p-value: 0.01, Table A.2 Appendix).
Mean δ15N values of SOM ranged from 4.9‰in the sub-surface layer of seagrass MO in spring to 10.9‰in the sub-surface layer of sandflat SR in spring. SOMδ15N values followed spatial variations at the ecosystem scale: with lower δ15N values in the Marennes-Oléron Bay (from 4.9 to 6.6‰) than in the Sylt-Rømø Bight (from 7.4 to 10.9‰), and at the habitat scale: with SOM from the sandflat being more 15N enriched (from 10.7 to 10.9‰) than all other habitats (mudflat MO: from 6.4 to 6.6‰, mudflat SR: from 8.4 to 9.0‰, seagrass MO: from 4.9 to 6.1‰, seagrass SR: from 7.4 to 8.2‰). No clear temporal pattern was observed besides a significant interaction be- tween the factors habitats and seasons (PERMANOVA, p-values <
0.001,Table A.3 Appendix). No clear pattern could be observed as well betweenδ15N values of sediment layers besides a significant interaction between the factors habitats and sediment depth (PERMANOVA, p- values < 0.001,Table A.3 Appendix).
For each habitat, isotope compositions of benthic food sources
(SOM, microphytobenthos and seagrass and detrital material), ranging from−22.5 to−7.2‰, were more13C-enriched than SPOM, ranging from−27.6 to−22.5‰(Fig. 2, PERMANOVA pairwise tests, highest p- value: 0.05,Table A.2 Appendix).
3.2.2. Fatty acid compositions
SOM and SPOM were relatively well discriminated based on their FA compositions, with SPOM samples being grouped into a single cluster and SOM samples being significantly separated into four clusters (Fig. 4). Within these four clusters, three were represented only by one or two samples. SOM was characterized by high proportions of diatom markers (17–62%, mean: 45%), bacteria markers (5–28%, mean: 16%) as well as ubiquitous FAs (20–58%, mean: 28%). The main FAs in SOM were 16:1(n-7), 16:3(n-4), 20:5(n-3) (diatom FA markers), 15:0, 18:1(n- 7) (bacteria FA markers), and 16:0 and 18:0 (ubiquitous FA markers, Table A.7 Appendix). All SOM samples had a similar FA composition except SOM from the sub-surface layer in seagrass MO in spring and autumn, from the sub-surface layer in mudflat MO in autumn and from the surface layer in sandflat SR in autumn, which differed for different reasons: sub-surface layer SOM in seagrass MO was characterized by much higher proportions of vascular plant markers (16–18%, mainly 18:3(n-3) and 24:0), sub-surface layer SOM from mudflat MO in au- tumn contained a higher proportion of typical animal FA (10%, mainly Fig. 2.Isotope compositions (δ13C andδ15N) of food sources (mean ± SD,n= 3) and nematodes (top panel) and benthic copepods (bottom panel) in the mudflats, seagrass beds and sandflat in the Marennes-Oléron Bay (MO) and Sylt-Rømø Bight (SR) in spring and autumn. For nematodes and benthic copepods, each point represents a group of 10–100 in- dividuals. Ellipses represent 95% confidence regions for isotope compositions of surface layer nematodes (green), deep layer nematodes (red) and benthic copepods (black).
Abbreviations: SPOM = suspended particulate organic matter, SOM = sediment organic matter. (For interpretation of the references to color in thisfigure legend, the reader is referred to the Web version of this article.)
22:1(n-7)), and SOM from sandflat SR in autumn had a high proportion offlagellate FA markers (10%, mainly 22:5(n-3)).
FA compositions of SPOM differed from those of SOM due to their lower proportions of diatom markers (29–51%, mainly 14:0 and 16:1(n- 7)), bacteria markers (5–13%, mainly 18:1(n-7)) andflagellate markers (2–10%, mainly 22:6(n-3)), as well as the higher proportions of ubi- quitous FAs (28–46%,Fig. 4,Table A.7 Appendix). Neither clear tem- poral nor spatial patterns could be observed in SPOM FA compositions.
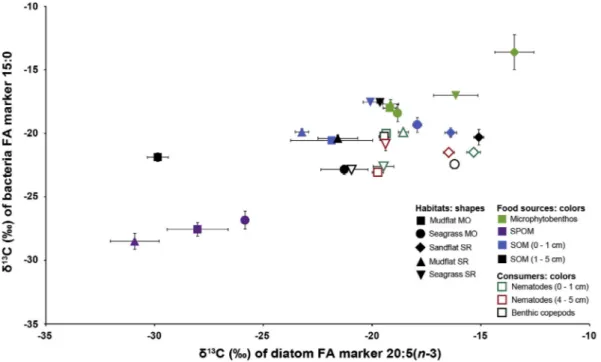
3.2.3. Compound specific isotope composition of diatom and bacteria FA markers
In potential food sources, 20:5(n-3) (i.e. diatom marker) had lower δ13C values in SPOM than in microphytobenthos and SOM from surface and sub-surface layers (PERMANOVA followed by pairwise tests, p- values < 0.001;Fig. 5,Table A.8 Appendix).δ13C values of 20:5(n-3) from SPOM indeed ranged from−33.1 to −25.4‰while SOM and microphytobenthos hadδ13C values of 20:5(n-3) between−30.5 and
−14.7‰and between−20.1 and−11.7‰, respectively. No temporal variation was observed in 20:5(n-3)δ13C values of food sources, except for SPOM which had lower values in spring than in autumn (PERMA- NOVA, p-value: 0.008, Table A.9 Appendix). SOM δ13C values of 20:5(n-3) differed between habitats and depth, with 20:5(n-3) from SOM sandflat SR being much more depleted in13C than in all other
habitats (highest p-value: 0.004, Table A.9 Appendix). 20:5(n-3) of SOM from the Marennes-Oléron Bay was more13C-depleted in the sub- surface than in the surface layer, whereas the opposite pattern was observed for 20:5(n-3) of SOM from the Sylt-Rømø Bight (PERMAN- OVA, p-value < 0.001,Table A.9 Appendix).
As for the 20:5(n-3), the δ13C values of the 15:0 (i.e. bacteria marker) well discriminated food sources (PERMANOVA followed by pairwise tests, p-values < 0.001, Table A.8 Appendix): 15:0 from SPOM had the lowestδ13C values (from−29.7 to−25.9‰,Fig. 5) and microphytobenthos was the most enriched in 13C (from −19.9 to
−11.8‰), with SOM having intermediateδ13C values (from−23.5 to
−17.4‰). As for the 20:5(n-3), no temporal pattern was observed for 15:0 δ13C values of food sources, except for SPOM which had lower δ13C values in spring compared to autumn (PERMANOVA, p-value:
0.010,Table A.9 Appendix).δ13C values of the 15:0 differed between habitats and sediment layers, with 15:0 of SOM from the seagrass SR being more13C-depleted than in all other habitats (PERMANOVA, p- values < 0.001, followed by pairwise tests, highest p-value: 0.03, Table A.9 Appendix). 15:0 of SOM were more13C-enriched in surface layers (−19.4‰± 1.3) than in sub-surface layers (−20.8‰± 1.8, pairwise tests, p-value < 0.001,Table A.9 Appendix).
Fig. 3.Fatty acid (FA) compositions (relative percentages,n= 1) of primary producers (i.e. microphytobenthos, seagrass leaves and roots, and detritus) in the mudflats, seagrass beds and sandflat in the Marennes-Oléron Bay (MO) and Sylt-Rømø Bight (SR) in spring and autumn. FAs are grouped according to their marker groups (seeTable 1) and FAs with relative percentages > 5% (Table A.7 Appendix) are indicated with letters: (a) 14:0, (b) 16:1(n-7), (c) 16:2(n-4), (d) 16:3(n-4), (e) 16:4(n-1), (f) 20:5(n-3), (g)i-15:0, (h)a-15:0, (i) 18:1(n-7), (j) 22:5(n-3), (k) 18:2(n-6), (l) 18:3(n-3) and (m) 24:0. Empty bars represent the sum of other FAs (< 5%) for each FA marker group. Hierarchical clustering (Ward D2 method, Chi-squared distance) was performed. Approximately unbiased (AU) probability values (p- values) by multiscale bootstrap resampling (n= 10,000) are given under each node and identified clusters (AU˃0.95) are highlighted with grey boxes.
3.3. Nematodes and benthic copepods
3.3.1. Compound specific isotope composition and contribution of food sources
Meanδ13C values of nematodes from the surface and the deep layers ranged from−17.9‰(seagrass SR, spring) to−12.2‰(sandflat SR, autumn) and from −20.4‰ (mudflat MO, autumn) to −15.5‰ (sandflat SR, autumn), respectively (Fig. 2). In all habitats, nematodes were more13C-enriched in surface sediment layers than in deep sedi- ment layers, withδ13C values being higher by 0.9 (seagrass SR) to 4.9‰
(mudflat MO) (PERMANOVA, highest p-value: 0.038, Table A.10 Appendix). No temporal variation could be observed, except in sandflat SR where δ13C values of nematodes were slightly lower in spring (−15.0‰± 1.9) than in autumn (−14.2‰± 1.8, PERMANOVA, p- value: 0.006,Table A.10 Appendix).
Meanδ15N values of nematodes ranged from 8.7‰(mudflat MO, spring) to 15.3‰(sandflat SR, spring) and from 7.4‰(seagrass MO, spring) to 15.6‰(mudflat MO, spring) in surface and deep layers, re- spectively. The nematodes in the seagrass beds presented higherδ15N values in the surface layer compared to the deep layer (PERMANOVA, highest p-value: 0.004) while no difference was observed in other ha- bitats (PERMANOVA, lowest p-value: 0.40, Table A.10 Appendix).
Temporal variation occurred inδ15N values of nematodes from both
mudflats (PERMANOVA, highest p-value: 0.05, Table A.10 Appendix) with lowerδ15N values in spring (8.9‰± 1.3) compared to autumn (11.1‰± 2.7) for mudflat MO. An opposite pattern occurred in mudflat SR with higherδ15N values in spring (14.8‰± 0.8) than in autumn (13.6‰± 1.4).
Isotope compositions of benthic copepods were in range with those of nematodes from the surface layers, withδ13C andδ15N values ran- ging between−18.3‰(seagrass SR, spring) and−12.7‰(sandflat SR, autumn) and between 8.3‰(seagrass MO, spring) and 15.4‰(sandflat SR, autumn), respectively (Fig. 2). Temporal variation occurred for isotope compositions of benthic copepods from sandflat SR (PERMA- NOVA, highest p-value: 0.019), with lower carbon and nitrogen isotope compositions in spring (δ13C: −14.3‰, δ15N: 13.4‰) compared to autumn (δ13C:−12.6‰,δ15N: 15.4‰).
At the habitat scale, MixSIAR outputs for nematodes from the sur- face layer highlighted the importance of two major food sources for these consumers: microphytobenthos and seagrass material (Fig. 6, Table A.11 Appendix). Microphytobenthos represented the highest dietary contributions to nematodes in mudflat MO (90% CI from 52 to 89%), in sandflat SR (50–89%) and in seagrass SR (22–68%). Con- tributions of seagrass material were the most important in mudflat SR (90% CI ranging from 8 to 98%) and in seagrass MO (26–79%), where the contributions of microphytobenthos were much lower. SOM Fig. 4.Fatty acid (FA) compositions (relative percentages,n= 1) of composite food sources (i.e. sediment organic matter (SOM) and suspended particulate organic matter (SPOM)) in the mudflats, seagrass beds and sandflat in the Marennes-Oléron Bay (MO) and Sylt-Rømø Bight (SR) in spring and autumn. Data for surface (0–1 cm) and sub-surface layers (1–5 cm) are displayed for detritus and SOM. FAs are grouped according to their marker groups (Table 1) and FAs with relative percentages > 5% (Table A.7 Appendix) are indicated with letters: (a) 14:0, (b) 16:1(n-7), (c) 16:2(n-4), (d) 16:3(n-4), (e) 20:5(n-3), (f)i-15:0, (g)a-15:0, (h) 15:0, (i) 17:1, (j) 18:1(n-7), (k) 22:5(n-3), (l) 22:6(n-3), and (m) 24:0. Empty bars represent the sum of other FAs (< 5%) for each FA marker group. Hierarchical clustering (Ward D2 method, Chi-squared distance) was performed. Approximately unbiased (AU) probability values (p-values) by multiscale bootstrap resampling (n= 10,000) are given under each node and identified clusters (AU˃0.95) are highlighted with grey boxes.
contributions were intermediate in seagrass SR, sandflat SR, seagrass MO and mudflat MO with 90% CI ranging from 1 to 61%. The con- tributions of SPOM and sulfide-oxidizing bacteria as food sources of nematodes were low with 90% CI ranging from 0 to 39% and from 0 to 18%, respectively.
Comparisons of MixSIAR outputs for nematodes from the deep layer at the habitat scale highlighted a higher role of SOM than in the surface layer (Fig. 6, Table A.11 Appendix). SOM represented the most im- portant contributions in mudflat MO, seagrass MO, seagrass SR and sandflat SR with similar 90% CI ranges between 1 and 87%. Never- theless, the contribution of SOM was very low in mudflat SR, where
seagrass material had the highest dietary contribution for deep-layer nematodes (90% CI from 15 to 95%). Seagrass material represented relatively important contributions in the seagrass beds (90% CI from 1 to 63%) while microphytobenthos was an additional important food source of deep layer nematodes in the mudflats and sandflat (0–75%).
As in the surface layers, the contributions of SPOM and of sulfide-oxi- dizing bacteria were relatively low, with 90% CI ranging from 0 to 52%
and from 0 to 33%, respectively.
Benthic copepods revealed a similar pattern of MixSIAR outputs as for nematodes from the surface layer in all habitats (Fig. 6,Table A.11 Appendix). Microphytobenthos represented the highest dietary Fig. 5.δ13C values (mean ± standard deviation,n= 4) of fatty acids 20:5(n-3) (diatom FA marker) and 15:0 (bacteria FA marker) of potential food sources (i.e.
microphytobenthos, suspended particulate organic matter (SPOM), and sediment organic matter (SOM)), nematodes and benthic copepods in the mudflats, seagrass beds and sandflat in the Marennes-Oléron Bay (MO) and Sylt-Rømø Bight (SR). Data for surface (0–1 cm) and sub-surface layers (1–5 cm) are displayed for SOM. Data for surface (0–1 cm) and deep layers (4–5 cm) are displayed nematodes.
Fig. 6.Contributions (%) of sulfide-oxidizing bacteria (BAC), suspended particulate organic matter (SPOM), sediment organic matter (SOM), microphytobenthos (MPB) and seagrass and detrital material (DET) as food sources for nematodes and benthic copepods provided by the stable isotope mixing model MixSIAR. Median, 50% credibility intervals and 90% credibility intervals are displayed by the line, the large box and the smaller box, respectively (Table A.11 Appendix).
contributions to benthic copepods in mudflat MO (90% CI from 53 to 85%), in sandflat SR (39–78%) and in seagrass SR (30–66%). After the model, seagrass material was the most important food source of benthic copepods in mudflat SR (90% CI ranging from 21 to 87%) and in sea- grass MO (25–76%), where contributions of microphytobenthos were much lower. SOM substantially contributed to the food sources of benthic copepods in all habitats with 90% CI ranging from 1 to 54%.
Contributions of SPOM and sulfide-oxidizing bacteria were relatively low with upper limits of 90% CI lower than 30% and 15%, respectively.
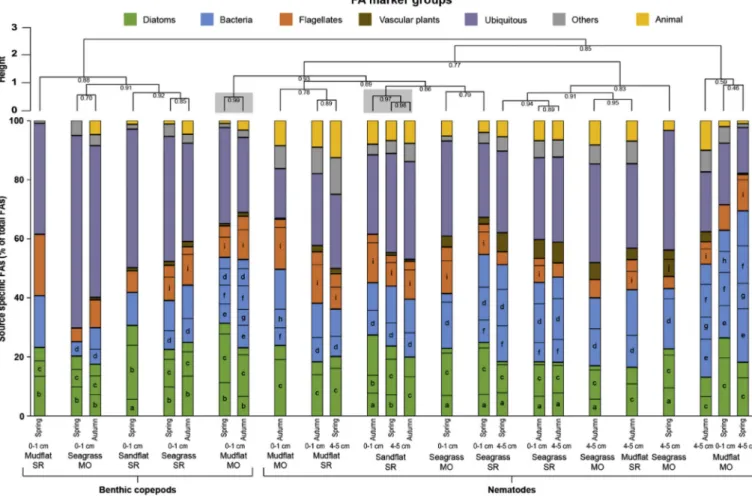
3.3.2. Fatty acid compositions
FA compositions of nematodes were characterized by high propor- tions of bacteria markers (16–51%, mainly 15:0, 17-1(n-9) and 18:1(n- 7)) and diatom markers (13–27%, mainly 20:5(n-3)), as well as ubi- quitous FAs (15–41%) (Fig. 7,Table A.13 Appendix). Benthic copepod FA profiles were composed of relatively high proportions of diatom markers (18–31%, mainly 16:1(n-7) and 20:5(n-3)), bacteria markers (5–30%, mainly 15:0, 17-1(n-9) and 18:1(n-7)), andflagellate markers (5–21%, mainly 22:6(n3)). Ubiquitous FAs represented from 25% to 65% of the FAs in benthic copepods. Nematodes and benthic copepods were not clearly separated based on FA profiles, nevertheless, relative proportions of bacteria markers were generally lower in benthic cope- pods than in nematodes. Relative percentages of vascular plant markers were very low—particularly in benthic copepods—with highest pro- portions measured in nematodes from the seagrass bed SR (4–7%), seagrass MO (6–9%) and mudflat SR (autumn; 4%).
Nematodes from the sandflat had similar FA compositions within seasons and sediment layers. Benthic copepods from the mudflat MO had similar FA compositions within seasons. Comparisons of FA profiles between seasons and sediment layers was hampered by the low quan- tities of material in some samples. The amount of material was indeed too low for nematodes from mudflat SR and sandflat SR in spring, as well as seagrass MO in autumn. It was too low for benthic copepods of mudflat SR and sandflat SR in autumn.
3.3.3. Isotope composition of diatom and bacteria FA markers
20:5(n-3) (i.e. diatom marker) had similarδ13C values in all groups of consumers, i.e. benthic copepods: −19.3‰, nematodes from the surface layer: −18.0‰, and nematodes from the sub-surface layer:
−18.5‰(PERMANOVA, p-value: 0.166;Fig. 5,Table A.12 Appendix).
δ13C values of 20:5(n-3) were also similar for all groups between the two sampling times (PERMANOVA, p-value: 0.61, Table A.12 Appendix) and the sediment layers (pairwise test, p-value: 1.00,Table A.12 Appendix).
As for the 20:5(n-3), 15:0 (i.e. bacteria marker) had similar δ13C values in all groups of consumers, i.e. benthic copepods: −21.1‰, nematodes from the surface layers:−20.8‰, and nematodes from sub- surface layers: −21.9‰ (PERMANOVA, p-value: 0.19,Table A.12 Appendix). δ13C values of 15:0 did not follow any pattern between sampling times (PERMANOVA, p-value: 0.85, Table A.10 Appendix) and sediment layers (pairwise test, p-value: 0.15, Table A.12 Appendix).
Fig. 7.Fatty acids (FAs) compositions (relative percentages,n= 1) of nematodes and benthic copepods in the mudflats, seagrass beds and sandflat in the Marennes- Oléron Bay (MO) and Sylt-Rømø Bight (SR) in spring and autumn. Data for surface (0–1 cm) and deep layers (4–5 cm) are displayed for nematodes. FAs are grouped according to their marker groups (Table 1) and only FAs with relative percentages > 5% (Table A.13 Appendix) are indicated with letters: (a) 14:0, (b) 16:1(n-7), (c) 20:5(n-3), (d) 18:1(n-7), (e) 15:0, (f) 17:1(n-9), (g) 17:0, (h) 19:1(n-9), (i) 22:6(n-3), and (j) 18:2(n-6). Empty bars represent the sum of other FAs (< 5%) for each FA marker group. Hierarchical clustering (Ward D2 method, Chi-squared distance) was performed. Approximately unbiased (AU) probability values (p-values) by multiscale bootstrap resampling (n= 10,000) are given under each node and identified clusters (AU˃0.95) are highlighted with grey boxes.
Carbon isotope compositions of 20:5(n-3) and 15:0 from nematodes and benthic copepods were in the range of those of microphytobenthos and SOM, and much more enriched in13C than those of SPOM.
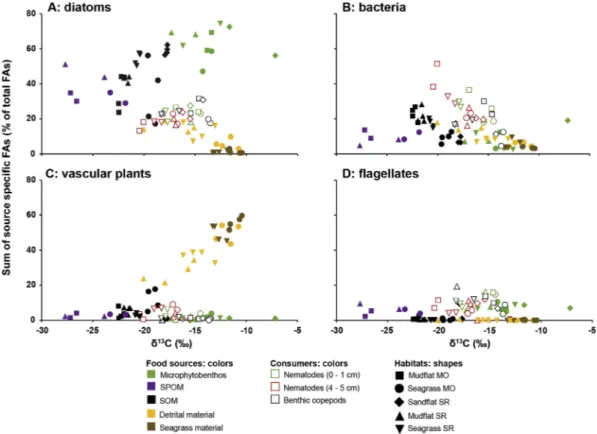
3.4. Two-dimensional analysis on food sources and consumers usingδ13C values and FA compositions
Potential food sources were well separated based on the combina- tion of their carbon isotope compositions and relative percentages of diatom markers (Fig. 8A). Seagrass material and detritus had highδ13C values (from−19.0 to−10.4‰) and had low proportions of diatom markers (0–19%), SPOM had low δ13C values (from −27.6 to
−22.5‰) and intermediate relative percentages of diatom markers (29–51%), and microphytobenthos had highδ13C values (from−17.3 to−7.2‰) and large proportions of diatom markers (47–75%). SOM and SPOM could be relatively well distinguished based on the combi- nation of δ13C values and relative percentages of bacteria markers (Fig. 8B): SPOM had lowδ13C values and relatively low amounts of bacteria markers (5–13%), while SOM was more13C-enriched (from
−22.5 to −17.7‰) or had higher relative proportions of bacteria markers (5–28%). Seagrass material and detritus were well separated from microphytobenthos and composite food sources based on the combination of carbon isotope compositions and relative percentages of vascular plant markers (Fig. 8C). Proportions of vascular plant markers were high in seagrass material (45–60%) and detritus (21–54%), and substantially lower in SOM (1–18%), SPOM (1–4%), and micro- phytobenthos (1–4%). Lastly, the combination of carbon isotope com- positions and proportions of flagellate markers could separate micro- phytobenthos from seagrass material and detritus (Fig. 8D). Whereδ13C values were in the same range, the higher proportions of flagellate markers in microphytobenthos samples (5–11%) separated them from seagrass material (0–1%) and detritus (0–1%).
The combination of consumers’carbon isotope compositions with their relative proportions in diatom, bacteria, vascular plant andfla- gellate FA markers highlighted that nematodes and benthic copepods had very similar compositions, even between different seasons and se- diment layers (Fig. 8).
The low amounts of vascular plant markers (0–9%) in meiofauna clearly separated them from fresh and detrital seagrass material, despite theirδ13C values being in the same range (Fig. 8C). There was also a large difference between SPOM and meiofauna due to the much higher δ13C values of the latter (Fig. 8), which were close to those of benthic food sources (i.e. microphytobenthos, SOM, seagrass and detrital ma- terial). The trophic marker composition of consumers had relatively equal contributions of diatoms (13–31%;Fig. 8A) and bacteria (5–51%;
Fig. 8B) based on FA proportions, while material offlagellate origin contributed to a lower extent (4–21%;Fig. 8D).
Potential food sources demonstrated bacteria/(bacteria + diatom) FA marker ratios ranging from 0.08 to 0.85 (mean: 0.30 ± 0.19, Fig. 9), well separating seagrass material from other potential food sources. Seagrass material indeed had bacteria/(bacteria + diatom) FA marker ratios (0.39–0.58, mean: 0.49 ± 0.10) which were higher than other food sources. Seagrass roots had even higher bacteria/(bac- teria + diatom) FA marker ratios (0.73–0.85, mean: 0.78 ± 0.05).
Microphytobenthos had among the lowest bacteria/(bac- teria + diatom) FA marker ratios ranging from 0.08 to 0.30 (mean:
0.15 ± 0.07). SOM, SPOM and detritus demonstrated relatively si- milar ranges of bacteria/(bacteria + diatom) FA marker ratios with ranges from 0.08 to 0.43 (mean: 0.25 ± 0.11), from 0.18 to 0.38 (mean: 0.29 ± 0.08) and from 0.22 to 0.43 (mean: 0.33 ± 0.09), respectively.
Vascular plant/(vascular plant + diatom) FA marker ratios dis- criminate potential food sources relatively well (Fig. 9). Micro- phytobenthos had among the lowest vascular plant/(vascular Fig. 8.Meanδ13C values (n= 3) and relative percentages of fatty acid (FA) trophic markers (n= 1) of food sources, nematodes and benthic copepods in the mudflats, seagrass beds and sandflat in the Marennes-Oléron Bay (MO) and Sylt-Rømø Bight (SR). Data for surface (0–1 cm) and deep layers (4–5 cm) are displayed for nematodes. FAs were classified according to their trophic marker groups:(A)diatoms,(B)bacteria,(C)vascular plants, and(D)flagellates (seeTable 1). SPOM:
Suspended particulate organic matter, SOM: Sediment organic matter.
plant + diatom) FA marker ratios ranging from 0.12 to 0.42 (mean 0.21 ± 0.10). SOM had generally higher vascular plant/(vascular plant + diatom) FA marker ratios (0.25–0.71, mean: 0.39 ± 0.13).
SPOM demonstrated relatively higher vascular plant/(vascular plant + diatom) FA marker ratios (0.39–0.65, mean: 0.50 ± 0.10) compared to microphytobenthos. Detrital material was well dis- tinguished from microphytobenthos, SOM and SPOM with much higher vascular plant/(vascular plant + diatom) FA marker ratios (0.77–0.92, mean: 0.84 ± 0.07). Seagrass leaves and roots were even more dis- tinguished from microphytobenthos, SOM and SPOM and detritus with even higher vascular plant/(vascular plant + diatom) FA marker ratios for seagrass leaves (mean: 0.96 ± 0.02) and roots (mean:
0.98 ± 0.01).
Consumers had moderate mean bacteria/(bacteria + diatom) FA marker ratios for surface layer nematodes (mean: 0.56 ± 0.13), deep layer nematodes (mean: 0.55 ± 0.07), and benthic copepods (mean:
0.39 ± 0.11) (Fig. 9). These ratios for consumers were much higher than the values measured in all potential food sources except for sea- grass roots. Consumers had low vascular plant/(vascular plant + diatom) FA marker ratios (surface layer nematodes: 0.00–0.28, mean: 0.11 ± 0.12, deep layer nematodes: 0.03–0.28, mean:
0.15 ± 0.10, and benthic copepods: 0.00–0.07, mean: 0.03 ± 0.02), in the range of those measured in microphytobenthos and SOM. Within consumers, benthic copepods had the lowest range of vascular plant/
(vascular plant + diatom) FA marker ratios, while ratios of nematodes from the surface- and deep layers were in the same range.
4. Discussion
4.1. Distinction of microphytobenthos and seagrass material based on FA profiles
Seagrass material and microphytobenthos were well separated based on their FA profiles, whereas the discrimination of these food sources using theirδ13C andδ15N values was very difficult. The mean δ13C values of microphytobenthos (−17.3 to−7.2‰), seagrass leaves (−13.1–10.4‰) and seagrass roots (−13.3–10.6‰) were indeed very close, as already observed (Lebreton et al., 2011; Riera et al., 1996;
Rzeznik-Orignac et al., 2008). Microphytobenthos contained large
amounts of diatom markers (i.e. 20:5(n-3), 16:1(n-7), and 16:4(n-1)), which confirmed the dominance of diatoms in its composition of mi- crophytobenthos (Asmus, 1983). Low to moderate amounts of bacteria markers in microphytobenthos FA profiles could be explained by the presence of heterotrophic bacteria, generally interacting with diatoms in microalgae mats (Agogué et al., 2014). Such a FA composition was in contrast to those ofZ. noltii leaves and roots which exhibited large proportions of vascular plant markers (i.e. 18:2(n-6), 18:3(n-3), and 24:0) (Lebreton et al., 2011). The discrimination between micro- phytobenthos and seagrass material becomes even clearer when con- sidering ratios of vascular plant/(vascular plant + diatom) FA markers and of bacteria/(bacteria + diatom) FA markers.
Detrital material had similar isotope compositions and FA profiles than seagrass leaves and roots indicating that it mostly originated from decaying seagrass. Because seagrass derived detrital material can be stored into the sediment (Duarte and Cebrián, 1996), it is then poten- tially available to endofauna. Additionally, the moderate proportions of vascular plant markers in the detrital material from the mudflat of the Sylt-Rømø Bight indicated that seagrass material can also be trans- ported and stored in adjacent systems (van der Heijden et al., 2018).
4.2. Distinction of SPOM, SOM and primary producers based on bulk and FA isotope compositions
Carbon isotope compositions of SPOM (−27.6‰to−22.5‰) were much more 13C-depleted than microphytobenthos (−17.3‰ to
−7.2‰) and seagrass material (−19.0‰to −10.4‰), and clearly separated SPOM from these food sources. SPOM was mostly made of diatoms and, to a minor extent, of bacteria as highlighted by FA pro- files. Higher proportions of flagellate markers occurred in SPOM in spring compared to autumn (Lebreton et al., 2011), which is most likely linked to the annual spring bloom of phytoplankton (Galois et al., 1996). Lowδ13C values of the diatom marker 20:5(n-3) indicated that diatoms in SPOM mostly originated from pelagic sources (Braeckman et al., 2015). As for diatoms, bacteria in SPOM relied mainly on pelagic sources as indicated by the lowδ13C values of the bacteria marker 15:0.
These outcomes indicate a poor resuspension of benthic organic mate- rial in the two studied seasons, and therefore a minor benthic-pelagic coupling in both ecosystems. Inputs of phytoplankton for several Fig. 9.Relative proportions of vascular plant fatty acid (FA) markers over the sum of vascular plant and diatom FA markers (x-axis) and bacteria FA markers over the sum of bacteria and diatom FA markers (y-axis) of potential food sources, nematodes and benthic copepods in the mudflats, seagrass beds and sandflat in the Marennes-Oléron Bay (MO) and Sylt-Rømø Bight (SR). FAs were classified according to their trophic marker group (seeTable 1). L: seagrass leaves, R: seagrass roots.
habitats might therefore be overestimated in food web models of the Marennes-Oléron Bay (Leguerrier et al., 2003;Saint-Béat et al., 2014) and the Sylt-Rømø Bight (Baird et al., 2007).
δ13C values of SOM (−22.5‰to−17.7‰) were similar to previous observations from mudflats (Rzeznik-Orignac et al., 2008), seagrass beds (Lebreton et al., 2011; Vafeiadou et al., 2014) and sandflats (Cnudde et al., 2015;Moens et al., 2005) and demonstrated no tem- poral patterns as in previous observations (Lebreton et al., 2012,2011;
Riera et al., 1996). The intermediateδ13C values of SOM limited de- termining the contributions of the different primary producers in SOM composition, clearly highlighting the importance of the combination of SI and FA markers. Based on FA analyses, SOM was mostly made up of diatoms and bacteria, with very low contributions of seagrass or ter- restrial material, even in seagrass beds where the load of seagrass material in the sediment was high (Lebreton et al., 2011; van der Heijden et al., 2018). Diatoms from the SOM mainly originated from the microphytobenthos, as highlighted by the highδ13C values of the diatom marker 20:5(n-3) (i.e. close to those of microphytobenthos). A similar pattern was found for bacteria: δ13C values of the bacteria marker 15:0 in SOM indicated they used benthic primary producers, i.e.
microphytobenthos, as a substrate (Boschker et al., 2000). Such results highlight the poor role of trapped material from the water column into the SOM, confirming the minor benthic-pelagic coupling between SPOM and SOM in the different studied habitats.
SOM compositions differed between habitats, with a much higher influence of diatoms in the SOM from the sandflat of the Sylt-Rømø Bight (van der Heijden et al., 2018), as demonstrated by its higherδ13C values and higher proportions of diatom FA markers. Isotope compo- sitions of SOM also varied between sediment layers with SOM being more depleted in13C in the sub-surface layers, as already observed in the Schelde estuary (Moens et al., 2014). Such variations can be related to a higher contribution of microphytobenthos (more 13C-enriched;
Dubois et al., 2012) in the surface layer and/or to a higher load of seagrass detrital material in the sub-surface layers. Detrital material generally has lower δ13C values than its fresh counterpart (Lebreton et al., 2011), as less labile compounds (e.g. lignin) are depleted in13C (Benner et al., 1987). Another explanation could be the higher abun- dances of sulfide-oxidizing bacteria—characterized by very lowδ13C values (Robinson and Cavanaugh, 1995)—in the deeper sediment layers (Wieringa et al., 2000).
4.3. Limited use of SPOM by nematodes and benthic copepods
Outputs of the mixing models indicated that contributions of SPOM as a food source to nematodes and benthic copepods were very low, due to the much higherδ13C values of meiofauna compared to SPOM (be- tween 6.3 and 10.7‰higher). The limited use of diatoms and bacteria from SPOM by meiofauna is confirmed by theδ13C values of the diatom marker 20:5(n-3) and of the bacteria marker 15:0, which are much higher in nematodes and benthic copepods than in SPOM. Low con- tribution of SPOM as a food source to nematodes and benthic copepods is evident in all habitats (i.e. vegetated and bare), even in seagrass beds where increased sedimentation of SPOM occurs (Ouisse et al., 2012).
Such a poor role of SPOM as a food source for meiofauna is in ac- cordance with previous studies carried out in mudflats and sandflats (Moens et al., 2014, 2005; Rzeznik-Orignac et al., 2008). Low con- tribution of SPOM as a food source is also in agreement with the findings ofMaria et al. (2011), who stated that meiofauna prefer locally produced benthic diatoms over marine pelagic food sources. This could be related to phytoplankton generally having higher fluctuations in biomass and production compared to other food sources (Galois et al., 1996) as well as to the ability of meiofauna to be more selective for food sources compared to their potential food competitors, i.e. macrofauna (Maria et al., 2012,2011).
4.4. Limited use of seagrass material by nematodes and benthic copepods Contributions of fresh and detrital seagrass material (Z. noltii) as food sources to nematodes and benthic copepods were very low, as highlighted by the very low proportions of vascular plant FA markers in nematodes and benthic copepods, even in seagrass beds where loads of seagrass material were high (van der Heijden et al., 2018). The low use of seagrass material is much likely related to its poor nutritional value and high lignocellulose content (Vizzini et al., 2002). Such results are in contradiction with the outputs of the mixing models, which indicated moderate to high contributions of seagrass material to nematodes and benthic copepods, due to the closeδ13C values between this food source and meiofauna. The role of the seagrass material for meiofauna and, by extension, to coastal food webs is still under debate (Mateo et al., 2006).Leduc et al. (2009)demonstrated the significant contribution of seagrass detritus as a food source to meiofauna based on isotope com- positions of potential sources and meiofauna, as well as FA profiles of fine SOM. Using stable isotope mixing models,Lebreton et al. (2012) andVafeiadou et al. (2014)suggested that seagrass detritus could be a potential food source but highlighted someflaws related to overlapping isotope compositions of microphytobenthos and seagrass material, leading to possibly overestimated contributions of seagrass material to the diet of meiofauna. Nevertheless, it has to be mentioned that Vafeiadou et al. (2014)discriminated nematodes at the genus level, which could reveal certain taxa to rely more on seagrass material. In this study, considering nematodes as a bulk may have led to a lowering of the role of seagrass material for some genus or species, as these were grouped with all other nematodes. As a result, our study highlights the importance of combining stable isotopes and fatty acids, preferably for nematodes at the genus level, to better describeflows of organic matter, particularly when some food sources have close isotope compositions (which is often the case in coastal ecosystems). Especially combining stable isotopes and fatty acids in mixing models could provide com- plementary information in the form of more defined proportional dietary contributions. Using both isotope compositions and fatty acid profiles, we clearly demonstrated that seagrass material is poorly used by meiofauna, as previously also demonstrated for macrofauna (Jaschinski et al., 2008;Lebreton et al., 2011), raising questions about the fate of this material in coastal ecosystems. Potential destinations of this material could be burial of seagrass material into the deeper sedi- ment (Duarte and Cebrián, 1996), exportation out of the system (Mateo et al., 2006;McLusky and Elliott, 2004), consumption by higher trophic levels such as herbivorous birds (Baird et al., 2007;Pacella et al., 2013), decomposition by microorganisms which can be consumed by higher trophic levels (Fuhrman, 1992; Tenore et al., 1982) and/or decom- position by microorganisms which are not consumed, thus leading to a trophic dead end (Blum and Mills, 1991;Peduzzi and Herndl, 1991).
Combining isotope compositions and fatty acid profiles of deeper se- diment is a unique tool when determining the fate of this material.
4.5. Importance of microphytobenthos and bacteria as food sources to nematodes and benthic copepods
The important role of diatoms was demonstrated by the high pro- portions of diatom markers in the FA profiles of consumers and the large contributions of microphytobenthos to meiofauna as estimated by the mixing models. The closeδ13C values of the diatom marker 20:5(n- 3) from microphytobenthos and meiofauna, much more13C-enriched than those of SPOM, confirmed that diatoms used by meiofauna origi- nated from the benthos. Outputs of the mixing models are moreover likely underestimating the contribution of the microphytobenthos as a food source to meiofauna because SOM is the mixture of all benthic food sources and contains some microphytobenthos. The importance of microphytobenthos to meiofauna has been observed before in bare in- tertidal habitats (Carman and Fry, 2002; Leduc et al., 2009; Moens et al., 2014,2005;Rzeznik-Orignac et al., 2008) as well as vegetated