A P P L I E D E C O L O G Y Copyright © 2017 The Authors, some rights reserved;
exclusive licensee American Association for the Advancement of Science. No claim to original U.S. Government Works. Distributed under a Creative Commons Attribution NonCommercial License 4.0 (CC BY-NC).
Environmental controls on modern scleractinian coral and reef-scale calcification
Travis A. Courtney,1* Mario Lebrato,1,2Nicholas R. Bates,3,4 Andrew Collins,3 Samantha J. de Putron,3Rebecca Garley,3Rod Johnson,3Juan-Carlos Molinero,5 Timothy J. Noyes,3Christopher L. Sabine,6Andreas J. Andersson1
Modern reef-building corals sustain a wide range of ecosystem services because of their ability to build calcium carbonate reef systems. The influence of environmental variables on coral calcification rates has been extensively studied, but our understanding of their relative importance is limited by the absence of in situ observations and the ability to decouple the interactions between different properties. We show that temperature is the primary driver of coral colony (Porites astreoidesandDiploria labyrinthiformis) and reef-scale calcification rates over a 2-year monitoring period from the Bermuda coral reef. On the basis of multimodel climate simulations (Coupled Model Intercomparison Project Phase 5) and assuming sufficient coral nutrition, our results suggest thatP. astreoidesand D. labyrinthiformiscoral calcification rates in Bermuda could increase throughout the 21st century as a result of gradual warming predicted under a minimum CO2emissions pathway [representative concentration pathway (RCP) 2.6] with positive 21st-century calcification rates potentially maintained under a reduced CO2emissions pathway (RCP 4.5). These results highlight the potential benefits of rapid reductions in global anthropogenic CO2emissions for 21st-century Bermuda coral reefs and the ecosystem services they provide.
INTRODUCTION
Tropical coral reef ecosystems provide humanity with a range of direct (tourism and fishing), indirect (shoreline protection and fisheries re- cruitment), and nonuse (biodiversity and intrinsic value) ecosystem services (1). The structure of these ecosystems is maintained by net pos- itive production of calcium carbonate (CaCO3), with scleractinian corals accounting for the majority of the total coral reef CaCO3pro- duction (2). Current estimates suggest that there are fewer than 1000 zooxanthellate hermatypic scleractinian coral species sustaining the structural habitat that covers just 0.2% of the total ocean surface area and yet supports an estimated 35% of all species living in the global oceans (3).
The geologic record shows the onset of large and widespread coral reef accretion dating back to the late Triassic (~230 million years ago), when scleractinian corals are hypothesized to have first acquired pho- tosynthetic zooxanthellae symbionts (4). This symbiosis allowed corals to expand geographic ranges (4) due to the algal symbionts providing upward of 100% of the daily respiratory carbon needed to sustain the modern coral host (5). The efficiency of this symbiosis allows corals to maintain primary productivity rates (8.0 to 40.0 g C m−2day−1) that are orders of magnitude higher than adjacent ocean water primary pro- ductivity (0.01 to 0.65 g C m−2day−1) (5).
Energy requirements for calcification initially suggest that photo- synthesis is a key driver of coral calcification rates (5); however, coral calcification depends on a broad range of environmental variables, in- cluding seawater temperature, seawater carbonate chemistry, light and depth, food availability, nutrients, water flow rates, sedimentation, and competition (2). Although laboratory experiments have successfully
established relationships between coral calcification rates and indepen- dently altered environmental parameters (for example, temperature, light, pH, and seawater saturation state with respect to aragonite,WA= [Ca2+][CO32−]/Ksp), comparatively fewer studies have explored the combined effects and/or the relative importance of these parameters under controlled laboratory conditions (6,7) or under naturally var- iable in situ conditions (2,8–11). The ability to measure and establish the relative importance of different drivers of calcification in the field is limited by the capacity to adequately monitor relevant properties sim- ultaneously for extended periods of time (12) and to decouple the range of highly correlated and interdependent interactions between environ- mental factors (Fig. 1) (8). For example, temperature not only directly influences coral calcification rates but also strongly controls seawater pH andWA, which are both hypothesized to be independently im- portant drivers of coral calcification (Fig. 1) (13). Temperature is also directly related to light availability and season, which affect coral cal- cification directly via light-enhanced calcification (Fig. 1) (2,10) and indirectly via increased food availability resulting from seasonal patterns in oceanic primary production (Fig. 1) (2,14). Characterizing the mech- anisms and the relative importance of different drivers of coral calcifi- cation rates both in the current natural environment and under future ocean warming and acidification is essential for understanding how coral reefs calcify at present and for predicting how calcification rates and cor- al reef accretion will change under predicted near-future conditions.
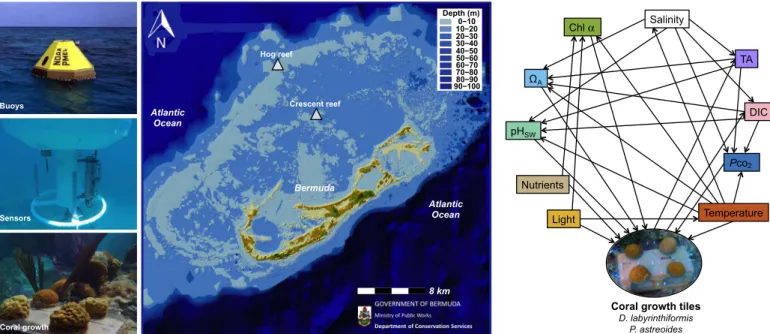
The Bermuda coral reef is located at the northern limit of coral reefs in the North Atlantic Ocean (Fig. 1). Because of its relatively high latitude (32°N), Bermuda experiences greater seasonal differences and variations in environmental parameters than reefs located closer to the equator (15). Therefore, the Bermuda coral reef provides an excellent natural laboratory to explore the relationships between coral calcifica- tion rates and multiple environmental parameters. Over a 2-year period (August 2010 to September 2012), in situ environmental properties {temperature, seawater carbonate chemistry [dissolved inorganic car- bon (DIC), total alkalinity (TA), partial pressure of CO2(PCO2), pHsw, WA], light, chlorophylla, and inorganic nutrients} were characterized alongside coral calcification rates by two scleractinian reef-building
1Scripps Institution of Oceanography, University of California, San Diego, La Jolla, CA 92093, USA.2Christian-Albrechts-University Kiel, Kiel, Germany.3Bermuda Institute of Ocean Sciences, St. George’s, Bermuda.4Department of Ocean and Earth Science, National Oceanography Centre Southampton, University of Southampton, Southampton, UK.5GEOMAR Helmholtz Center for Ocean Research, Marine Ecology/Food Webs, Kiel, Germany.6Pacific Marine Environmental Laboratory, National Oceanic and Atmospheric Administration, Seattle, WA 98115, USA.
*Corresponding author. Email: traviscourtney@gmail.com
on January 5, 2018http://advances.sciencemag.org/Downloaded from
corals,Porites astreoidesandDiploria labyrinthiformis, at two distinct reef environments. Colonies ofP. astreoidesandD. labyrinthiformiswere transplanted onto tiles at a rim reef environment, Hog Reef, and an outer lagoon reef environment, Crescent Reef (n= 24 colonies per species per site; Fig. 1), and buoyant-weighed every 2 to 3 months to measure in situ calcification rates (16). In addition, net ecosystem calcification (NEC = gross calcification−gross CaCO3dissolution) for Hog Reef was cal- culated based on alkalinity anomalies (17) using monthly surface seawater TA samples and monthly offshore surface seawater TA from the Bermuda Atlantic Time-series Study (BATS) site (18) combined with estimates of seawater residence time (19). Assuming that calcification and CaCO3
dissolution are the only processes significantly influencing salinity- normalized seawater TA, this variable serves as a direct proxy of NEC and changes in a ratio of 2:1 for every net mole of CaCO3deposited (17).
RESULTS
Observations of environmental controls and calcification The data reveal a strong seasonal pattern in environmental variables and coral calcification rates over the 2-year study period (Fig. 2 and fig. S1). Light varied seasonally, with the lowest light intensity around January and the highest light intensity around June to July. Temperature lagged light intensity by 1 to 2 months, and maximum seawater tem- peratures were observed between August and October (Crescent Reef maximum temperature = 30.7° ± 0.1°C), whereas minimum seawater temperatures occurred from January to March (Hog Reef minimum temperature = 18.2° ± 0.1°C). Seasonal variability in seawater tempera- ture and light was greater for Crescent Reef (Dtemperature = 12.4°C, Dlight = 13,500 lux) than for Hog Reef (Dtemperature = 11.9°C,Dlight = 6100 lux). Surface seawaterPCO2was highest in the summer (Hog Reef maximumPCO2= 652matm), well exceeding equilibrium with the at- mosphere, whereas pHswwas lowest in the summer (Hog Reef min- imum pHsw= 7.93). The opposite trends were observed during winter (Hog Reef minimumPCO2= 303matm, maximum pHsw= 8.14).
These observed seasonal variations inPCO2and pHswcan mainly be explained by the seasonal variability in temperature (for example, warming explains 96 ± 3% ofDPCO2and 90 ± 3% ofDpHswobserved between 8 September 2010 and 25 February 2011). SeawaterWAdid not follow a strong seasonal variation similar toPCO2and pHsw, al- though minimum and maximum values were observed in the winter and summer, respectively, ranging from 3.09 to 3.93 at Hog Reef.
Reef seawater DIC and TA were strongly depleted in the summer relative to offshore, reflecting the uptake of DIC and calcium used for reef-scale net organic carbon production and net calcification. Seasonal variability in seawater carbonate chemistry was greater for Hog Reef (DPCO2= 349matm,DpHsw= 0.22,DWA= 0.84) than for Crescent Reef (DPCO2= 213matm,DpHsw= 0.19,DWA= 0.70), primarily due to higher biomass relative to water volume driving greater reef metabolic effects on the water column at Hog Reef (that is, mean ± SE hard coral cover of 28 ± 1% versus 13 ± 1% at Crescent Reef) (20).
Notably, independently measured colony weight–normalized calcification rates ofP. astreoidesandD. labyrinthiformiscolonies followed a similar seasonal variability with maximum rates observed from August to November and minimum rates observed from February to April. All forms of inorganic nitrogen, silica, and phosphorus re- mained low throughout the year but with occasional pulses (fig. S1).
Monthly satellite chlorophylladid not show strong seasonal variability at Hog Reef and Crescent Reef (fig. S1). Thus, maximum rates of both coral and reef-scale calcification appear to lag light intensity but coincide with maxima of seawater temperature,PCO2, andWAand minimum pHsw. The seemingly paradoxical calcification maxima under seawaterPCO2maximum and pHswminimum contradict the traditional understanding of the effects of seawater acidification on calcification (13), including a previous preliminary study conducted in the same area (21), but agree with recent studies that show that calcification can in- crease up to a thresholdPCO2and pH if corals are adequately fed (6,7) or ifPCO2-pH conditions are within the natural variability experienced by the coral (22).
Buoys
Sensors
Coral growth
Hog reef
Crescent reef
Atlantic Ocean
8 km Atlantic
Ocean
Bermuda
Chl α
A
Nutrients pHSW
Light
Salinity
TA
DIC
Pco2
Temperature
Coral growth tiles D. labyrinthiformis
P. astreoides Depth (m)0−10
10−20 20−30 30−40 40−50 50−60 60−70 70−80 80−90 90−100
Fig. 1. Map of Bermuda study sites and environmental controls on calcification.The buoy, sensors, and in situ growth are presented next to a bathymetry map of Bermuda showing the locations of Hog Reef and Crescent Reef. Structural equation modeling (SEM) connections show the interactions between environmental drivers and their effect on coral calcification. Chla, chlorophylla. (The Bermuda Map is courtesy of M. Shailer of the Department of Conservation Services, Government of Bermuda.)
S C I E N C E A D V A N C E S | R E S E A R C H A R T I C L E
on January 5, 2018http://advances.sciencemag.org/Downloaded from
Evaluating the relative importance of environmental controls on calcification
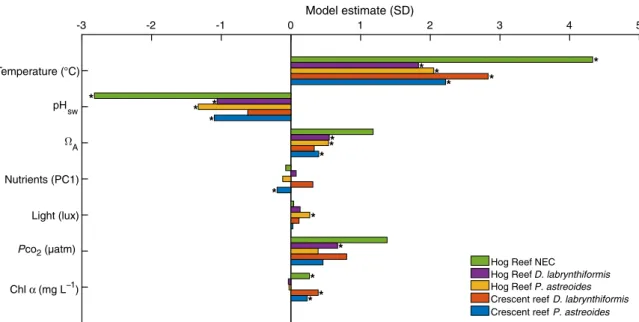
In an attempt to evaluate the relative importance and the interactive effects between environmental variables on colony and reef-scale calci- fication rates (Fig. 1), an SEM (Structural Equation Modeling) approach was used (23). This approach numerically solves the complex interac- tions between biotic and abiotic drivers of calcification to quantify both the direct and indirect effects of the measured environmental parameters on coral calcification. The model estimate for each reef driver (that is, temperature, pHsw,WA,PCO2, light, nutrients, and chlorophylla) repre-
sents the change in SDs in calcification explained for each SD increase in reef driver (Fig. 3 and table S1). Temperature was the only variable with significant model estimates for both species at both reef sites and NEC at Hog Reef and yielded the greatest per-SD change in coral calcification rates with calcification across the five models, increasing by 2.1 to 4.3 SDs for a single SD increase in temperature. Compared to temperature, the model estimates for the other environmental pa- rameters (pHsw,WA,PCO2, light, nutrients, and chlorophylla) yielded smaller per-SD changes and failed to yield significant predictors for all five models (Fig. 3 and table S1). Notably, seawater pHswandWA Fig. 2. Hog Reef and Crescent Reef environmental data and coral calcification rates.Both environmental parameters and calcification reveal strong seasonal trends in this high-latitude (32°N) coral reef system. ForPCO2plots, blue denotes measured seawaterPCO2, gray indicates measured atmosphericPCO2, and open circles represent seawaterPCO2 calculated from DIC and TA bottle samples. For TA and DIC plots, dark gray triangles represent BATS seawater DIC and TA, pink circles represent reef seawater DIC, and purple circles represent reef seawater TA. For the coral growth rate plots, purple circles representP. astreoidesand green triangles representD. labyrinthiformiseach with ±1 SD. Gray circles with the blue axis represent calculated NEC ± uncertainty.
on January 5, 2018http://advances.sciencemag.org/Downloaded from
produced significant predictors of calcification, but with pHswyielding significant, negative predictors of calcification (that is, decreasing pH is correlated with increasing calcification; see subsequent discussion) for four of the five SEM models at approximately one-half of the main effect of temperature (Fig. 3 and table S1). Chlorophyllaproduced small but significant predictors of coral calcification at Crescent Reef and NEC at Hog Reef, whereas light,PCO2, and nutrients each failed to yield signif- icant predictors of calcification for more than one of the SEM models (Fig. 3 and table S1).
Because of the narrow range ofWAseasonal variability and highly coupled seawater pH and temperature observed during the in situ study, we performed an additional mesocosm experiment to further explore the effects of seawater carbonate chemistry on coral calcification. This mesocosm experiment was run in parallel with the in situ incubations for 3 months of the full 2-year in situ experiment using the same coral species and at three different seawater pHswconditions (mean pHsw± SD = 8.0 ± 0.1, 7.8 ± 0.1, and 7.6 ± 0.1). Linear models for the calcifi- cation rates ofP. astreoidesandD. labyrinthiformisfailed to yield signif- icant correlations between coral calcification rates and reduced seawater pHsw(7.6 ± 0.1) orWA(1.5 ± 0.5) relative to ambient conditions, when food was available (table S3). This finding adds to the growing literature finding that heterotrophy confers resistance to coral calcification under acidified conditions (7,14). In contrast, coral calcification rates dur- ing the mesocosm experiment appeared more strongly correlated with temperature, lending support to the findings from the 2-year in situ experiment that seasonal calcification rates ofP. astreoidesand D. labyrinthiformisfrom Bermuda are more strongly controlled by seawater temperature when adequate nutrition is available (14).
Predicting future coral reef calcification
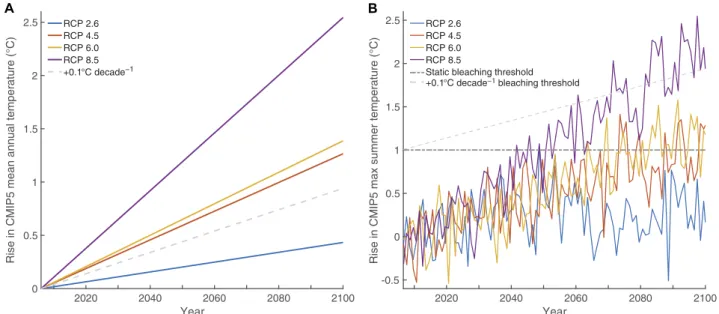
To evaluate the effect of future warming on BermudanP. astreoidesand D. labyrinthiformiscoral calcification rates, data from Coupled Model Intercomparison Project Phase 5 (CMIP5) multimodel climate simula- tions (24) using representative concentration pathways (RCPs) of +2.6, +4.5, +6.0, and +8.5 W m−2radiative forcing relative to preindustrial levels (25) were used to simulate sea surface temperature (SST) warming
rates over the 21st century in Bermuda (Fig. 4). Linear regressions of the CMIP5 model SST predictions relative to a +0.1°C decade−1rate of warming previously observed to increase calcification in high-latitude Poritescorals (26) show that only the most conservative emissions pathway, RCP 2.6, yields a rate of warming (+0.05°C decade−1) less than +0.1°C decade−1, suggesting that coral calcification rates could continue to increase in Bermuda under this emissions pathway (Fig. 4A). The +0.4°C end-of-21st-century seawater warming predicted for Bermuda under RCP 2.6 was combined with linear calcification responses to tem- perature forP. astreoides,D. labyrinthiformis, and Hog Reef NEC from the 2-year in situ study to predict potential changes in calcification rates under this reduced emissions pathway. Assuming that these relation- ships remain fixed over the coming century, no thermal optima are ex- ceeded, and other environmental controls remain constant, the models suggest thatP. astreoidesandD. labyrinthiformiscould increase by ~2 to 4% and Hog Reef NEC could increase by ~6%. The onset of coral bleaching typically occurs when warming equates to a degree heating month (DHM), wherein monthly mean SSTs exceed the maximum monthly mean climatology by 1°C with more extreme bleaching and coral mortality occurring for an annual accumulation of two DHMs (27). The CMIP5 maximum summer temperatures relative to the time period 2006–2016 show that RCP 2.6 is the only emissions scenario in which Bermudan corals are predicted to escape regular, severe coral bleaching by the end of the century on the basis of the static 1°C DHM bleaching threshold (Fig. 4B).
DISCUSSION
The positive effects of temperature,WA, and chlorophylla(assuming this serves as a proxy for available coral nutrition) on coral calcifi- cation rates are consistent with previous laboratory and field studies (2,6,7,10–13), whereas the lack of correlation with light and the predicted positive effects owing to decreasing pH are inconsistent with anticipated results (2,10,13,28). However, one has to remain circum- spect about these results because the SEM is not able to elucidate func- tional relationships and is most likely unable to decouple the dominant
-3 -2 -1 0 1 2 3 4 5
Model estimate (SD)
Chl α (mg L−1) Pco2 (µatm)
Light (lux) Nutrients (PC1) A pHsw
Crescent reef P. astreoides Crescent reef D. labrynthiformis Hog Reef P. astreoides Hog Reef D. labrynthiformis Hog Reef NEC
*
* * *
*
* * *
*
* **
*
*
*
*
** Temperature (°C)
Fig. 3. Model estimates from the structural equation models.Each model estimate represents the SD change in calcification driven by a 1 SD increase in the given environmental parameter. Statistically significant model estimates (P< 0.05) are marked by stars.
S C I E N C E A D V A N C E S | R E S E A R C H A R T I C L E
on January 5, 2018http://advances.sciencemag.org/Downloaded from
effects of temperature on calcification rates and pH/WAfrom the poten- tially subtler effects of these carbonate chemistry parameters on calcifi- cation (9). Also, time lags between determinant properties and response variables, such as light intensity and calcification, could muddle the pre- dictive capacity of different variables.
The temperature-induced control and seasonal increase ofP. astreoides andD. labyrinthiformiscoral calcification rates observed here partly agree with previous laboratory experiments and field observations, which suggest that calcification has a parabolic response to increasing seawater temperature (2,12). In contrast, the present NEC and in situ calcifi- cation data appear to increase across the full range of seasonal tem- peratures, thereby suggesting that the thermal optima of the parabolic temperature–calcification response curves have not been exceeded during the 2-year study (2). Note that the in situ calcification responses to temperature may in part be affected by the coarse temporal resolution of calcification measurements (2- to 3-month skeletal growth intervals) relative to the time scales for summer seawater temperature maxima but that NEC measurements in this study reflect temperature responses over the much shorter multiday seawater residence times at Hog Reef (19). Irrespective of this, the temperature correlations in this study sug- gest that peak summer seawater temperatures are not limiting calcifica- tion via thermal stress and, instead, that calcification rates are more strongly limited by cooler winter seawater temperatures (15). This implies that BermudanP. astreoidesandD. labyrinthiformiscoral cal- cification rates may increase with gradual ocean warming as has been suggested based on the analysis of interannual calcification rates from coral cores for other high-latitude coral reef environments (2). For ex- ample, a +0.1°C decade−1rate of warming yielded a 23.7% increase in calcification rates for high-latitude (28°C)Poritescorals in the Houtman Abrolhos Islands off the coast of Western Australia over a 110-year period (26). Conversely, the slopes of the calcification responses to temperature in this study suggest only a ~2 to 4% increase in coral cal- cification rates due to the +0.05°C decade−1warming in Bermuda pre- dicted for RCP 2.6. This potential increase is much lower than the +23.7% previously observed by Cooperet al. (26), suggesting that fur-
ther research should be conducted to understand the mechanisms of coral calcification responses owing to gradual ocean warming (that is,
≤+0.1°C decade−1) and to bridge the varying insights gained from con- ducting laboratory experiments, in situ growth experiments, and inter- annual coral coring studies.
However, the benefits of gradual future warming must be weighed against the reduced calcification and potential mortality owing to coral bleaching (2,10–12). For example, note that, following the coring study of Cooperet al. (26), an anomalous +5°C heat wave in 2010–2011 caused coral bleaching in the Houtman Abrolhos Islands, with 22 ± 2.7% (mean ± SE) of corals bleached and a corresponding 11.3 ± 6.9% (mean ± SE) decline in overall coral cover (29). In Bermuda, there are no recorded widespread bleaching-induced mortalities, reductions in coral cover, or changes in coral community composition, but there have been some observations of coral diseases and periodic mild coral bleaching since 1988 (≤20% of some coral species bleached) followed by subsequent post-bleaching recovery (15). It remains unclear whether the absence of extreme bleaching events in Bermuda is due to Bermudan reefs thus far escaping intense thermal stress events or resisting thermal stress through adaptation or acclimation [for example, see discussion of Great Barrier Reef bleaching patterns in the study of Hugheset al. (30)].
On the basis of the 1°C DHM static bleaching threshold (27) and the CMIP5 climate data for Bermuda, no frequent, severe bleaching is pre- dicted for BermudanP. astreoidesandD. labyrinthiformiscorals under RCP 2.6 (Fig. 4B). However, given the recent history of mild coral bleaching events (≤20% of some coral species bleached) in Bermuda (15), it is likely that mild bleaching may continue in the 21st century unless Bermudan corals adapt or acclimate to these mild thermal stress events.
Nonetheless, the gradual warming and absence of predicted 21st-century frequent, severe coral bleaching under RCP 2.6 in this analysis support the hypothesis that BermudanP. astreoidesandD. labyrinthiformiscalcifi- cation rates could increase under RCP 2.6 throughout the 21st century with continued adequate nutrition.
However, a recent integrated assessment model utilizing recent es- timates for fossil fuel resources found a 100% likelihood of exceeding
2020 2040 2060 2080 2100
Year 0
0.5 1 1.5 2
2.5 RCP 2.6 RCP 4.5 RCP 6.0 RCP 8.5 +0.1°C decade−1
2020 2040 2060 2080 2100
Year -0.5
0 0.5 1 1.5 2
2.5 RCP 2.6 RCP 4.5 RCP 6.0 RCP 8.5
Static bleaching threshold bleaching threshold−1
A B
Rise in CMIP5 mean annual temperature (°C) Rise in CMIP5 max summer temperature (°C) +0.1°C decade
Fig. 4. Climate model projections for Bermuda.Monthly CMIP5 model SST data were aggregated for Bermuda under RCP emissions pathways. (A) Mean rise in monthly SSTs predicted for Bermuda until 2100. The dashed line represents the +0.1°C decade−1rate of potential coral acclimatization based on increasing calcification rates observed in 20th- century East Indian OceanPoritescoral cores (25). (B) Rise in maximum summer temperatures for each RCP emissions pathway relative to the 1°C coral bleaching threshold above maximum summer 2006–2016 model climatology assuming no acclimatization (Static Bleaching Threshold) and assuming a +0.1°C decade−1acclimatization rate.
on January 5, 2018http://advances.sciencemag.org/Downloaded from
warming provided by RCP 2.6, 92% for RCP 4.5, 42% for RCP 6.0, and 12% for RCP 8.5 (31). The Paris Agreement came into effect in No- vember 2016 following this likelihood analysis, providing an alternative pathway for individual signatory countries to collectively reduce CO2
emissions to limit global warming to well below 2°C above pre- industrial levels. A 150% greater commitment to reduce CO2emis- sions by the current signatory countries before 2030 would yield a warming equivalent to RCP 4.5, resulting in drastically improved predicted global coral reef futures (32). Although it is less likely for Bermuda coral calcification to increase under the warming provided by RCP 4.5 (Fig. 4A), it could provide a pathway for BermudanP. astreoides andD. labyrinthiformiscorals to avoid regular severe bleaching until after 2070 (Fig. 4B), assuming no increases in coral acclimatization to future warming. Yet, there is uncertainty whether Bermudan corals can acclimatize to warming at rates faster, or slower, than the +0.1°C decade−1rate from the study of Cooperet al. (26). However, a +0.1°C decade−1increase in bleaching threshold could enable Bermudan corals to avoid regular severe bleaching in the 21st century under the RCP 2.6, 4.5, and 6.0 emissions pathways (Fig. 4B). In the absence of regular severe bleaching, the RCP 4.5 warming scenario therefore suggests that BermudanP. astreoidesandD. labyrinthiformiscorals could maintain positive calcification at least until 2070 (Fig. 4B) with acclimatization rates of +0.1°C decade−1extending this beyond the end of the 21st century (Fig. 4B). However, note that net reef calcification and the main- tenance of coral reef structure additionally depend on CaCO3dissolution and bioerosion processes, which are predicted to increase under ocean acidification (33). The calcification projections for the 21st century in this study assume that available coral nutrition remains adequate to maintain the insensitivity of adultP. astreoidesandD. labyrinthiformiscolonies to ocean acidification [as observed in the present mesocosm experiment and in previous studies (6,7)] and that corals are able to successfully recruit despite the potential for negative effects of ocean acidification on scleractinian coral settlement and early life stages (34). This highlights the need for reducing CO2emissions to lessen ocean acidification impacts on Bermudan coral reef CaCO3dissolution to maintain net positive reef calcification over the coming century.
Every scleractinian species comprising the reef calcification budget for Hog Reef (D. labyrinthiformis,P. astreoides,Pseudodiploria strigosa, Favia fragum,Madracis decactis,Montastrea cavernosa, andOrbicella franksi) (35) is categorized as having either weedy, generalist, or stress- tolerant life histories; such species are hypothesized to be better adapted to ocean warming and acidification than faster-growing architecturally complex corals with competitive life histories (for example,Acropora) (36). The high natural variability of the Bermudan coral reef environ- ment documented in this study (Crescent Reef annualDseawater tem- perature = 12.4°C) may provide elevated thermal tolerance to corals (37) and annually variable pHsw(Hog Reef annualDpHsw= 0.22) may explain the lack of sensitivity of coral calcification for adequately fed corals to predicted end-of-century ocean acidification observed in the mesocosm experiments of this study. High Bermudan coral genetic variability and population connectivity with the Caribbean may addi- tionally increase the resilience of Bermudan coral populations during and after potential future ecological disturbances (38), with the deep reefs of Bermuda providing an additional refuge for select coral species (39). The combination of these factors and legislation protecting Ber- mudan coral reefs from local anthropogenic stressors (40) confer addi- tional resiliency to this stress-tolerant coral community under current and predicted end-of-century warming and acidification. Bermudan coral reefs have maintained a relatively constant stress-tolerant, weedy,
and generalist coral community composition (table S2) (35,41) and high coral cover (40) at least since 1980, further highlighting the re- silience of Bermudan coral reefs and suggesting that reef calcification has also remained constant. That same time period in the Caribbean was characterized by declining coral cover and coral community shifts from competitive, structurally complex, and fast-growingAcropora corals to stress-tolerant, weedy, and generalist corals (36), driving basin-wide reductions in structural complexity (42) and net coral reef calcification (43).
These findings that Caribbean coral communities are shifting toward stress-tolerant life histories resembling the current community composi- tion of Bermudan coral reefs suggest that a Bermuda-type coral reef system is one of many potential future stable states for coral reefs in the Caribbean and elsewhere. Characterized by anomalously high coral cover (40) and net positive reef calcification (35), coral reef systems resembling those of Bermuda may provide greater ecological resilience to 21st-century climate change and the maintenance of ecosystem ser- vices that these reef systems provide to humanity. This potentially brighter than previously predicted future for Bermudan and Caribbean coral reefs depends on mitigating other local-scale stressors (for example, overfishing and impacts of increasing human populations) (40) coupled with a continued global commitment to rapidly and drastically reducing CO2emissions to lessen the impacts of ocean warming and acidification.
MATERIALS AND METHODS In situ coral calcification
Twenty-four colonies each ofP. astreoidesandD. labyrinthiformiswere collected from Hog Reef and Crescent Reef, Bermuda, for a total of 96 coral colonies and mounted onto acrylic tiles using Z-SPAR A-788 epoxy. Twelve colonies of each species were deployed at two locations on both a rim reef site, Hog Reef, and an outer lagoon reef site, Crescent Reef, over a 2-year period (September 2010 to September 2012 at Hog Reef and August 2010 to September 2012 at Crescent Reef). Buoyant weights of each colony (16) were measured in triplicate and averaged at the end of each 2- to 3-month growth interval using a correction term for seawater density at the time of measurement and subtraction of the weight of both tile and epoxy to determine calcification as the change in weight during each growth interval. Mean initial weights (±SD) for P. astreoideswere 433 ± 112 g and 372 ± 73 g at Hog Reef and Crescent Reef, respectively, and forD. labyrinthiformis, the corresponding values were 345 ± 109 g and 379 ± 83 g.
Carbonate chemistry
Carbonate chemistry samples for Hog Reef and Crescent Reef were collected monthly or more frequently using a 5-liter Niskin bottle at a depth of 0.5 to 1.0 m, according to best practices (44). Offshore samples were collected monthly as part of the BATS (18). Samples for DIC and TA were collected in 200-ml Kimax glass sample bottles, fixed using 100ml of saturated solution of HgCl2. Reef samples of TA were analyzed via closed-cell potentiometric titrations using a Versatile IN- strument for the Determination of Titration Alkalinity 3S (VINDTA 3S) system, whereas BATS samples were analyzed on a VINDTA 2S (Marianda). DIC was analyzed using coulometric methods on a VINDTA 3C or infrared-based analysis on an Automated Infra Red Inorganic Carbon Analyzer (AIRICA) system (Marianda). The accuracy and pre- cision of TA and DIC analyses were verified against certified reference material (CRM) provided by the laboratory of A. Dickson of the Scripps Institution of Oceanography. Analysis of replicate CRMs yielded a typical S C I E N C E A D V A N C E S | R E S E A R C H A R T I C L E
on January 5, 2018http://advances.sciencemag.org/Downloaded from
accuracy and precision of ±1 to 2mmol/kg for both TA and DIC. A YSI 556 Handheld Multiparameter Instrument was used to measure in situ temperature (accuracy, ±0.15°C) and salinity (accuracy, ±1%), and an Autosal Salinometer (accuracy, <0.002) was preferentially used when available to measure salinity for 66% of all bottle samples at Hog Reef and Crescent Reef. The complete carbonate system parameters (that is, pHsw,PCO2, andWA) were calculated using the program CO2SYS for Excel (45) and MATLAB (46) using theK1andK2dissociation con- stants from the study of Mehrbachet al. (47) refit by Dickson and Millero (48),KHSO4from Dickson (49), and pH on the seawater scale. Estimated uncertainties for calculated carbonate system parameters from the study of Millero (50) were used. Seawater and atmosphericPCO2, temperature, salinity, and atmospheric pressure were measured autonomously every 3 hours by the National Oceanic and Atmospheric Administration Pacific Marine Environmental Laboratory (PMEL) MAPCO2(Moored Autono- mousPCO2) moorings stationed at Hog Reef and Crescent Reef. Each mooring used a Batelle Memorial Institute CO2system to measure the mole fraction of CO2and a Sea-Bird 16plus v2 to measure temperature and salinity (51).
Net ecosystem calcification
TA for Hog Reef and BATS bottle samples was normalized to the mean measured Hog Reef salinity of 36.59 g kg−1. BATS bottle samples were linearly interpolated to match the sampling times at Hog Reef for anal- ysis of NEC in this study. NEC was calculated for Hog Reef during the 2-year study interval and represents the net balance between calci- fication and CaCO3dissolution for a well-mixed water column, as per the following equation (52)
NEC¼rzðTAoffshoreTAreefÞ
2t ð1Þ
whereris seawater density calculated from temperature, salinity, and pressure at the time of sampling using the TEOS-10 Gibbs Seawater oceanographic toolbox (53);zis the mean ± SD water column depth of 10.3 ± 3.3 m calculated for Hog Reef (35); TAoffshoreis the monthly inter- polated BATS salinity normalized TA bottle sample data; TAreefis the approximately monthly Hog Reef salinity normalized TA bottle sample;
andtis the mean ± SD seawater residence time (2.5 ± 0.4 days) calculated using a multitracer approach at the nearby North Rock rim reef site (19).
Environmental parameters
Daily averages of temperature (°C) and light (lux) for Hog Reef and Crescent Reef were obtained from averaging four onset HOBO Pendant data loggers deployed at each reef site. Hog Reef lux data were not avail- able for the 15, 22, and 25 September 2010 and 19 October 2010 mea- surements of Hog Reef NEC. A linear model constructed in MATLAB between daily Hog Reef light data and fall 2010 Bermuda Weather Service hours of sunlight [lux ± SE = 146 ± 21 × (hours of sunlight) + 547 ± 137,R2= 0.394,P< 0.001, degrees of freedom (df) = 71,F= 46.08] was used to predict in situ Hog Reef lux data for the missing values. Monthly satellite chlorophylla(mg liter−1) for the reef sites was obtained by interpolating daily chlorophyllameasurements from the 4-km-resolution Moderate Resolution Imaging Spectroradiometer chlorophyllaproduct. Seawater nutrient samples were taken approxi- mately monthly and according to best practices. Nutrient samples were filtered using a 0.4-mm filter and immediately frozen in opaque plastic bottles until processing at the Woods Hole Oceanographic Institution Nutrient Analytical Facility. All samples were analyzed on a SEAL
AutoAnalyzer 3 four-channel segmented flow analyzer using approved U.S. Environmental Protection Agency methods for ammonium (method G-171-96; detection limit 0.034mM), nitrite + nitrate (method G-172-96;
detection limit 0.010mM), silicate (method G-177-96; detection limit 0.016mM), and phosphate (method G-297-03; detection limit 0.025mM).
Axis 1 of a principal components analysis (PCA) performed on the am- monium, nitrite + nitrate, silicate, and phosphate data was used as a bulk nutrient metric for parameterization of the SEM analysis.
Structural equation modeling
SEM was used to numerically solve the complex interactions between biotic and abiotic drivers of calcification to partition the direct and in- direct effects of environmental drivers on calcification (23). All environ- mental data during the in situ coral growth monitoring at Hog Reef and Crescent Reef were monthly averaged to equally weight the data across the coral buoyant weight intervals. Coral growth was measured approx- imately every 2 to 3 months and was interpolated by a spline function with a cubic algorithm to link the data points and calculate monthly calcification rates so that it could be directly compared with the monthly averaged environmental data. Nutrients were synthesized by means of a standardized PCA. The first principal component was used as a proxy of nutrient variability and compared with the other environmental data.
Because the Hog Reef NEC is based on a mean ± SD seawater residence time of 2.4 ± 0.4 days (19), environmental parameters that were as con- temporaneous as possible to the NEC data were selected to yield the most accurate environmental parameters driving NEC. Parameters sampled at a lower resolution were interpolated to match NEC dates.
Thus, the SEM was performed on monthly averaged temperature, light, salinity,WA, pHsw, DIC, TA,PCO2, nutrients, and chlorophylla drivers ofP. astreoidesandD. labyrinthiformiscalcification rates, and approximately daily averages for Hog Reef NEC. The strength and sign of the links and quantification of the SEM were determined by simple and partial multivariate regression and Monte Carlo permutation tests (1000 replicates), whereas chi-square values were used to assess the fit of the overall path model (54). The individual path coefficients (that is, the partial regression coefficients) indicate the relationship between the causal and response variables. Significance levels for individual paths between variables were set ata= 0.05. Structural equation models were run in Amos v.21 (IBM) (55).
Mesocosm seawater acidification experiment
The mesocosm experiments were conducted on P. astreoides and D. labyrinthiformis colonies (diameter, 12 to 16 cm) collected in July 2011 using a hammer and chisel from three Bermuda rim reef sites (near 32°26′N, 64°50′W; depth, 6 to 9 m) and exposed to three different seawater pH conditions (pHsw= 8.0 ± 0.1, 7.8 ± 0.1, and 7.6 ± 0.1) in controlled mesocosms for 3 months. These experiments were con- ducted as part of a larger-scale yearlong mesocosm experiment, in- cluding a third coral species,Madracis auretenra, and testing for the additional effects of feeding on calcification responses to pH treatments.
After processing each colony with an initial weighing and cementing (Z-Spar A-788) onto a preweighed tagged acrylic tile, three colonies each ofP. astreoidesandD. labyrinthiformiswere randomly assigned to each of nine experimental tanks (three replicate tanks per pH treat- ment). To account for possible tank effects, coral colonies were moved around within each tank once a week, and the tanks were scrubbed clean during this time. The buoyant weight technique (16) was applied approximately monthly to each coral to calculate the calcification rate for the duration of the experiment (fig. S2).
on January 5, 2018http://advances.sciencemag.org/Downloaded from
Seawater was pumped from a nearby inlet into header tanks that each fed into three replicated experimental tanks so that conditions could more closely mimic naturally fluctuating ambient reef conditions.
The two reduced pH treatments were bubbled with additional CO2into the respective header tanks withPCO2controlled by rotameters (King Instrument) to simulate seawater acidification for those treatments.
Each experimental tank had flow rates of 1.67 (±0.17) liter min−1, yield- ing a ca. 42-min turnover time. Each tank was fed three times a week with a concentratedArtemiasolution, resulting in approximate feeding concentrations of 1.8 mg liter−1for a 2-hour, no–flow-through period after sunset to allow corals to feed. Mesh light screens were used to pro- tect the corals from the intense light of the shallow mesocosm tanks relative to the deeper in situ reef conditions. A YSI 556 multiparameter probe was calibrated according to standard protocols and used to monitor daily temperature, salinity, dissolved oxygen, and pH (fig. S2) with quantitative carbonate chemistry monitored by water samples ana- lyzed for DIC, TA, and salinity. Carbonate chemistry samples were col- lected and analyzed, as described in the“Carbonate chemistry”section.
Before statistical analysis, all data were tested for equal variance and for normality (Kolmogorov-Smirnov test) in SigmaPlot v11 and were log-transformed (mg day−1data) or arcsine square root–transformed (mg day−1cm−2data) if necessary. Mean calcification rates for each spe- cies per tank over each growth period were analyzed using two-way re- peated measures analysis of variance (ANOVA) in SigmaPlot v11 with growth periods (n= 4) and tanks within treatment (n= 3) as fixed main effects. Significant interactions were further analyzed with multiple comparison procedures (Holm-Sidak method). Regression analysis was used to test for significant relationships between calcification rates and calculated carbon chemistry data, seawater temperature, and light.
Climate model predictions
The CMIP5 multimodel ensemble (24) was used in the analysis for 21st-century Bermuda SST predictions. Model output was generated by the NASA Goddard Institute for Space Studies model–run GISS-E2-H (2° latitude × 2.5° longitude 40-layer atmosphere coupled with HYbrid Coordinate Ocean Model 1° latitude × 1° longitude 26-layer ocean model) (56) using RCPs +2.6, +4.5, +6.0, and +8.5 W m−2relative to preindustrial levels (25). Monthly SST data from the four closest points surrounding Bermuda were averaged to obtain mean changes in warm- ing anticipated for Bermuda. Linear models were fit through the monthly SST data to determine a mean rate of SST increase for the 21st cen- tury under RCP 2.6 (+0.05°C decade−1,P= 0.059, df = 1138,F= 3.57), RCP 4.5 (+0.13°C decade−1,P< 0.0001, df = 1138,F= 29.8), RCP 6.0 (+0.15°C decade−1,P< 0.0001, df = 1138,F= 36), and RCP 8.5 (+0.27°C decade−1,P< 0.0001, df = 1138,F= 120). These rates were compared to the +0.1°C decade−1warming-induced calcification increases ob- served by Cooperet al. (26) for 20th-century massivePoritescorals in the East Indian Ocean (28°S). Because the RCP 2.6 emissions scenario predicted a rate of warming less than the +0.1°C decade−1from the study of Cooperet al. (26), only that emissions scenario was used to predict potential increases in coral calcification rates in Bermuda.
Single-variable linear calcification responses to temperature were con- structed forP. astreoides(Hog Reef: slope = 0.0027% day−1°C−1,P= 0.0003, df = 23,F= 17.8; Crescent Reef: slope = 0.0035% day−1°C−1, P= 0.0002, df = 22,F= 20.2),D. labyrinthiformis(Hog Reef: slope = 0.0026% day−1°C−1,P= 0.0006, df = 23,F= 15.9; Crescent Reef: slope = 0.0023% day−1°C−1,P= 0.02, df = 22,F= 6.1), and Hog Reef NEC (slope = 0.42 kg m−2year−1°C−1,P< 0.001, df = 44,F= 50.4). The slopes of these calcification responses per degree Celsius were multiplied by
the +0.4°C predicted for end-of-21st-century Bermuda from mean RCP 2.6 warming rates to estimate potential warming-induced increases in calcification. The maximum monthly SST for each year was extracted from the output of each climate model to compare to coral bleaching thresholds. Coral bleaching is predicted to occur during a DHM in which monthly maximum summer SSTs are 1°C above mean maxi- mum summer climatology, with an annual accumulation of two DHMs being a predictor of extreme coral bleaching and mortality (27). The first 10 years of CMIP5 maximum monthly summer SST model output (2006–2016) were averaged to approximate a mean maximum summer climatology used in calculating a relative DHM for the future warming.
The difference between the summer model output and this mean max- imum summer climatology was plotted to determine when maximum summer SSTs are expected to exceed the DHM of 1°C with and without a +0.1°C decade−1acclimatization rate, respectively, under RCPs 2.6, 4.5, 6.0, and 8.5.
SUPPLEMENTARY MATERIALS
Supplementary material for this article is available at http://advances.sciencemag.org/cgi/
content/full/3/11/e1701356/DC1
fig. S1. Hog Reef and Crescent Reef environmental data for salinity, nutrients, and satellite chlorophylla.
fig. S2. Mesocosm seawater acidification experiment data.
table S1. Model estimates from the structural ecosystem models.
table S2. Bermuda coral community composition.
table S3. Mesocosm seawater acidification experiment statistical summary.
REFERENCES AND NOTES
1. J. P. G. Spurgeon, The economic valuation of coral reefs.Mar. Pollut. Bull.24, 529–536 (1992).
2. M. S. Pratchett, K. D. Anderson, M. O. Hoogenboom, E. Widman, A. H. Baird, J. M. Pandolfi, P. J. Edmunds, J. M. Lough, Spatial, temporal and taxonomic variation in coral growth— Implications for the structure and function of coral reef ecosystems.Oceanogr. Mar. Biol.53, 215–296 (2015).
3. N. Knowlton, R. E. Brainard, R. Fisher, M. Moews, L. Plaisance, M. J. Caley, inLife in the World’s Oceans: Diversity, Distribution, and Abundance, A. D. McIntyre, Ed. (Wiley-Blackwell, 2010), pp. 65–78.
4. G. D. Stanley Jr., Early history of scleractinian corals and its geological consequences.
Geology9, 507–511 (1981).
5. B. G. Hatcher, Coral reef primary productivity: A beggar’s banquet.Trends Ecol. Evol.3, 106–111 (1988).
6. K. D. Castillo, J. B. Ries, J. F. Bruno, I. T. Westfield, The reef-building coral Siderastrea siderea exhibits parabolic responses to ocean acidification and warming.Proc. Biol. Sci.
281, 20141856 (2014).
7. E. K. Towle, I. C. Enochs, C. Langdon, Threatened Caribbean coral is able to mitigate the adverse effects of ocean acidification on calcification by increasing feeding rate.PLOS ONE10, e0123394 (2015).
8. A. McMahon, I. R. Santos, T. Cyronak, B. D. Eyre, Hysteresis between coral reef calcification and the seawater aragonite saturation state.Geophys. Res. Lett.40, 4675–4679 (2013).
9. A. Venti, A. Andersson, C. Langdon, Multiple driving factors explain spatial and temporal variability in coral calcification rates on the Bermuda platform.Coral Reefs33, 979–997 (2014).
10. J. M. Lough, N. E. Cantin, J. A. Benthuysen, T. F. Cooper, Environmental drivers of growth in massivePoritescorals over 16 degrees of latitude along Australia’s northwest shelf.
Limnol. Oceanogr.61, 684–700 (2016).
11. J. M. Lough, N. E. Cantin, Perspectives on massive coral growth rates in a changing ocean.
Biol. Bull.226, 187–202 (2014).
12. P. L. Jokiel, S. L. Coles, Effects of temperature on the mortality and growth of Hawaiian reef corals.Mar. Biol.43, 201–208 (1977).
13. K. Schneider, J. Erez, The effect of carbonate chemistry on calcification and photosynthesis in the hermatypic coralAcropora eurystoma.Limnol. Oceanogr.51, 1284–1293 (2006).
14. K. L. Yeakel, A. J. Andersson, N. R. Bates, T. J. Noyes, A. Collins, R. Garley, Shifts in coral reef biogeochemistry and resulting acidification linked to offshore productivity.
Proc. Natl. Acad. Sci. U.S.A.112, 14512–14517 (2015).
15. S. R. Smith, S. Sarkis, T. J. T. Murdoch, E. Weil, A. Croquer, N. R. Bates, R. J. Johnson, S. de Putron, A. J. Andersson, Threats to coral reefs of Bermuda, inCoral Reefs of the United
S C I E N C E A D V A N C E S | R E S E A R C H A R T I C L E
on January 5, 2018http://advances.sciencemag.org/Downloaded from
Kingdom Overseas Territories, C. Sheppard, Ed. (Springer Science and Business Media, 2013), vol. 4, pp. 173–188.
16. P. L. Jokiel, J. E. Maragos, L. Franzisket, Coral growth: Buoyant weight technique, inCoral Reefs:
Research Methods, D. R. Stoddardt, R. E. Johannes, Eds. (UNESCO,1978), pp. 529–541.
17. S. V. Smith, Carbon dioxide dynamics: A record of organic carbon production, respiration, and calcification in the Eniwetok reef flat community.Limnol. Oceanogr.18, 106–120 (1973).
18. N. R. Bates, M. H. P. Best, K. Neely, R. Garley, A. G. Dickson, R. J. Johnson, Detecting anthropogenic carbon dioxide uptake and ocean acidification in the North Atlantic Ocean.Biogeosciences9, 2509–2522 (2012).
19. A. Venti, D. Kadko, A. J. Andersson, C. Langdon, N. R. Bates, A multi-tracer model approach to estimate reef water residence times.Limnol. Oceanogr. Methods10, 1078–1095 (2012).
20. R. J. Jones, Bermuda Institute of Ocean Sciences (BIOS), Marine Environmental Program (MEP) Annual Report (2006–2007), submitted to the Bermuda Government Department of Environmental Protection, Ministry of the Environment (2006).
21. N. R. Bates, A. Amat, A. J. Andersson, Feedbacks and responses of coral calcification on the Bermuda reef system to seasonal changes in biological processes and ocean acidification.Biogeosciences7, 2509–2530 (2010).
22. H. C. Barkley, A. L. Cohen, D. C. McCorkle, Y. Golbuu, Mechanisms and thresholds for pH tolerance in Palau corals.J. Exp. Mar. Biol. Ecol.489, 7–14 (2017).
23. J. B. Grace,Structural Equation Modeling and Natural Systems(Cambridge Univ. Press, 2006).
24. K. E. Taylor, R. J. Stouffer, G. A. Meehl, An overview of CMIP5 and the experiment design.Bull. Am. Meteorol. Soc.93, 485–498 (2012).
25. R. H. Moss, J. A. Edmonds, K. A. Hibbard, M. R. Manning, S. K. Rose, D. P. van Vuuren, T. R. Carter, S. Emori, M. Kainuma, T. Kram, G. A. Meehl, J. F. B. Mitchell, N. Nakicenovic, K. Riahi, S. J. Smith, R. J. Stouffer, A. M. Thomson, J. P. Weyant, T. J. Wilbanks, The next generation of scenarios for climate change research and assessment.Nature463, 747–756 (2010).
26. T. Cooper, R. A. O’Leary, J. M. Lough, Growth of Western Australian corals in the anthropocene.Science335, 593–596 (2012).
27. S. D. Donner, W. J. Skirving, C. M. Little, M. Oppenheimer, O. Hoegh-Gulberg, Global assessment of coral bleaching and required rates of adaptation under climate change.
Glob. Chang. Biol.11, 2251–2265 (2005).
28. S. V. Smith, F. Pesret, Processes of carbon dioxide flux in the Fanning Island lagoon.
Pac. Sci.28, 225–245 (1974).
29. J. A. Y. Moore, L. M. Bellchambers, M. R. Depczynski, R. D. Evans, S. N. Evans, S. N. Field, K. J. Friedman, J. P. Gilmour, T. H. Holmes, R. Middlebrook, B. T. Radford, T. Ridgway, G. Shedrawi, H. Taylor, D. P. Thomson, S. K. Wilson, Unprecedented mass bleaching and loss of coral across 12° of latitude in Western Australia in 2010–11.PLOS ONE7, e51807 (2012).
30. T. P. Hughes, J. T. Kerry, M. Álvarez-Noriega, J. G. Álvarez-Romero, K. D. Anderson, A. H. Baird, R. C. Babcock, M. Beger, D. R. Bellwood, R. Berkelmans, T. C. Bridge, I. R. Butler, M. Byrne, N. E. Cantin, S. Comeau, S. R. Connolly, G. S. Cumming, S. J. Dalton, G. Diaz-Pulido, C. M. Eakin, W. F. Figueira, J. P. Gilmour, H. B. Harrison, S. F. Heron, A. S. Hoey, J.-P. A. Hobbs,
M. O. Hoogenboom, E. V. Kennedy, C.-. Kuo, J. M. Lough, R. J. Lowe, G. Liu, M. T. McCulloch, H. A. Malcolm, M. J. McWilliam, J. M. Pandolfi, R. J. Pears, M. S. Pratchett, V. Schoepf, T. Simpson, W. J. Skirving, B. Sommer, G. Torda, D. R. Wachenfeld, B. L. Willis, S. K. Wilson, Global warming and recurrent mass bleaching of corals.Nature543, 373–377 (2017).
31. I. Capellán-Pérez, I. Arto, J. M. Polanco-Martínez, M. González-Eguino, M. B. Neumann, Likelihood of climate change pathways under uncertainty on fossil fuel resource availability.Energy Environ. Sci.9, 2482–2496 (2016).
32. R. van Hooidonk, J. Maynard, J. Tamelander, J. Gove, G. Ahmadia, L. Raymundo, G. Williams, S. F. Heron, S. Planes, Local-scale projections of coral reef futures and implications of the Paris Agreement.Sci. Rep.6, 39666 (2016).
33. B. D. Eyre, A. J. Andersson, T. Cyronak, Benthic coral reef calcium carbonate dissolution in an acidifying ocean.Nat. Clim. Chang.4, 969–976 (2014).
34. R. Albright, C. Langdon, Ocean acidification impacts multiple early life history processes of the Caribbean coralPorites astreoides.Glob. Chang. Biol.17, 2478–2487 (2011).
35. T. A. Courtney, A. J. Andersson, N. R. Bates, A. Collins, T. Cyronak, S. J. de Putron, B. D. Eyre, R. Garley, E. J. Hochberg, R. Johnson, S. Musielewicz, T. J. Noyes, C. L. Sabine, A. J. Sutton, J. Toncin, A. Tribollet, Comparing chemistry and census-based estimates of net ecosystem calcification on a rim reef in Bermuda.Front. Mar. Sci.3, 181 (2016).
36. E. S. Darling, L. Alvarez-Filip, T. A. Oliver, T. R. McClanahan, I. M. Côté, Evaluating life-history strategies of reef corals from species traits.Ecol. Lett.15, 1378–1386 (2012).
37. T. A. Oliver, S. R. Palumbi, Do fluctuating temperature environments elevate coral thermal tolerance?Coral Reefs30, 429–440 (2011).
38. J. M. Locke, K. A. Coates, J. P. Bilewitch, L. P. Holland, J. M. Pitt, S. R. Smith, H. G. Trapido-Rosenthal, Biogeography, biodiversity and connectivity of Bermuda’s coral reefs, inCoral Reefs of the United Kingdom Overseas Territories, C. Sheppard, Ed. (Springer Science and Business Media, 2013), pp. 153–172.
39. Pim Bongaerts, Cynthia Riginos, Ramona Brunner, Norbert Englebert, Struan R. Smith, Ove Hoegh-Guldberg, Deep reefs are not universal refuges: Reseeding potential varies among coral species.Sci. Adv.3, e1602373 (2017).
40. J. B. C. Jackson, M. K. Donovan, K. L. Cramer, V. V. Lam,Status and Trends of Caribbean Coral Reefs : 1970–2012(Global Coral Reef Monitoring Network, IUCN, 2014).
41. R. E. Dodge, A. Logan, A. Antonius, Quantitative reef assessment studies in Bermuda: A comparison of methods and preliminary results.Bull. Mar. Sci.32, 745–760 (1982).
42. L. Alvarez-Filip, N. K. Dulvy, J. A. Gill, I. M. Côté, A. R. Watkinson, Flattening of Caribbean coral reefs: Region-wide declines in architectural complexity.Proc. Biol. Sci.276, 3019–3025 (2009).
43. C. T. Perry, G. N. Murphy, P. S. Kench, S. G. Smithers, E. N. Edinger, R. S. Steneck, P. J. Mumby, Caribbean-wide decline in carbonate production threatens coral reef growth.Nat. Commun.4, 1402 (2013).
44. A. G. Dickson, C. L. Sabine, J. R. Christian,Guide to Best Practices for Ocean CO2
Measurements(PICES Special Publication, 2007), vol. 3, 191 pp.
45. E. Lewis, D. Wallace,Program Developed for CO2System Calculations: Carbon Dioxide Information Analysis Center, Oak Ridge National Laboratory, ORNL/CDIAC-105(US DOE, 1998).
46. S. Van Heuven, D. Pierrot, J. W. B. Rae, E. Lewis, D. W. R. Wallace, MATLAB program developed for CO2system calculations, ORNL/CDIAC-105b, Carbon Dioxide Inf. Anal.
Cent., Oak Ridge Natl. Lab., US DOE, Oak Ridge, TN (2011).
47. C. Mehrbach, C. H. Culberson, J. E. Hawley, R. M. Pytkowicx, Measurement of the apparent dissociation constants of carbonic acid in seawater at atmospheric pressure.Limnol.
Oceanogr.18, 897–907 (1973).
48. A. G. Dickson, F. J. Millero, A comparison of the equilibrium constants for the dissociation of carbonic acid in seawater media.Deep Sea Res.34, 1733–1743 (1987).
49. A. G. Dickson, Thermodynamics of the dissociation of boric acid in synthetic seawater from 273.15 to 318.15 K.Deep Sea Res.37, 755–766 (1990).
50. F. J. Millero, The marine inorganic carbon cycle.Chem. Rev.107, 308–341 (2007).
51. A. J. Sutton, C. L. Sabine, S. Maenner-Jones, N. Lawrence-Slavas, C. Meinig, R. A. Feely, J. T. Mathis, S. Musielewicz, R. Bott, P. D. McLain, H. J. Fought, A. Kozyr, A high-frequency atmospheric and seawaterpCO2data set from 14 open-ocean sites using a moored autonomous system.Earth Syst. Sci. Data.6, 353–366 (2014).
52. C. Langdon, J.-P. Gattuso, A. Andersson, inGuide to Best Practices for Ocean Acidification Research and Data Reporting, U. Riebesell, V. Fabry, L. Hansson, J. Gattuso, Eds. (Office for Official Publications of the European Communities, 2010), pp. 213–232.
53. T. J. McDougall, P. M. Barker,Getting Started with TEOS-10 and the Gibbs Seawater (GSW) Oceanographic Toolbox(SCOR/IAPSO WG 127, 2011), 28 pp.
54. C. Alsterberg, J. S. Eklöf, L. Gamfeldt, J. N. Havenhand, K. Sundbäck, Consumers mediate the effects of experimental ocean acidification and warming on primary producers.Proc.
Natl. Acad. Sci. U.S.A.110, 8603–8608 (2013).
55. J. L. Arbuckle. Amos (Version 21.0) [Computer Program]. Chicago: IBM SpSS (2014).
56. G. A. Schmidt, M. Kelley, L. Nazarenko, R. Ruedy, G. L. Russell, I. Aleinov, M. Bauer, S. E. Bauer, M. K. Bhat, R. Bleck, V. Canuto, Y.-H. Chen, Y. Cheng, T. L. Clune, A. Del Genio, R. de Fainchtein, G. Faluvegi, J. E. Hansen, R. J. Healy, N. Y. Kiang, D. Koch, A. A. Lacis, A. N. LeGrande, J. Lerner, K. K. Lo, E. E. Matthews, S. Menon, R. L. Miller, V. Oinas, A. O. Oloso, J. P. Perlwitz, M. J. Puma, W. M. Putman, D. Rind, A. Romanou, M. Sato, D. T. Shindell, S. Sun, R. A. Syed, N. Tausnev, K. Tsigaridis, N. Unger, A. Voulgarakis, M.-S. Yao, J. Zhang, Configuration and assessment of the GISS ModelE2 contributions to the CMIP5 archive.J. Adv. Model. Earth Syst.6, 141–184 (2014).
Acknowledgments:This project was made possible by the countless contributions by researchers, staff, volunteers, and interns at the Bermuda Institute of Ocean Sciences. We acknowledge the World Climate Research Programme’s Working Group on Coupled Modelling for Coupled Model Intercomparison Project and thank the NASA Goddard Institute for Space Studies for producing and making their CMIP5 model output available. We thank F. Melin for extracting and providing the satellite chlorophylladata. Additionally, we thank two anonymous reviewers for improving this manuscript with their constructive comments and feedback. This is PMEL contribution number 4705.Funding:This work was funded by National Science Foundation (NSF) OCE 09-28406 (to A.J.A., N.R.B., and S.J.d.P), NSF OCE 14-16518 (to A.J.A. and R.J.), and the NSF Graduate Research Fellowship Program (to T.A.C.).Author contributions:A.J.A., N.R.B., and S.J.d.P. designed the study.
A.J.A., N.R.B., S.J.d.P., A.C., R.G., R.J., T.J.N., and C.L.S. conducted measurements and/or contributed data. T.A.C., A.J.A., M.L., and J.-C.M. analyzed the data and results. T.A.C. and A.J.A. wrote the manuscript with input from all coauthors.Competing interests:The authors declare that they have no competing interests.Data availability:All data needed to evaluate the conclusions in the paper are present in the paper and/or the Supplementary Materials. Additional data related to this paper may be requested from the authors. The data presented in this manuscript will be made available in the Biological and Chemical Oceanography Data Management Office database under the BEACON project (http://bco-dmo.org/project/2190).
Submitted 26 April 2017 Accepted 17 October 2017 Published 8 November 2017 10.1126/sciadv.1701356
Citation:T. A. Courtney, M. Lebrato, N. R. Bates, A. Collins, S. J. de Putron, R. Garley, R. Johnson, J.-C. Molinero, T. J. Noyes, C. L. Sabine, A. J. Andersson, Environmental controls on modern scleractinian coral and reef-scale calcification.Sci. Adv.3, e1701356 (2017).
on January 5, 2018http://advances.sciencemag.org/Downloaded from
Environmental controls on modern scleractinian coral and reef-scale calcification
Juan-Carlos Molinero, Timothy J. Noyes, Christopher L. Sabine and Andreas J. Andersson
Travis A. Courtney, Mario Lebrato, Nicholas R. Bates, Andrew Collins, Samantha J. de Putron, Rebecca Garley, Rod Johnson,
DOI: 10.1126/sciadv.1701356 (11), e1701356.
3 Sci Adv
ARTICLE TOOLS http://advances.sciencemag.org/content/3/11/e1701356
MATERIALS
SUPPLEMENTARY http://advances.sciencemag.org/content/suppl/2017/11/06/3.11.e1701356.DC1
REFERENCES
http://advances.sciencemag.org/content/3/11/e1701356#BIBL This article cites 43 articles, 7 of which you can access for free
PERMISSIONS http://www.sciencemag.org/help/reprints-and-permissions
Terms of Service Use of this article is subject to the
registered trademark of AAAS.
is a Science Advances Association for the Advancement of Science. No claim to original U.S. Government Works. The title
York Avenue NW, Washington, DC 20005. 2017 © The Authors, some rights reserved; exclusive licensee American (ISSN 2375-2548) is published by the American Association for the Advancement of Science, 1200 New Science Advances
on January 5, 2018http://advances.sciencemag.org/Downloaded from