Modality prediction of biomedical literature images using multimodal feature representation
Klassifikation von Bildern der biomedizinischen Literatur unter Anwendung multimodaler Merkmale
Abstract
This paper presents the modelling approaches performed to automat- ically predict the modality of images found in biomedical literature.
Obioma Pelka
1Christoph M. Friedrich
1Various state-of-the-art visual features such as Bag-of-Keypoints com- puted with dense SIFT descriptors, texture features and Joint Composite
Descriptors were used for visual image representation. Text represen- 1 Department of Computer Science, University of Applied tation was obtained by vector quantisation on a Bag-of-Words dictionary
Sciences and Arts Dortmund, Germany
generated using attribute importance derived from a χ2-test. Computing the principal components separately on each feature, dimension reduc- tion as well as computational load reduction was achieved. Various multiple feature fusions were adopted to supplement visual image in- formation with corresponding text information. The improvement ob- tained when using multimodal features vs. visual or text features was detected, analysed and evaluated. Random Forest models with 100 to 500 deep trees grown by resampling, a multi class linear kernel SVM with C=0.05 and a late fusion of the two classifiers were used for modality prediction. A Random Forest classifier achieved a higher ac- curacy and computed Bag-of-Keypoints with dense SIFT descriptors proved to be a better approach than with Lowe SIFT.
Keywords:biomedical literature, multimodal imaging, principal component analysis, Random Forest, support vector machines
Zusammenfassung
Dieser Beitrag stellt Modellierungsansätze vor, die die Modalität von Bildern der biomedizinischen Literatur automatisch vorhersagen. Ver- schiedene state-of-the-art-Verfahren der visuellen Merkmalsextraktion, wie Bag-of-Keypoints mit Dense-SIFT-Deskriptoren, Joint Composite- Descriptor und Fuzzy Color-Histogram wurden eingesetzt, um die cha- rakteristische Gegebenheiten der Bilder darzustellen. Für die textuellen Merkmalsextraktion wurde das Bag-Of-Words-Verfahren angewandt.
Die Reduktion des Lexikons erfolgte mittels des χ2-Tests. Die Anwendung der Principal Components Analysis führte zur Reduzierung der Merk- malsdimension. Eine Verbesserung der Klassifikationsrate wurde durch unterschiedliche Kombinationen zwischen visuellen und textuellen Merkmalen erzielt. Die Lernverfahren Random Forest mit 100 bis 500 Entscheidungsbäumen und SVM mit einer linearen Kernel-Funktion und dem C-Parameter (C=0,05) kamen zum Vorhersagen der Modalitä- ten zum Einsatz. Bessere Klassifikationsraten wurden mit dem Lernver- fahren Random Forest erzielt. Mit der Anwendung von Dense-SIFT-De- skriptoren an Stelle von Lowe-SIFT-Deskriptoren wird das Ergebnis zu- sätzlich verbessert.
Schlüsselwörter:biomedizinische Literatur, multimodale Bildgebung, Hauptkomponentenanalyse, Random Forest, Support Vector Machines
Figure 1: Modality hierarchy to be used for prediction [11]
1 Introduction
Clinicians have implied on the importance of the modality of an image in several user-studies. The usage of modality information significantly increases the retrieval efficiency, thus the image modality has become an essential and relevant factor regarding medical information retrieval, as this helps to filter out irrelevant information from the retrieval process [1].
This task was proposed at the ImageCLEF 2015 Medical Classification Task [2] and this paper describes the modelling approaches done by the Biomedical Computer Science Group (BCSG) [3]. Several approaches were used by participating research groups such as the image tensor decomposition technique with maximum margin regres- sion (MMR) in [4], 2D color feature based covariance descriptors proposed in [5] and convolutional neural networks in [6].
In ImageCLEF 2010–2013, a similar task was proposed.
The two differences to ImageCLEF 2015 was an additional class ‘COMP’ representing compound figures with at least two subfigures and the size of the distributed collection.
The number of figures distributed for the task was 2,933 images. Various research teams proposed different approaches. In [7], a spatial pyramid on opponent SIFT with χ2SVM was applied. Multiple color and texture fea- tures combined with different fusing techniques were used in [8].
The aim of the ImageCLEF 2015 Medical Task was to adjust the task, by removing the compound class to avoid possible bias and by increasing the number of images in the collection to observe accuracy outcome on a larger database. The distributed image collection in ImageCLEF 2015 contains a total number of 6,776 images.
4,532 images in the training set and 2,244 images in the independent evaluation set. The proposed modality class hierarchy in Figure 1 was developed for images that occur in biomedical literature. The journal articles corres- ponding to the images were distributed as XML files, giv- ing the opportunity of using text information, such as captions and MeSH terms.
The objective in this proposed work is to extract visual and text information from biomedical literature images in a large database, model and train classifiers to auto- matically predict the modality using the hierarchical classification scheme in Figure 1. The classification scheme was proposed in [9]. Dimension reduction is computed using the principal component analysis as this was not evaluated in previous approaches.
The proposed approach can be mapped to other classi- fication problems in the medical field. For example, in- formation from clinical reports found in the Picture Archival and Communication System (PACS) can be used to index these reports to a defined classification scheme.
This leads to a more effective case retrieval search, as text information from clinical reports can be combined with the modality of medical images to filter relevant cases.
2 Materials and methods
This section describes in subsection 2.1 the image database distributed for the proposed task. The methods used for visual feature extraction are detailed in subsec- tion 2.2 and for text feature extraction in section 2.3. In subsection 2.4, the setup used for classification is de- scribed together with evaluated learning algorithms.
Pelka et al.: Modality prediction of biomedical literature images ...
2.1 Distributed image collection
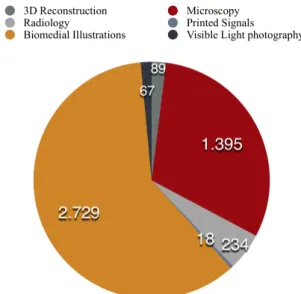
Before extracting features and training classifiers, an explorative analysis on the distributed training database was done. Some modality categories were represented by few annotated examples, thus the expansion of the original collection was strived in order to counteract the imbalanced dataset. The result of the analysis can be seen in Figure 2. The modality ‘GFIG’ which represents
‘statistical figures, graphs and charts’ has over 2000 annotated images in comparison to ‘GPLI’ representing
‘program listings’ with 1 annotated example.
Figure 2: Explorative analysis on the training set of the distributed image collection
Hence, additional datasets were created using the images distributed at the ImageCLEF 2013 AMIA Medical Task [1]. This could be done, due to the similarity of the modal- ity hierarchies used at both tasks. The four datasets de- tailed below were used for modality prediction:
1. DataSet1(DS1): The original training collection distrib- uted for the subfigure classification task in ImageCLEF 2015 Medical Classification.
2. DataSet2 (DS2): Additive to DataSet1, the complete collection distributed in ImageCLEF 2013 AMIA Med- ical Task. The collection contains over 300,000 anno- tated images from over 45,000 biomedical research articles of the PubMed Central repository (http://
www.ncbi.nlm.nih.gov/pmc/) hosted by the U.S. Na- tional Library of Medicine.
3. DataSet3 (DS3): Additive to DataSet1, the collection distributed for the Modality Classification Image- CLEF2013 AMIA Medical Subtask. This is a sub-collec- tion of DataSet2and contains figures annotated into 31 categories. Figures belonging to the compound figure ‘COMP’ category were eliminated to attain the same categories as in DataSet1.
4. DataSet4 (DS4): The sub-collection for the Modality Classification Task as in ImageCLEF 2013 AMIA Medical Task but without the ‘COMP’ category.
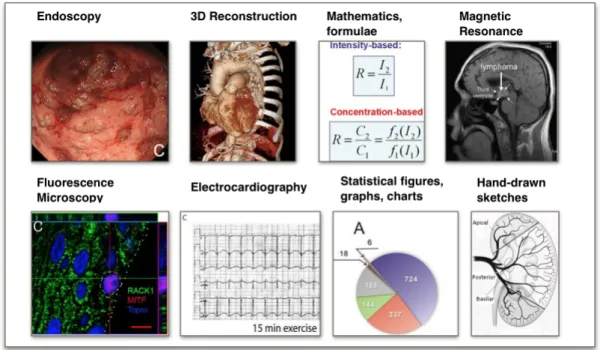
The distributed collection for training and evaluation contained grayscale as well as coloured images. Figure 3 shows some examples of the images.
2.2 Visual features
Medical imaging techniques have been enhancing over the years, bringing along additional possibilities of de- tailed diagnosis as well as several useful clinical applica- tions. These techniques have different acquiring methods and hence several feature extraction methods are needed to capture the various characteristics found in medical imaging [10]. Analysing the modality classification hier- archy, it is necessary that the images are completely represented. Global features were extracted from the complete image and local features from subregions of the images.
The images were visually represented using various state- of-the-art feature extraction methods, which are common techniques used in computer vision.
2.2.1 Local features
Bag-of-Keypoints
In [11], [12], the Bag-of-Features approach was shown to achieve high prediction results. This approach origin- ates from the Bag-of-Words (BoW) approach which is frequently used for text categorisation. The Bag-of- Keypoints (BoK) proposed in [13] is based on vector quantisation of affine invariant descriptors of image patches. The advantages of this approach are computa- tional efficiency, simplicity and it’s invariance to affine transformations. These features have been extracted and represented using a 12000-dimensional vector. The Bag- of-Keypoints has become a common state-of-the-art technique for image classification.
The functions used for feature extraction are from the VLFEATlibrary [14]. Dense SIFT descriptors were chosen as visual key-points. The key-points were uniformly extrac- ted at several resolutions with an interval grid of 4 pixels.
The vl-phow function of [14] was used to extract the descriptors. To reduce computational time, k-means clustering with approximated nearest neighbours (ANN) [12] was applied. Thek-meanstechnique was computed on randomly chosen dense SIFT descriptors using the vl-kmeansfunction to partition intokclusters in order to minimise the within-cluster sum of squares [15]. Several parameters were used to tune the extraction of the BoK feature with respect to this specific task and data collec- tion. The tuning was done by applying the approach with parameter values other than default and analysing the effect on prediction accuracy. An excerpt of these para- meters is listed below:
• Initialisation: The centres ofk-meansclustering were initialised with random points.
• Codebook size: The number of keypoints used for vector quantisation was 12,000.
Figure 3: Examples of distributed images
• Convergence: A maximum number of 20 iterations was applied to allow thek-meansalgorithm to converge.
Detailed description of parameters for the VLFEAT func- tions can be found in [14].
Pyramid Histogram of Oriented Gradients
The Pyramid Histogram of Oriented Gradients was pro- posed in [16]. The idea of this approach originates from two sources: the image pyramid representation of [17]
and the Histogram of Gradient Orientation (HOG) of [18].
The proposed approach measures the shape correspond- ence between two images by the distance between their descriptors using the spatial pyramid kernel. Hence, the images can be represented by their local shapes as well as the spatial layout of the shapes. This feature was represented using a 630-dimensional vector.
2.2.2 Global features
Basic features
To obtain a global representation of the images, the fol- lowing high-level features were extracted: brightness, clipping, contrast, hueCount, saturation, complexity, skew and energy. These features were extracted using the LiRE Library [19]. The basic features (BAF) were represented as an 8-dimensional vector.
Color Edge Directivity Descriptor
The Color and Edge Directivity Descriptor (CEDD) is a low- level feature proposed in [20]. Using a 3bits/bin quant- ization, the feature incorporates color and texture inform- ation in a histogram. This feature is suitable for large image databases as the CEDD size per image is limited to 54 bytes. An advantage of the CEDD is the low compu-
tational power compared to that of MPEG-7 Descriptors.
The features were extracted using the cedd-matlab function and represented as a 144-dimensional vector.
Joint Composite Descriptor
The Joint Composite Descriptor (JCD) is a combination of two Compact Composite Descriptors: Color and Edge Directivity Descriptor (CEDD) and Fuzzy Color Texture Histogram (FCTH) [20]. The color information extracted from the two descriptors are derived using the same fuzzy system, hence combining the different texture areas is taken to be an optimised unification of both descriptors.
The feature is represented as a 168-dimensional vector and was extracted using [19].
Tamura
The Tamura features are texture features which strive to correspond to human visual perception and are useful for feature selection and texture analyser design [21].
The features consist of the following six approximated basic texture features: coarseness, contrast, directionality, line-likeness, regularity and roughness and were repre- sented as a 18-dimensional vector using [19].
Gabor
The texture feature based on Gabor functions were extrac- ted and represented as a 60-dimensional vector [22].
Fuzzy Color Histogram
As the Conventional Color Histogram (CCH) neither con- siders color similarity across different bins nor color dis- similarity in the same bin, a new color histogram repre- sentation Fuzzy Color Histogram (FCH) was presented.
Pelka et al.: Modality prediction of biomedical literature images ...
The proposed approach considers the color similarity of each pixels color associated with all histogram bins using the fuzzy-set membership function. Experimental results have shown that the FCH achieves better results than the CCH when applied for image indexing and retrieval [23], [24]. A 10-dimensional vector was used to represent the FCH features.
2.3 Text features
For text representation, the figure caption belonging to each image was used. The images in the ImageCLEF 2015 Medical Classification task are figures from biomed- ical literature which were published in PubMed Central (http://www.ncbi.nlm.nih.gov/pmc/) and are licensed for redistribution under a creative commons license. For each image in the collection, the corresponding journal article can be retrieved using the indexed image ID. The text representation of all images was computed using the Bag-of-Words approach.
Bag-of-Words
The Bag-of-Words (BoW) approach is a common method used for text classification. The text features are extracted by counting the frequency or presence of words in the text to be classified [25]. Hence, a dictionary has to be defined first. The dictionary generation was obtained using all words from all captions found in the distributed collection. Various text preprocessing procedures such as removal of stop-words and stemming using the Porter stemmer [26] were applied. The Porter stemming tech- nique aims to automatically remove suffixes in words to find terms with a common stem which usually have similar meanings. Striving to generate a dictionary con- taining relevant words to each modality class, the attrib- ute importance for all words was computed. This process was done by vector quantising all figures using the dic- tionary and then applying the χ2-test on the derived matrix.
A final dictionary containing 438 words was obtained by selecting words with attribute importance over the fixed cutoff threshold of 0.36 (maximum attribute importance).
Several dictionaries with other cutoff thresholds [minim- um attribute importance 0 and mean attribute importance 0.15] were created in the development stage. However, the dictionary containing 438 words (cutoff 0.36) proved to achieve the best prediction results in the development set.
2.4 Classifier setup
To reduce computational time, the feature dimensions were reduced using principal component analysis [27].
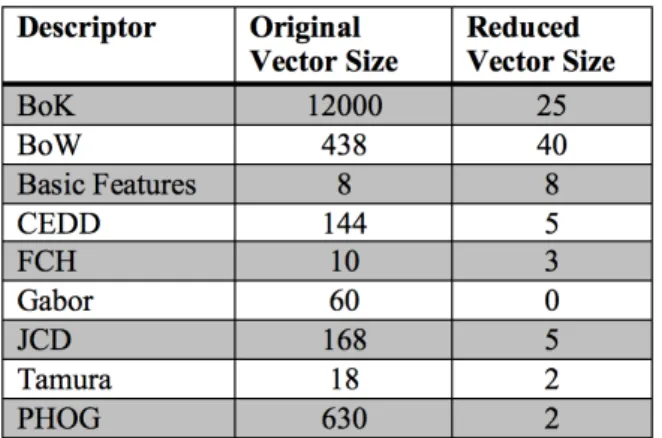
The Principal Component Analysis (PCA) replaces the original variables by a smaller number of derived vari- ables, the principal components, which are linear combin- ations of the original variables [28]. The PCA was applied on all features beside the basic features. Table 1 displays
the original and reduced vector size after computing the principal component analysis on the features.
Table 1: Descriptors with original and reduced vector sizes
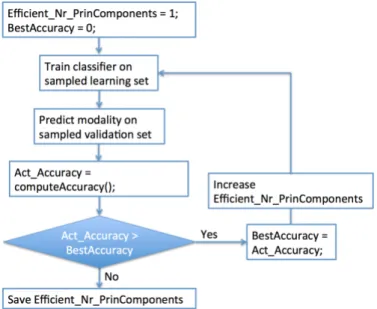
The PCA is separately computed on each feature vector group, which is displayed in Figure 4. Subsequently, the best number of principal components needed to describe the various features were estimated iteratively by model selection. This step is described in Figure 5. The PCA was computed on the complete data collection, i.e. training and test set. The pca function from the MATLAB software package [29] was used with default values. The applica- tion of this unsupervised learning proved to be a better approach in comparison to a separate projection of the test data.
Several runs were submitted for prediction evaluation accuracy. These runs are a different concatenation of the derived principal components from the feature groups.
The reduced vector size for the Gabor features is 0 as they were not added to the final fused feature vector.
This was done as the principal components from the Gabor features did not improve prediction accuracy.
During development stage, the ImageCLEF 2015 training database was divided into 10 randomly generated training and validation datasets using the bootstrap algorithm [30]. Approximately 68.2 (%) of the images were used for training and 31.8 (%) for validation. For the official evalu- ation, the complete training set was used for training and the distributed test set for prediction. A Random Forest classifier [31] was used for modality prediction. The Random Forest approach combines several tree predict- ors in a way that each tree is dependable on the values of a Random vector which is sampled independently using the same distribution for all trees in the forest.
The classifier was modelled with thefitensemblefunction from the MATLAB software package [29]. The list below shows an excerpt of parameters from the fitensemble function that were tuned.
1. Number of trees = 500
2. Number of leaf size = [0.04, 0.06, 0.3]
3. Split criterion = Deviance (max. deviance reduction) 4. Ensemble grown = By resampling
The parameters were tuned by modelling the classifier with thefitensembledefault values. Each parameter is
Figure 4: Early fusion classifier setup using Random Forest or Support Vector Machines
Figure 5: Iterative step to detect efficient number of principal components
then assigned a different value and the outcome on the prediction accuracy is noted. When a parameter proves to achieve better results compared to the default values, the changed values are used. This step was manually done repeatedly and is similar to Figure 5.
In addition to the Random Forest classifier, a multiclass linear kernel Support Vector Machines (SVM) was mod- elled using the LibSVM library [32]. SVMs are a common machine learning method used for regression and classi- fication tasks. This step was done in order to compare prediction accuracies between the two classifiers. SVMs
have been a popular approach in former ImageCLEF medical challenges [1] and have proved to achieve good results.
Figure 4 shows the classifier setup for the early fusion prediction using either the Random Forest learning al- gorithm or the support vector machines learning al- gorithm. The late fusion classification setup is similar to that shown in Figure 4. The final prediction is obtained by combining the predicted results from the Random Forest classifier and from the support vector machine classifier.
Pelka et al.: Modality prediction of biomedical literature images ...
Table 2: Submitted runs for evaluating prediction accuracy
The SVM classifier was tuned similar to the Random Forest classifier. Several parameters were assigned val- ues other than the default values and the outcome on the accuracy is noted. Different kernel functions were tested. The list below shows the best values for the svmtrain function.
1. SVM_type = Classification SVM 2. Kernel function = linear 3. Cost parameter = 0.05 4. Probability estimates = 1
3 Results
This section describes the results obtained using the proposed modelling approach at the ImageCLEF 2015 Medical Classification Task. The setups for all submitted runs are described as well as the achieved official evalu- ation prediction accuracy in subsection 3.1 and 3.2. The classification rate (%) obtained using a different hierarchy level as that of the submitted runs and different param- eters for the classifier are outlined in section 3.3. After the test set ground truth was distributed, an ex-post analysis was computed. This was done to detect the contribution each feature has to the overall prediction accuracy. The feature contribution is described in section 3.4. In section 3.5, other findings of this experimental modelling approach are listed.
3.1 Runs
Eight runs belonging to the three submission categories:
Visual, Textual and Mixed were submitted for evaluation.
The submission category ‘Mixed’ represents a combina- tion of visual and text features. Six of the submitted runs belong to Mixed, one to Text and one to Visual. This de- cision was made because not only better accuracies were obtained during development, but also evaluation results presented by other ImageCLEF participant groups in the
previous years have proven to be better when the ‘Mixed’
submission category is used [1], [33].
3.2 Evaluation results
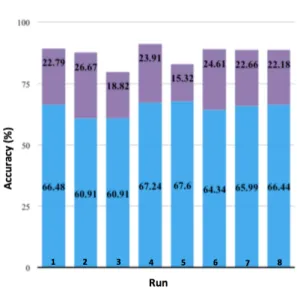
In Figure 6, the prediction accuracies (%) achieved with the eight runs described in section 3.1 are displayed.
Each bar represents the different feature combinations as mentioned in Table 2. The blue parts show the official prediction accuracies obtained at evaluation and the purple parts display the difference to the prediction ac- curacies obtained during the development stage.
Figure 6: Official evaluation prediction performance of the submitted runs in blue bars and difference in performance at
development stage in purple bars
Run1 and Run4 are significantly (p<0.05) better than other submitted runs but not among each other.
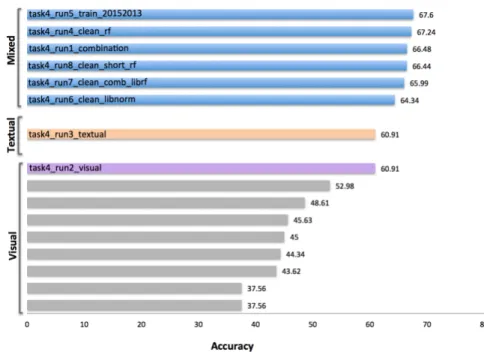
The Biomedical Computer Science Group (BCSG) outper- formed all other participants in all submission categories [34]. This is displayed in Figure 7. The coloured bars dis- play the results of the submitted runs and the gray bars
Figure 7: Official prediction performance. Colored bars represent the performance of BCSG and gray bars of other participants.
that of other participants [5], [6]. The BCSG was the only participant to use both visual and text features.
3.3 Development results
Number of Random trees
Several numbers of trees were used to tune the Random Forest classifier on the development set. Increasing the number of trees showed to improve the accuracy:
[100 trees = 87.9%, 500 trees = 90.12 % and 1000 trees
= 90.54%]. Adjusting the number of trees to more than 1000 trees lead to a slight increase in accuracy but in- creased computational time.
Bag-Of-Words Dictionary Generation
The effect of the χ2-test in the text preprocessing stage was evaluated. A dictionary for the BoW approach was generated by deliberately omitting the application of the χ2-test to calculate attribute importance. The prediction accuracy obtained was approximately 4% less.
Flat Hierarchy Classification Scheme
The Random Forest and SVM classifiers were trained using different hierarchy interpretations of the classifica- tion scheme proposed in [2]. In Table 3, the results of the deep hierarchy interpertation is listed. Thus, the first level is “Modality Classification” containing two classes
“Diagnostic images” and “Generic biomedical illustra- tions”. The final prediction accuracy obtained using this method is listed in the row “Complete Classification” and is 67.07 (%).
This observation was computed using DataSet4and the Bag-of-Keypoints and Color and Edge Directivity Descriptor
features. Table 3 shows the prediction accuracies (%) obtained at the various hierarchy levels. Random Forest was used as learning algorithm.
Table 3: Prediction accuracy (%) obtained using deep hierarchy interpretation on the DataSet4training set
3.4 Feature contribution
In an ex-post analysis, the contribution of all features was evaluated. The contribution of a feature to prediction performance is an important attribute that assists effi- cient feature selection. To compute each feature contri- bution, the difference between the accuracy when all features are combined and the accuracy when a certain feature is omitted was calculated. This step was com-
Pelka et al.: Modality prediction of biomedical literature images ...
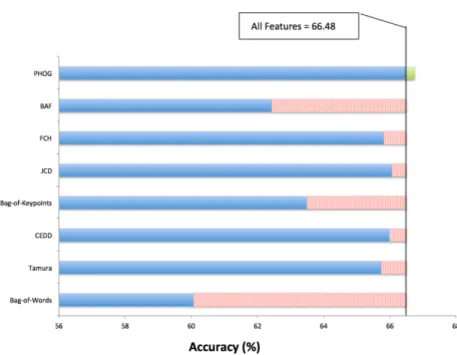
Figure 8: Feature contribution of all extracted visual and text representation used for modality prediction
puted by applying the classifier model setup Run1 on the original evaluation set.
The calculated feature contribution of all features is dis- played in Figure 8. It can be seen that omitting most of the extracted features led to a negative effect on predic- tion performance. In contrary, the omission of the PHOG feature has a positive effect on the prediction perform- ance and hence increased the evaluation accuracy with +0.27 (%).
As can be seen, the BoK, BoW and Basic Features con- tributed the most to the overall prediction performance.
The extracted Gabor features were not added to the final fused feature vector used for classification. This was done as the principal components from the Gabor image re- presentation did not improve prediction accuracy at de- velopment stage.
3.5 Findings
Negative differences in prediction performance were ob- served in the following:
• when the Bag-of-Keypoints visual representation was computed using Lowe SIFT descriptors [35] instead of dense SIFT descriptors
• when feature vectors were not normalised before training the classifier
• when single precision format was used instead of double precision format to define floating-points numbers
Computing the PCA on the complete data collection as described in section 2.4 proved to be a better approach.
The prediction accuracy increased [~4%] when the unsupervised learning information was added. The pre- diction accuracy for Run2 was 60.91 (%) with unsuper- vised learning information and 56.63 (%) without.
4 Discussion
Various classification prediction approaches using mul- tiple feature fusion and combinations of learning al- gorithms were explored for predicting the modality of biomedical literature images. There is a discrepancy between prediction performance on the evaluation set and on the sampled training and validation sets. This can be seen in Figure 6 and is taken to be an overfitting problem. The overfitting problem is assumed to be caused by the process of finding the efficient number of principal components. That is, the number of principal components were chosen based on the positive effect on the results recorded during development stage. This method was not representative on the official test set. On the other hand, supplementing visual image representation with corresponding text representation proved to be a benefi- cial strategy regarding classification accuracy. Omitting any of the described features apart from the PHOG fea- ture, resulted in a decrease on the official evaluation ac- curacy.
4.1 Future work
Regarding the overfitting problem, a data augmentation approach will be done to increase the training set to tackle the problem of the unbalanced dataset. Convolu- tional neural networks are currently a common approach used for prediction tasks, hence an approach using this method will be computed in order to compare accuracies and detect limitations. The process of finding efficient numbers of principal components should be computed less dependently on the training set. This will lead to a more reliable and independent classification approach.
In addition, more features for shape representation will be extracted.
5 Conclusion
In this work, the modelling approaches applied to predict the modality of biomedical literature images are presented. Several state-of-the-art features for visual and text representation of all images were extracted. These features were selected in order to distinguish between 30 modalities. To reduce computational load, the principal component analysis was applied. Two classifiers, Random Forests with 100–500 deep trees and a multi class linear kernel SVM with C=0.05, were used for training and pre- diction. The proposed approach was applied on the Im- ageCLEF 2015 Medical Classification Task and outper- formed all other participants.
Notes
Competing interests
The authors declare that they have no competing in- terests.
References
1. G. Seco de Herrera A, Kalpathy Cramer J, Demner Fushman D, Antani S, Müller H. Overview of the ImageCLEF 2013 Medical Tasks. In: Forner P, Navigli R, Tufis D, Ferro N, editors. Working Notes for CLEF 2013 Conference, Valencia, Spain, September 23-26, 2013. (CEUR Workshop Proceedings; 1179). Available from: http://ceur-ws.org/Vol-1179/CLEF2013wn-ImageCLEF- SecoDeHerreraEt2013b.pdf
2. G. Seco de Herrera A, Müller H, Bromuri S. Overview of the ImageCLEF 2015 Medical Classification Task. In: Cappellato L, Ferro N, Jones GJF, San Juan E, editors. Working Notes of CLEF 2015 - Conference and Labs of the Evaluation Forum, Toulouse, France, September 8-11, 2015. (CEUR Workshop Proceedings;
1391). Available from: http://ceur-ws.org/Vol-1391/172-CR.pdf 3. Pelka O, Friedrich CM. FHDO Biomedical Computer Science Group at Medical Classification Task of ImageCLEF 2015. In: Cappellato L, Ferro N, Jones GJF, San Juan E, editors. Working Notes of CLEF 2015 - Conference and Labs of the Evaluation Forum, Toulouse, France, September 8-11, 2015. (CEUR Workshop Proceedings;
1391). Available from: http://ceur-ws.org/Vol-1391/14-CR.pdf 4. Rodríguez-Sánchez AJ, Fontanella S, Piater J, Szedmak S. IIS at
ImageCLEF 2015: Multi-label classification task. In: Cappellato L, Ferro N, Jones GJF, San Juan E, editors. Working Notes of CLEF 2015 - Conference and Labs of the Evaluation Forum, Toulouse, France, September 8-11, 2015. (CEUR Workshop Proceedings;
1391). Available from: http://ceur-ws.org/Vol-1391/67-CR.pdf 5. Cirujeda P, Binefa X. Medical Image Classification via 2D color feature based Covariance Descriptors. In: Cappellato L, Ferro N, Jones GJF, San Juan E, editors. Working Notes of CLEF 2015 - Conference and Labs of the Evaluation Forum, Toulouse, France, September 8-11, 2015. (CEUR Workshop Proceedings; 1391).
Available from: http://ceur-ws.org/Vol-1391/44-CR.pdf 6. Lyndon D, Kumar A, Kim J, Leong P, Feng D. Convolutional Neural
Networks for Subfigure Classification. In: Cappellato L, Ferro N, Jones GJF, San Juan E, editors. Working Notes of CLEF 2015 - Conference and Labs of the Evaluation Forum, Toulouse, France, September 8-11, 2015. (CEUR Workshop Proceedings; 1391).
Available from: http://ceur-ws.org/Vol-1391/53-CR.pdf
7. Lazebnik S, Schmid C, Ponce J. Beyond bags of features: Spatial pyramid matching for recognizing natural scene categories. In:
2006 IEEE Computer Society Conference on Computer Vision and Pattern Recognition (CVPR ’06); 2006 Jun 17-22; Volume 2. 2006. p. 2169-78. DOI: 10.1109/cvpr.2006.68
8. Kitanovski I, Dimitrovski I, Loskovska S. FCSE at medical tasks of ImageCLEF 2013. In: Forner P, Navigli R, Tufis D, Ferro N, editors. Working Notes for CLEF 2013 Conference, Valencia, Spain, September 23-26, 2013. (CEUR Workshop Proceedings;
1179). Available from: http://ceur-ws.org/Vol-1179/
CLEF2013wn-ImageCLEF-KitanovskiEt2013.pdf
9. Abedini M, Cao L, Codella N, Connell JH, Garnavi R, Geva A, Merler M, Nguyen QB, Pankanti SU, Smith JR, Sun X, Tzadok A.
IBM Research at ImageCLEF 2013 Medical Tasks. In: American Medical Informatics Association (AMIA) ImageCLEF; Medical Image Retrieval Workshop; 2013. Available from: http://
www.cs.columbia.edu/~mmerler/IBM_CLEF13_WN.pdf 10. Chen Ch. Computer vision in medical imaging. Singapore: World
Scientific; 2013. (Series in Computer Vision; 2).
11. Müller H, Kalpathy-Cramer J, Demner-Fushman D, Antani S.
Creating a classification of image types in the medical literature for visual categorization. In: Proc. SPIE 8319, Medical Imaging 2012: Advanced PACS-based Imaging Informatics and Therapeutic Applications, 83190P (February 23, 2012).
DOI:10.1117/12.911186
12. Zhang H, Berg AC, Maire M, Malik J. SVM-KNN: Discriminative Nearest Neighbor Classification for Visual Category Recognition.
In: 2006 IEEE Computer Society Conference on Computer Vision and Pattern Recognition (CVPR ’06); 2006 Jun 17-22; Volume 2. 2006. p. 2126-36. DOI: 10.1109/CVPR.2006.301 13. Csurka G, Dance CR, Fan L, Willamowski J, Bray C. Visual
categorization with bags of keypoints. In: Workshop on Statistical Learning in Computer Vision, 8th European Conference on Computer Vision (ECCV); 2004; Prague, Czech Republic. p. 1-22.
14. Vedaldi A, Fulkerson B. Vlfeat: An Open and Portable Library of Computer Vision Algorithms. In: Proceedings of the 18th ACM International Conference on Multimedia; MM ’10; New York, NY, USA: ACM; 2010. p. 1469-72. DOI: 10.1145/1873951.1874249 15. Indyk P, Motwani R. Approximate Nearest Neighbors: Towards
Removing the Curse of Dimensionality. In: Proceedings of the 30th Annual ACM Symposium on Theory of Computing; STOC
’98; New York, NY, USA: ACM; 1998. p. 604–613. DOI:
10.1145/276698.276876
16. Hartigan JA, Wong MA. Algorithm AS 136: A K-Means Clustering Algorithm. J R Stat Soc Ser C Appl Stat.1979;28(1):100-8. DOI:
10.2307/2346830
17. Lux M, Chatzichristofis SA. Lire: Lucene Image Retrieval An Extensible Java CBIR Library. In: Proceedings of the 16th ACM International Conference on Multimedia; MM ’08; New York, NY, USA: ACM; 2008. p. 1085-88. DOI: 10.1145/1459359.1459577 18. Chatzichristofis SA, Boutalis YS. Compact Composite Descriptors
for Content Based Image Retrieval: Basics, Concepts, Tools.
Saarbrücken, Germany: VDM Verlag Dr. Müller; 2011.
19. Manjunath BS, Ma WY. Texture features for browsing and retrieval of image data. IEEE Trans Pattern Anal Mach Intell.
1996;18(8):837-42. DOI: 10.1109/34.531803
20. Tamura H, Mori S, Yamawaki T. Textural features corresponding to visual perception. IEEE Trans Syst Man Cybern. 1978;(8)6:460- 73. DOI: 10.1109/TSMC.1978.4309999
21. Han J, Ma KK. Fuzzy color histogram and its use in color image retrieval. IEEE Trans Image Process. 2002;11(8):944-52. DOI:
10.1109/TIP.2002.801585
22. Konstantinidis K, Gasteratos A, Andreadis I. Image retrieval based on fuzzy color histogram processing. Opt Commun. 2005; 248(4- 6):375-86. DOI: 10.1016/j.optcom.2004.12.029
Pelka et al.: Modality prediction of biomedical literature images ...
23. Bosch A, Zisserman A, Munoz X. Representing Shape with a Spatial Pyramid Kernel. In: Proceedings of the 6th ACM International Conference on Image and Video Retrieval; New York, NY, USA: ACM; CIVR '07; 2007. p. 401-8. DOI:
10.1145/1282280.1282340
24. Dalal N, Triggs B. Histograms of oriented gradients for human detection. In: 2005 IEEE Computer Society Conference on Computer Vision and Pattern Recognition (CVPR'05); Volume 1;
2005 Jun 20-25; San Diego, CA, USA. p. 886-93. DOI:
10.1109/cvpr.2005.177
25. Salton G, McGill MJ. Introduction to modern information retrieval.
New York: McGraw-Hill; 1983. (McGraw-Hill computer science series).
26. Porter MF. An algorithm for suffix stripping. Program.
1980;14(3):130-7. DOI: 10.1108/eb046814
27. Dunteman GH. Principal Components Analysis. A Sage University paper. Newbury Park, London, New Delhi: Sage publications;
1989. (Quantitative applications in the social sciences; vol. 69).
28. Jolliffe IT. Principal component analysis. 2nd ed. New York:
Springer-Verlag; 2002. (Springer Series in Statistics). DOI:
10.1007/b98835
29. Efron B, Tibshirani RJ. An Introduction to the Bootstrap. New York: Chapman & Hall; 1993.
30. Breiman L. Random Forests. Mach Learn. 2001;45(1):5-32. DOI:
10.1023/A:1010933404324
31. MATLAB. version 8.5.0.197613 (R2015a). Natick, Massachusetts: The MathWorks Inc.; 2015.
32. Chang CC, Lin CJ. LIBSVM: A library for support vector machines.
ACM Trans Intell Syst Technol. 2011;2(3):1-27. Article No. 27.
DOI: 10.1145/1961189.1961199
33. Kalpathy-Cramer J, de Herrera AG, Demner-Fushman D, Antani S, Bedrick S, Müller H. Evaluating performance of biomedical image retrieval systems – an overview of the medical image retrieval task at ImageCLEF 2004-2013. Comput Med Imaging Graph. 2015 Jan;39:55-61. DOI:
10.1016/j.compmedimag.2014.03.004
34. Villegas M, Müller H, Gilbert A, Piras L, Wang J, Mikolajczyk K, et al. General Overview of ImageCLEF at the CLEF 2015 Labs. In:
Mothe J, Savoy J, Kamps J, Pinel-Sauvagnat K, Jones GJF, SanJuan E, Cappellato L, Ferro N, editors. Experimental IR Meets Multilinguality, Multimodality, and Interaction. Springer International Publishing; 2015. p. 444–61. (Lecture Notes in Computer Science; Volume 9283). DOI: 10.1007/978-3-319- 24027-5_45
35. Lowe DG. Distinctive Image Features from Scale-Invariant Keypoints. Int J Comput Vision. 2004;60(2):91-110. DOI:
10.1023/B:VISI.0000029664.99615.94
Corresponding author:
Obioma Pelka
Department of Computer Science, University of Applied Sciences and Arts Dortmund, Germany
obioma.pelka@googlemail.com
Please cite as
Pelka O, Friedrich CM. Modality prediction of biomedical literature images using multimodal feature representation. GMS Med Inform Biom Epidemiol. 2016;12(2):Doc04.
DOI: 10.3205/mibe000166, URN: urn:nbn:de:0183-mibe0001665
This article is freely available from
http://www.egms.de/en/journals/mibe/2016-12/mibe000166.shtml Published:2016-08-24
Copyright
©2016 Pelka et al. This is an Open Access article distributed under the terms of the Creative Commons Attribution 4.0 License. See license information at http://creativecommons.org/licenses/by/4.0/.
![Figure 1: Modality hierarchy to be used for prediction [11]](https://thumb-eu.123doks.com/thumbv2/1library_info/4885564.1634190/2.892.176.711.117.496/figure-modality-hierarchy-used-prediction.webp)