A photonic crystal based sensing scheme for acetylcholine and acetylcholinesterase inhibitors
Christoph Fenzl, Christa Genslein, Alexander Z¨opfl, Antje J. Baeumner and Thomas Hirsch*
We present a new scheme for sensing biomolecules by combining an enzyme hydrogel with a photonic crystal hydrogel layer that responds to ionic strength and pH changes. We demonstrate this unique combination by successfully detecting acetylcholine (ACh) and acetylcholinesterase (AChE) inhibitors.
Specifically, the sandwich assembly is composed of layers of photonic crystals and a polyacrylamide hydrogel functionalized with AChE. The photonic crystalfilm has a red color and turns dark purple within 2–6 minutes of the enzymatic reaction upon analyte addition. This 3D photonic crystal sensor responds to acetylcholine in the 1 nM to 10 mM concentration range (which includes the relevant range of ACh concentrations in human bodyfluids). Michaelis–Menten kinetics of the enzyme were determined which correlated well with literature data demonstrating the uninhibited reactivity of the immobilized enzyme.
Furthermore, the presence of the acetylcholinesterase inhibitor neostigmine at concentrations as low as 1 fM was demonstrated, which is even below the necessary detection limit for clinical diagnostics. We suggest that this novel concept willfind its application in clinical diagnostics, for pesticide and nerve agent detection.
1 Introduction
Acetylcholine (ACh) is one of the most – if not the most – important neurotransmitters that plays an important role in the regulation of body processes e.g. as an activator of skeletal muscles.1 In human cerebrospinaluid the concentration of ACh is approximately 5 pmol mL1.2Measuring ACh concen- trations in humanuids is important for diagnostic analysis and evaluation treatment effects since a lack of ACh exists in certain diseases e.g. Alzheimer disease. Existing tools either permit only the indirect detection of ACh or show low signal-to- noise ratios.3,4 The enzyme acetylcholinesterase (AChE) is present at neuromuscular junctions and hydrolyses ACh.5 Hereby ACh gets inactivated and the concentration of the transmitter is regulated at the synapses.1,6This mechanism can be inhibited by acetylcholinesterase inhibitors (AChEIs) and as a consequence ACh breakdown is hindered. The concentration of ACh increases, which has major effects on the para- sympathetic nervous system for example reduce heart rate and muscle contractions. Persons concerned thus oen die of respiratory paralysis.7Known inhibitors are nerve agents such ase.g.sarin and tabun, pesticides (e.g.paraoxon and parathion) and drugs (e.g.tacrine, donepezil and neostigmine).8Some of the mentioned inhibitors are lethal at low concentrations and
were used as chemical weapons. Therefore sensors for the presence of AChEI are of great importance. Guet al.9present a dose–response assay of AChEIs based on droplet microuidics.
The authors determine the IC50values of carbaryl, chlorpyrifos, and tacrine by using electrochemical detection of reduced thio- choline. Saleemet al.10recently reported on inhibitor determi- nation based on photoluminescent p-type porous silicon. The authors are capable of detecting a concentration of 1.25 mg mL1 (3.7 mM) of neostigmine methyl sulfate through an increase of photoluminescence intensity at 640 nm. Neostig- mine is a parasympathomimetic drug that acts as an AChEI.
Concentrations in humanuids (plasma) for therapeutic indi- cations lie in the range from 0.001 up to 0.01mg mL1.11While the recent publications show great value and progress of reli- able AChEI detection, the therein presented detection schemes have a number of drawbacks. The preparation, characterization, modication and readout of a porous silicon wafer are time- consuming and require especially trained personnel.10Further sensitivity of this approach has to be improved a 100-fold to match the relevant concentrations of neostigmine in body
uids. This limits the use in point-of-care diagnostics. From all the acetylcholinesterase inhibitors, especially the sensing of organophosphate nerve agents has been of recent interest. For example, a supramolecular sensing array based on poly- (amidoamine) dendrimers12has been presented for the quali- tative and quantitative analysis of organophosphates in water, but no concentrations lower than 10mM have been detected.
Further, photonic crystal (PhC) sensors for these species based
Institute of Analytical Chemistry, Chemo- and Biosensors. University of Regensburg, 93040 Regensburg, Germany. E-mail: thomas.hirsch@ur.de; Fax: +49-941-9434064;
Tel: +49-941-9435712
Cite this:J. Mater. Chem. B, 2015,3, 2089
Received 27th November 2014 Accepted 19th January 2015 DOI: 10.1039/c4tb01970a www.rsc.org/MaterialsB
Materials Chemistry B
PAPER
Open Access Article. Published on 20 January 2015. Downloaded on 24/02/2016 14:24:38. This article is licensed under a Creative Commons Attribution 3.0 Unported Licence.
View Article Online
View Journal | View Issue
on acetylcholinesterase or organophosphorus hydrolase inhi- bition have been developed with detection limits of 4.26 fM for parathion and 0.2 mM for methyl paraoxon,13,14 but direct immobilization of the enzyme to the PhC limits detection range and sensor versatility.
In fact, photonic crystal chemical sensors have been devel- oped already for various analytes.15PhCs consist of periodically arranged structures16,17of a dielectric material oen stabilized by a polymer.18They reect light of a certain wavelength that is dependent on the angle of the incident light, the distances of particles within the structure, and the refractive indices of the structure and the surrounding medium.19The principle is based on Bragg's law of diffraction combined with Snell's law of reection and can be described by the following equation where Dis the center-to-center distance between particles,neffis the mean effective refractive index (RI),q is the angle of incident light,mis the order of reection, andlis the wavelength of the reected light:20–22
ffiffiffi8 3 r
D
neff2sin2q1=2
¼ml
The mean effective refractive indexneffis dened as follows, wherenpandnmare the refractive indices of the particles and surrounding medium, respectively, and Vp and Vm are the respective volume fractions:
neff2¼np2Vp+nm2Vm
If the initial particle to particle distance in the PhC isxed by a polymer and the angle of incident light is kept constant, changes in the reected wavelength will occur if the matrix swells or shrinks due to changes inDandneff.23This behavior can be rendered chemically selective. Since PhCs can easily be produced and their production be scaled-up, they afford a simple readout and offer label-free detection, they are highly attractive transduction systems for chemical and biosensors.15 In contrast to intensity-based detection principles,e.g.uores- cence, the wavelength change contains the analytical informa- tion. This is attractive in sensor development because background noise and low signal intensity do not impede the
performance. Hence, several PhC based approaches have been described for use in chemical18,24,25 and biological13,14,26–29
sensing.
In this work, we present a combination of a three-dimen- sional photonic crystal hydrogel lm with an acetylcholines- terase modied polyacrylamide gel to form a 2-layer system (Fig. 1). This arrangement responds highly selective to acetyl- choline in a wide concentration range, and is also able to detect the presence of AChEI at concentrations as low as 1 fmol L1.
2 Experimental section
2.1 Materials
Acetylcholine, acetylcholinesterase, acetylthiocholine iodide (ATChI), acrylamide, 2,2-diethoxyacetophenone, 5,50-dithiobis- 2-nitrobenzoic acid (DTNB), divinylbenzene (DVB), neostig- mine, sodium styrenesulfonate (NaSS), and styrene were purchased from Sigma-Aldrich (http://www.sigmaaldrich.com).
Acetic acid (AA), dibutyl sebacate, dimethylsulfoxide (DMSO), methanol, N,N0-methylenebisacrylamide, and sodium hydroxide were purchased from Merck (http://
www.merckgroup.com), sodium chloride from VWR (http://
www.vwr.com). Sodium bicarbonate was obtained from Ferak (http://www.ferak.de), and sodium persulfate (Na2S2O8) from Riedel-de Haen (http://www.riedeldehaen.com). The ion exchange resin (type AG-501 X8) was purchased from Bio-Rad (http://www.bio-rad.com), N,N,N0,N0-tetramethylethylenedi- amine (TEMED) from Serva (http://www.serva.de), and tetrahy- drofuran from Acros (http://www.acros.com). Styrene was freshly distilled and divinylbenzene wasltered through basic aluminum oxide before use in order to remove stabilizers.
2.2 Methods
2.2.1. Synthesis of particles.The negatively charged cross- linked polystyrene particles were synthesized as described previously by our group.25,30 Briey, styrene (18.8 g) and divinylbenzene (DVB; 1.2 g) were added to a volume of 152 mL of ultrapure and oxygen-purged water. The emulsion was heated to 91C under permanent stirring. Then, a solution of 207 mg of sodium styrenesulfonate (NaSS) in 5 mL of water was added.
Aer 3 min, 5 mL of an aqueous initiator solution containing 29 mg of NaHCO3and 76 mg of Na2S2O8 was injected. Aer additional 25 min of stirring, 10 mL of water as well as more monomers/initiator were added in the following order: (a) a mixture of 3.76 g of styrene and 240 mg of DVB, (b) a solution of 641 mg of NaSS in 5 mL of water, and (c) 5 mL of the aqueous initiator solution. Aer 1 h, the oil bath was removed and the mixture was allowed to cool to room temperature. The suspension wasltered through a double layer oflter paper.
For purication, 50 mL of the resulting suspension of nano- particles was centrifuged for 90 min at a relative centrifugal force (RCF) of 49 000g. The resulting sediments were suspended in 5 mL of water by vortexing and ultrasonic treatment. This procedure was repeated, and the resulting suspension was centrifuged again for 180 min (RCF 49 000g) and redispersed in 5 mL of water. The centrifuged suspension of nanoparticles was Fig. 1 The sensor consists of analyte permeable membranes assem-
bled on a glass slide. In the presence of analyte molecules the product of the resulting enzymatic reaction–acetic acid and choline–causes shrinkage of the PhC (left) due to the change of the electrostatic environment of the system. The change in the reflected wavelength is recorded with afiber optic spectrometer at afixed angle of 90to the light source (right).
Open Access Article. Published on 20 January 2015. Downloaded on 24/02/2016 14:24:38. This article is licensed under a Creative Commons Attribution 3.0 Unported Licence.
diluted with 50 mL of water and the temperature of the mixture was maintained at 85C. Aer 6 days, the particles were again centrifuged according to the above protocol.
2.2.2. Determination of particle size and surface charge.A 10mL drop of the suspension was placed on a carbon-coated copper grid. Aer drying, micrographs were acquired with a transmission electron microscope (TEM; type CM 12; from Philips, http://www.philips.com). Dynamic light scattering (DLS) measurements were carried out with the same suspen- sions using a Zetasizer Nano Series instrument (Malvern, http://
www.malvern.com) operated in the backscattering mode at an angle of 173at 25C aer temperature equilibration for 60 s.
Aer 20 consecutive measurements, the mean hydrodynamic radius and the polydispersity index (PDI) were extracted from the autocorrelation data.
Electrophoretic mobility of the nanospheres was measured by dispersing them at a concentration of approximately 8 g L1 in a 10 mM sodium chloride solution aer prolonged vortexing and sonication. Around 800mL of the particle suspension were
lled into a folded capillary cell (type DTS1060; from Malvern) and thermally held at 25C. Laser Doppler velocimetry with the Zetasizer nano series determined the mean electrophoretic mobility in 400 runs. The Smoluchowski model was used to calculate thez-potential of the dispersions.
2.2.3. Preparation of sensor lms. The hydrogel-based photonic crystal layer was prepared analogous to the protocol described previously.25,30Briey, acrylamide (50 mg) andN,N0- methylenebisacrylamide (2.5 mg) were dissolved in a suspen- sion of 1 mL of poly(styrene-co-sodium styrenesulfonate) nanoparticles (60 g L1) in ultrapure water. A solution of 10mL of 2,2-diethoxyacetophenone in 10mL of DMSO and 160 mg of ion-exchange resin was added. Aer intense vortexing and sonication, oxygen was removed by bubbling nitrogen through the vial. The suspension was injected into a polymerization cell consisting of two microscope slides and sidewalls consisting of a Paralm™ spacer with a thickness of 125mm. The gel was photopolymerized by UV irradiation at 366 nm (6 W) for 5 h, aer which it was fully polymerized but had not yet dried. The
lm was intensely washed with water. The amino groups were hydrolyzed to form carboxy groups by applying a mixture of 900 mL 1 M sodium hydroxide and 100mL TEMED. Aer 6 min, the
lm was thoroughly washed with ultrapure water.
The enzyme gel was prepared as follows: a polyacrylamide
lm was prepared exactly as described above, but instead of the photonic crystal dispersion only ultrapure water was used. The transparent gel was allowed to swell in ultrapure water for 24 h.
By placing the gel in a solution of 0.5 mg AChE (422 U) in 4 mL ultrapure water for 48 h, diffusion of the enzyme into the matrix was achieved. AChE was then covalently attached to the hydrogel with 1-ethyl-3-(3-dimethylaminopropyl)carboiimide (EDC) (25 mg mL1) for 1.5 h. The gel was washed several times to remove unbounded enzyme. The enzymelms were stored at 4C.
2.2.4. Characterization of the PhC hydrogel lm. The polyacrylamide hydrogel containing the poly(styrene-co-sodium styrenesulfonate) nanoparticles was dried under ambient conditions and sputter-coated with gold. The morphology of the
PhC lm was determined by scanning electron microscopy (SEM; type Ultra-55; from Zeiss, http://www.zeiss.com) operated at 5 kV.
2.2.5. Measurements of reected light of the PhC-enzyme gel-assay. The enzyme gel was placed on a microscope glass slide and covered by the hydrolyzed polyacrylamidelms with embedded polystyrene nanoparticles. Then, 500mL of the ana- lyte solutions with different concentrations were poured on the gel. The experimental arrangement to measure the reected wavelength as a function of concentration and time consists of an illumination source, a xenon lamp (0.5 W) that wasxed at an angle of 90 with respect to the optical ber, which was connected to an Ocean Optics USB 4000 spectrometer. The reection spectra were recorded with Ocean Optics SpectraSuite in reectance mode with an integration time of 100 ms per spectrum. The change of reected light was determined as a function of time. The same procedure was used for the analysis of the PhC lm alone without the enzyme gel in order to determine the PhC characteristics. All measurements were performed under ambient conditions at room temperature.
2.2.6. Measurement of the enzyme activity with Ellman's assay.A varied protocol of Ellman's assay31was used. Briey, acetylthiocholine iodide (ATChI), a mimic of ACh, serves as a substrate. A solution of 35 mM ATChI in 150 mM Tris buffer (pH 8.0) was diluted in order to cover a concentration range from 1 to 6 mM. 100mL of 10 mM 5,50-dithiobis-2-nitrobenzoic acid were added to the respective ATChI solution to yield a total volume of 3.5 mL. Then the enzymelm was placed into the solution and the UV-visible absorbance was measured against a 150 mM Tris buffer. The absorbance at 412 nm was monitored over a 2 min time period.
3 Results and discussion
3.1 Choice of materials and sensor design
We have shown previously25that 3D PhCs can be prepared very efficientlyviacontrolled assembly of periodic dielectric, highly charged, monodisperse polystyrene spheres. Styrene can easily be polymerized and cross-linked, and its size and low poly- dispersity can be well adjusted by surfactants. Styrenesulfonate functions as a secondary monomer introducing sulfonate groups providing a high surface charge. The fraction of reagents and the reaction conditions are the result of an optimization of the concentrations of the cross-linker and the initiator, and of polymerization time. Concentration, surface charge and size of the particles inuence the characteristics of the PhC. Surface charges and particle diameters that are too large will lead to particle–particle distances where diffraction occurs in the IR region rather than in the visible region. If, on the other hand, surface charge and spheres are too small, the opposite can be observed and the diffracted light will come to lie in the UV region so thatlms will appear colorless to the eye. Generally, the particle number densities must be in the proper range for light diffraction in the visible region to occur.
Polyacrylamide (PAM) is a good choice in terms of a matrix (host) material for the polystyrene particles as well as the enzyme gel. It is well permeated by ions and all of the Open Access Article. Published on 20 January 2015. Downloaded on 24/02/2016 14:24:38. This article is licensed under a Creative Commons Attribution 3.0 Unported Licence.
components are water-soluble and transparent, so that the structural colors of the photonic crystal dispersions can be recorded without the optical inuence of the hydrogel. In order to render the PhC sensitive to ionic strength and pH, the amido groups of PAM are (partially) hydrolyzed to form (anionic) carboxylate groups. That is also necessary in order to bind the enzyme covalently to the hydrogel. We have shown in an earlier study25that the reected wavelength of such generated sensor
lms is stable between 4 and 60C.
The combination of an acetylcholinesterase-modied PAM hydrogel with a PhC system sensitive to ionic strength resulted in a new sandwich-type sensor (Fig. 1) for the determination of acetylcholine and the detection of AChE inhibitors. The sand- wich-type arrangement enables great versatility as the selective unit of the enzyme hydrogel can deliberately be exchanged for the detection of other species. Furthermore, the color of the photonic crystal lm is dependent on the electrostatic envi- ronment within. Direct immobilization of the enzyme in the PhC– as practised in existing sensors13,14 – affects this envi- ronment and thus changes the color. By using two separate hydrogels the exact polymer composition can be chosen that bestts the user's needs without impeding the other compo- nent and thus strongly enhances versatility.
3.2 Characterization of the photonic crystal
The diameter of the polystyrene nanoparticles was determined by dynamic light scattering and transmission electron microscopy. As shown before,25,30 the physical radius (deter- mined by TEM) is smaller than the hydrodynamic radius (determined by DLS), as the high surface charge causes an extended hydration shell, which makes the particle appear larger in light scattering experiments. The mean diameter as calculated by evaluating 50 particles in the TEM image is 78 10 nm (Fig. 2A and B), while DLS measurements showed a hydrodynamic diameter of 106 nm with a polydispersity index of 0.10. A zeta potential of51.5 mV was calculated from the electrophoretic mobility data and proves the expected highly negative surface charge due to the presence of sulfonate groups in the polymer.
The polystyrene particles were previously shown to be stable at room temperature for over a year.25When assembled in the desired hydrogel, the PhC lm in its native form showed a strong violet reectance as expected which was easily seen using the spectrophotometer and the naked eye.
SEM images of the hydrogel (Fig. 2C) show that the nano- particles are homogenously distributed and show no local aggregation in the polyacrylamidelm.
3.3 Enzyme activity of the AChElm with Ellman's ATChI assay
We determined the enzyme activity with Ellman's assay. Over a 2 min time period the absorbance at 412 nm was monitored.
Applying Lambert–Beer law the absorbance was converted into the reaction rate (with a molar absorption coefficient of 1.36 104L mol1cm1for thep-nitrothiophenol anion at 412 nm).32 The AChElm displays Michaelis–Menten enzyme kinetics for
the hydrolysis of ATCh indicating that 9108mmol min1of active AChE are attached to the hydrogel. From Lineweaver–
Burk analysis theKmwas determined to be 9.8104mol L1 and the value obtained for maximum reaction rate vmaxwas 0.11 mmol min1. The obtained Km value agrees with those published.33,34The slight difference may be caused by the use of different substrates and methods or by alterations to the enzyme due to the immobilization procedure. Walker et al.13 used the Ellman's assay to analyze the enzyme activity of a PhC based organophosphate sensor system. They incubated thelm in a solution of 2000 U AChE in 4 mL 150 mM Tris buffer at pH 7.4 and determinedvmaxto be 2.4mmol min1. Thevmaxvalues are in the same order of magnitude. Considering the higher amount of AChE they used, the difference in vmax can be explained.
3.4 Features of the PhC sensor
The enzyme cleaves ACh into acetic acid and choline and thus creating a Donnan potential. This leads to a change of the electrostatic environment of the sensor system and therefore to a blue shi of the reected wavelength of the PhC, as the hydrogel shrinks and the particle-to-particle distances become shorter.25 Initially the sensitivity of the PhC lm towards AA (106to 1 mol L1) was examined (Fig. 3).
Thelm shows a good sensitivity towards AA,i.e.from 104 to 102mol L1a shiof 150 nm of the reected wavelength from 550 nm to 400 nm was observed.
Fig. 2 (A and B) TEM images of monodisperse nanoparticles con- sisting of styrene, divinylbenzene and sodium styrene sulfonate. (C) SEM image of a dried photonic crystal hydrogel. Scale bars are 100 nm (A), 60 nm (B), and 200 nm (C).
Open Access Article. Published on 20 January 2015. Downloaded on 24/02/2016 14:24:38. This article is licensed under a Creative Commons Attribution 3.0 Unported Licence.
Subsequently, the reected light was recorded over time for 16 min in order to determine the sensitivity of the sensor arrangement towards acetylcholine and to examine the overall kinetics of the PhC–enzyme gel assembly (Fig. 4).
The value at 0 min represents the reected wavelength of the PhC lm immersed in the corresponding solution before placing it on the enzymelm, whereby it is ensured that the resulting wavelength shiis only triggered by the formation of acetic acid. At increasing ACh concentrations, the reected wavelength blue shis. This correlates with an increasing formation of acetic acid. At a concentration of 109 M, the formation of the resulting acetic acid is too low to affect the PhC
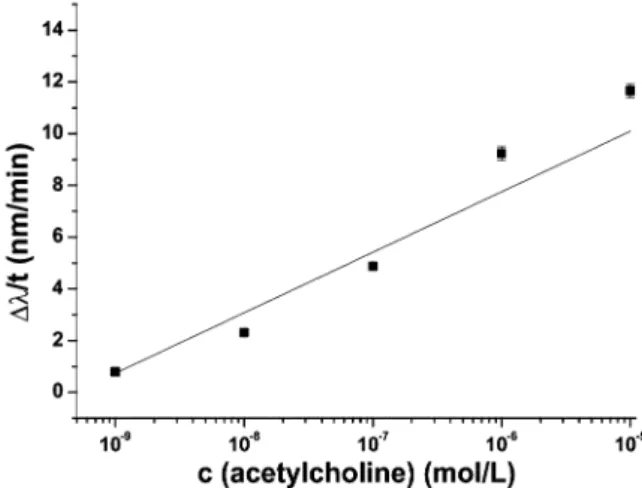
lm and consequently only a slight shiof the reected wave- length occurs. For better illustration, Fig. 5 shows the change in reected wavelength per time aer 6 min.
With increasing ACh concentration the reaction rate also increases. Employing the Michaelis–Menten enzyme kinetics model, Km and vmaxof the PhC–enzyme lm assembly were calculated to be 6.4 109 mol L1 and 5.8 nm min1, respectively. The obtainedKm value differs signicantly from the values obtained without the presence of the PhClm. The fact that it is 105times lower is thus explained by the added diffusion of the analyte through, in total, two different gel matrices which affects the diffusion coefficient signicantly.
The linear concentration range (in the logarithmic scale) of the 3D PhC sensor system is from 109to 105mol L1, so the sensor could also be used for measuring ACh in bodyuids, but an additional sample pre-concentration step would be advan- tageous, as the concentration of ACh in human beings (5 109mol L1)4is on the lower end of detectable concentrations.
Advantages of this sensing scheme are the full reversibility of the signal and the quick response. One challenge that one must always face when working with enzymes is the inactivation of the enzymelm, which in this case occurs aer ten measure- ments. However, in real-world measurements, single-use systems that are calibrated prior to use are in any event preferred in order to avoid contamination.
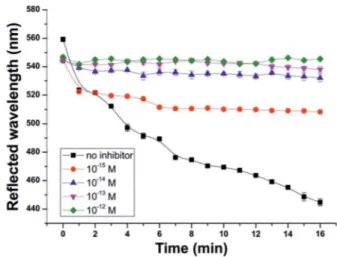
In addition to the determination of acetylcholine, this 3D PhC sensor system is also able to detect smallest concentrations of an enzyme inhibitor such as neostigmine. In order to quan- tify the enzyme inhibition, the AChE lm was immersed in solutions with 105 mol L1 ACh and additionally varying concentrations of neostigmine bromide as an AChEI (Fig. 6).
Neostigmine bromide itself does not inuence the reected wavelength of the PhC sensor over the whole concentration range used in these experiments.
The addition of AChEI decreases the maximum wavelength shiof reected light. Even at the low inhibitor concentration of 1015mol L1a decrease of the maximum shiof 63 nm is observed aer 16 min. This means that thenallm color is no longer blue (445 nm) but green (508 nm) with the inhibitor Fig. 3 Effect of solutions of acetic acid with varying concentrations on
the wavelength of reflected light of the PhC film. Each data point presents the average value of five measurements; the error bars indicate the standard deviation of these measurements.
Fig. 4 Time-resolved effect of solutions of acetylcholine at varying concentrations on the reflected wavelength on the PhC–enzymefilm assembly. Each data point presents the average value of five measurements; the error bars indicate the standard deviation of these measurements.
Fig. 5 Change in reflected wavelength over time after 6 minutes (reaction rate) at varying concentrations of ACh. Each data point presents the average value of five measurements; the error bars indicate the standard deviation of these measurements.
Open Access Article. Published on 20 January 2015. Downloaded on 24/02/2016 14:24:38. This article is licensed under a Creative Commons Attribution 3.0 Unported Licence.
concentration as low as 1015 M. Since this color change is visible to the naked eye and additionally the concentration of inhibitor in humanuids11is in the range of 109to 108mol L1, simple detection of the presence or absence of inhibitors is easily feasible. The detection limit of 1 fmol L1neostigmine is even lower than the LODs of enzyme-based PhC sensors of Asheret al.
for parathion13 (4.2 fmol L1) and for methyl paraoxon14 (200 nmol L1).
4 Conclusion
We present a 2-layer approach towards optical sensing of acetylcholine and detection of an acetylcholinesterase inhibitor using photonic crystal sensor technology. The biosensor is able to detect ACh in the 109to 105mol L1concentration range over which a visually and instrumentally detectable wavelength shiof 70 nm is induced aer just 6 min and of 115 nm aer 16 min. This range also covers the concentration of ACh found in bodyuids. The sensorlms can be prepared from affordable materials with low production times. Aside from visual analysis, thelms can be read out with a reection spectrometer in the visible part of the spectrum. In addition, it was possible to detect the acetylcholinesterase inhibitor neostigmine at such low concentrations as 1 fmol L1, where the maximum signal change is reduced from 115 nm (without inhibitor) to 52 nm.
Other features include the fast response, the lack of photo- bleaching, full reversibility on exposure to plain water, and inertness to changes in stability as shown in previous work.25
We also examined kinetics of the enzyme hydrogellm. Our results show slightly slowed substrate turnover due to diffusion processes in this hydrogel sandwich assembly.
We thus demonstrated that this biosensor is a powerful tool for the determination of ACh concentrations as well as single- use detection of AChE inhibitors most importantly enabling visual readout as well as rened instrumental quantitation. The
low-cost production and bare-eye readout possibility render this detection system suitable for test stripes. In a dip-stick format the sensor therefore lends itself nicely to point-of-care appli- cations. While shown here using acetylcholinesterase as a model biorecognition element, the fact that the PhC-based 2- layer technology is sensitive to ionic strength/pH makes it an extremely interesting principle for a variety of bioanalytical applications including clinical analysis, for pesticide and nerve agent detection. Thus, the biosensor's principle will be adapt- able to a large number of other health parameters and even to sensor arrays for multiple point-of-care diagnostics.
Acknowledgements
We thank Dr S. Wilhelm for the TEM investigations, Mr M.
Kirchinger for preliminary work in the assembly of the PhC on the microscope slides. Mr M. K¨onig is thanked for assisting with the SEM investigations.
Notes and references
1 H. Soreq and S. Seidman,Nat. Rev. Neurosci., 2001,2, 294–
302.
2 L. Fr¨olich, A. Dirr, M. E. G¨otz, W. Gsell, H. Reichmann, P. Riederer and K. Maurer, J. Neural Transm., 1998, 105, 961–973.
3 Q. T. Nguyen, L. F. Schroeder, M. Mank, A. Muller, P. Taylor, O. Griesbeck and D. Kleinfeld,Nat. Neurosci., 2010,13, 127–
132.
4 N. Ziegler, J. B¨atz, U. Zabel, M. J. Lohse and C. Hoffmann, Bioorg. Med. Chem., 2011,19, 1048–1054.
5 A. Silver,J. Physiol., 1963,169, 386–393.
6 A. Schena and K. Johnsson,Angew. Chem., Int. Ed., 2014,53, 1302–1305.
7 J. L. Carey, C. Dunn and R. J. Gaspari, Respir. Physiol.
Neurobiol., 2013,189, 403–410.
8 M. Pohanka,Biomed. Pap., 2011,155, 219–223.
9 S. Gu, Y. Lu, Y. Ding, L. Li, F. Zhang and Q. Wu,Anal. Chim.
Acta, 2013,796, 68–74.
10 M. Saleem, L. P. Lee and K. H. Lee,J. Mater. Chem. B, 2014,2, 6802–6808.
11 R. Regenthal, M. Krueger, C. Koeppel and R. Preiss,J. Clin.
Monit. Comput., 1999,15, 529–544.
12 Y. Liu and M. Bonizzoni,J. Am. Chem. Soc., 2014,136, 14223–
14229.
13 J. P. Walker and S. A. Asher,Anal. Chem., 2005,77, 1596–
1600.
14 J. P. Walker, K. W. Kimble and S. A. Asher,Anal. Bioanal.
Chem., 2007,389, 2115–2124.
15 C. Fenzl, T. Hirsch and O. S. Woleis,Angew. Chem., Int. Ed., 2014,53, 3318–3335.
16 G. von Freymann, V. Kitaev, B. V. Lotsch and G. A. Ozin, Chem. Soc. Rev., 2013,42, 2528–2554.
17 S. Pal, P. M. Fauchet and B. L. Miller,Anal. Chem., 2012,84, 8900–8908.
18 C. Fenzl, T. Hirsch and O. Woleis, Sensors, 2012, 12, 16954–16963.
Fig. 6 Inhibition of the enzymefilm with solutions of 105M acetyl- choline and varying concentrations of the inhibitor as a function of the reflected wavelength. Each data point presents the average value of five measurements; the error bars indicate the standard deviation of these measurements.
Open Access Article. Published on 20 January 2015. Downloaded on 24/02/2016 14:24:38. This article is licensed under a Creative Commons Attribution 3.0 Unported Licence.
19 J. D. Joannopoulos, S. G. Johnson, J. N. Winn and R. D. Meade, Photonic Crystals: Molding the Flow of Light, Princeton University Press, 2nd edn, 2008.
20 H. Fudouzi,J. Colloid Interface Sci., 2004,275, 277–283.
21 Y.-J. Lee and P. v. Braun,Adv. Mater., 2003,15, 563–566.
22 C. I. Aguirre, E. Reguera and A. Stein, Adv. Funct. Mater., 2010,20, 2565–2578.
23 K. Lee and S. A. Asher,J. Am. Chem. Soc., 2000,122, 9534–
9537.
24 J.-T. Zhang, N. Smith and S. A. Asher,Anal. Chem., 2012,84, 6416–6420.
25 C. Fenzl, S. Wilhelm, T. Hirsch and O. S. Woleis,ACS Appl.
Mater. Interfaces, 2013,5, 173–178.
26 E. Tian, J. Wang, Y. Zheng, Y. Song, L. Jiang and D. Zhu,J.
Mater. Chem., 2008,18, 1116–1122.
27 J.-H. Han, H.-J. Kim, L. Sudheendra, S. J. Gee, B. D. Hammock and I. M. Kennedy,Anal. Chem., 2013,85, 3104–3109.
28 G. Deng, K. Xu, Y. Sun, Y. Chen, T. Zheng and J. Li,Anal.
Chem., 2013,85, 2833–2840.
29 C.-S. Huang, V. Chaudhery, A. Pokhriyal, S. George, J. Polans, M. Lu, R. Tan, R. C. Zangar and B. T. Cunningham, Anal.
Chem., 2012,84, 1126–1133.
30 C. Fenzl, M. Kirchinger, T. Hirsch and O. S. Woleis, Chemosensors, 2014,2, 207–218.
31 G. L. Ellman, K. D. Courtney, V. Andres jr and R. M. Featherstone,Biochem. Pharmacol., 1961,7, 88–95.
32 G. L. Ellman,Arch. Biochem. Biophys., 1959,82, 70–77.
33 F. B. Hasan, S. G. Cohen and J. B. Cohen,J. Biol. Chem., 1980, 255, 3898–3904.
34 A. Ordentlich, D. Barak, C. Kronman, Y. Flashner, M. Leitner, Y. Segall, N. Ariel, S. Cohen, B. Velan and A. Shafferman,J. Biol. Chem., 1993,268, 17083–17095.
Open Access Article. Published on 20 January 2015. Downloaded on 24/02/2016 14:24:38. This article is licensed under a Creative Commons Attribution 3.0 Unported Licence.