Smart environments without cameras:
Electrical Field Sensing for Human-Computer Interaction
Ubiquitous Computing Seminar FS2014 Student report
Marcel Geppert mgeppert@student.ethz.ch
ABSTRACT
In modern smart environments, traditional interaction devices such as keyboards or mice are often not available or at least not desirable. In some of today’s devices, touch sensing and computer vision for gesture recognition enables a more natural way of interacting. However, high cost, high bur- den of instrumenting the environment and other disadvan- tages limit their applications for pervasive computing sys- tems. One other possible method for the same functionality might be electrical field sensing. This work will highlight some disadvantages of computer vision systems for gesture recognition and give an overview of the state of the art in electric field sensing for Human-Computer Interaction. A focus will be set on passive electric field sensing where three research projects will be presented that try to leverage electri- cal field sensing for touch location detection, gesture recog- nition, activity recognition and location classification by in- troducing different methods for capturing gestures with elec- tric fields and evaluating the robustness of these methods.
INTRODUCTION
For many decades, keyboard and mouse have been the state of the art input devices for computers. Only relatively re- cently other methods have been widely spread. Modern touchscreens provide a fast and flexible way of interaction, but they are dependent of physical contact between the user and the device and are mostly unfeasible if the user wears gloves. Devices using computer vision to detect gestures such as the Microsoft Xbox Kinect [13] or the Leap Mo- tion Controller [6] enable an unencumbered control and their commercial success shows the demand for this kind of inter- action. However, these devices suffer from disadvantages of cameras that make them unusable in many situations.
A relatively unknown approach for Human-Computer Inter- action is to leverage the generation, reception and distortion of elecric fields by the human body. The basic function of this technique can be seen in nature on the Elephantnose Fish (Gnathonemus petersii), a weakly electric fish that uses the distortion of electric fields by surrounding objects to perceive its environment. The fields are generated by an electric or- gan in the tail and sensed by an electroreceptive surface on big parts of the body. An object with a lower permitivity than water would decrease the sensed electric field at a cor- responding body location, whereas an object with a higher permitivity would increase it.
The first technical use of electric field sensing was done by
Leon Theremin around 1920. For the after him named music instrument he used the coupling between the player’s body and two charged antennas to control the frequency and vol- ume of the produced sound. Some more recent research in the field will be presented in this work.
BACKGROUND
Disadvantages of Camera Systems
Vision is a very powerful and for humans probably the most important sense to perceive the environment. Unfortunately, cameras do not work like the human eye and therefore en- counter many disadvantages that are less present in human vision.
• Especially in the context of computer vision, cameras are very sensible to illumination. Whilst stable illumination might be established in a fixed environment, a high robust- ness to changing illumination is crucial for an application in mobile devices
• Most modern camera sensors produce a certain amount of noise. This noise may reach from ’grain’ in images taken in dark environments or with short exposure time to ’blooming’ or ’spilling’ of light sources, which means that a strong light source spills into neighbouring pixels.
Noise may e.g. confuse edge detection algorithms or even occlude important features of the scene.
• As every vision based system, computer vision suffers from occlusion of objects. For gesture recognition this problem is extended to self-occlusion if the user does not face the camera. The only way to solve this issue is to install multiple cameras, what results in high cost and in- stallation burden in fixed environments and might not even be possible in mobile devices.
• Cameras produce a high amount of data. To process this data, fast additional hardware is required.
• Cameras have a relatively high power consumption. An always-on camera for gesture recognition would signifi- cantly reduce the runtime of mobile devices.
• The need of multiple cameras, fast additional hardware and a strong power supply results in high cost for camera-based systems.
• A big concern about always-on cameras especially in the home environment is the privacy issue. Published infor- mation about common intelligence practices made people aware of the need to protect their privacy. Having cameras all around the house, possibly even connected to the inter- net might make people feel uncomfortable and cancel out the convenience of easy interaction.
These disadvantages make gesture recognition with com- puter vision unfeasible for many applications, especially for mobile devices. Electric field sensing might provide a very similar functionality and overcome some of these disadvan- tages.
Modelling Electric Fields in the Environment
Electric fields between two objects can be modelled with a capacitor, where the two sides of the capacitor represent the objects. With this model the body forms a capacitor with th ground and many capacitors with objects in the environ- ment. The most simple model of such a capacitor is a perfect parallel-plate capacitor, i.e. a parallel-plate capacitor that be- haves as if its plates were infinitely big. This model is already sufficient to give an intuition how movement of the body can be sensed using electric fields. Two basic formulas show the relation between different properties of the capacitor:
E= Q
A (1)
E= U
d (2)
whereE is the strength of the electric field, Qthe charge of the capacitor,U the voltage between the two plates,the permittivity of the isolator and dthe distance between the plates. From this we can derive the formula
U = dQ
A (3)
that shows that the voltage changes proportionally to the dis- tance and the inverse of the area since we can assume that the charge of the objects and the permittivity constant of the iso- lator do not change. As we can also assume that the voltage between environmental objects and the ground is constant, we can sense movement of the body by comparing the volt- age of the body to ground.
Electrical Field Sensing Methods
For electrical field sensing, two main approaches can be dis- tinguished: active and passive field sensing. With active field sensing a field is actively emitted and the distortion is mea- sured. Passive field sensing leverages special features or the distortion of already present electric fields in the environ- ment.
Mainly three different methods are used for active field sens- ing: loading mode, shunt modeandtransmit mode. These methods use different combinations of emitting and sensing electrodes to determine distance, movement and orientation of a human body.
Passive field sensing for HCI has only become a research topic very recently. Cohn [1, 2] presented a technique that measured the electric fields that are received by the human body to recognize touch positions on walls, indoor locations and full body gestures. Mujibiya [8] proposed an off-body sensing approach that uses very simple hardware to recog- nize full-body gestures and locations, but also activity recog- nition and related single event counting.
ACTIVE FIELD SENSING
As already mentioned, three different sensing methods for active field sensing in HCI are generally used:loading mode, shunt modeandtransmit mode. The loading mode is a mod- ification of the technique Theremin used already almost 70 years ago. A oscillator electrode forms a capacitor with the body. Since the capacitance of the body-to-ground ca- pacitor is much bigger than the capacitance of the body-to- electrode capacitor it acts as a virtual ground. When the body approaches the electrode, the capacitance of this ca- pacitor increases and the movement can be sensed by mea- suring the increase of the displacement current. One advan- tage of this technique is that only one electrode is needed and therefore the burden of installation is minimized. In shunt mode, an additional virtual ground electrode is used.
Again, the displacement current is measured, but at the vir- tual ground electrode. The approaching body again acts as a virtual ground and shunts parts of the signal which decreases the measured displacement current. In transmit mode the same oscillator/virtual ground electrode combination is used, but the body has either an electric connection or a capacitive coupling to the oscillator electrode what makes the body act as a sending antenna. The measured signal is then depen- dent of the distance between the body and the virtual ground electrode.
First detailed research in active electric fieldsensing for HCI was done at MIT by Zimmermann [14] and Smith [10, 11, 12] who developed the ”Fish”, a microprocessor based elec- tric field sensing unit and its successors the ”Smart Fish”,
”Lazy Fish” and ”School of Fish” that can be used for 3D position recognition of the hand. A recent product based on this research is the GestIC [7], a 3D tracking and gesture controller. Another approach was used in the DiamondTouch system [3] that emits different signals at different parts of a table and recognizes the touch location by determining which signal is received by the user. Some recent research using the loading mode is the Geremin project [4] that tries to leverage electric field sensing to control car functions with gestures while driving.
PASSIVE FIELD SENSING Electric fields in the environment
Electric fields are generated by all electric devices and are present almost everywhere in the environment. They may be static or oscillate with frequencies just above 0 Hz up to several GHz. In general these fields are considered as un- wanted noise, but they can be leveraged with electric field sensing. Since the sampling frequency has to be the double signal frequency to obtain a clear digital signal, mainly rela- tively low frequency fields are used for HCI to minimize the sensing complexity. Some electric field sources in the home as one possible field of application of electric field sensing will be presented. These can mostly also be generalized to many different indoor environments.
The strongest signals that can be usually measured in the home are emitted by the power lines. As the alternating cur- rent in the power lines, these fields oscillate with 50 or 60 Hz depending on the location. Also noise that is generated by devices and then coupled back into the power lines or re-
ceived radio transmissions can be measured. Even the noise from neighbouring houses influences the received signal.
Most modern devices use switched-mode power supplies to transform the received to the needed voltage. To do this, the AC from the power lines is first transformed to a very high frequency AC and then the voltage is transformed. This high frequency AC produces high frequency signals that are emit- ted directly and also coupled back into the power lines.
Other sources of electric noise are dimmers which are used in lamps and electric motors that can be found for example in hair dryers, drilling machines and fans.
On-body sensing
Recognizing Touch Locations on a Wall The first research in passive field sensing for HCI was done by Cohn [1]. It leverages the ”body antenna effect”, the ability of the human body to receive electromagnetic waves. Whilst this effect causes significant problems for systems analysing electrical phenomena in the body such as muscle activity, it can be leveraged to classify the received signal in different locations and positions. The received signal was captured at the neck, but later experiments suggest that similar results should oc- cur with other sensing positions such as the wrist, which is a benefit of the relatively high conductivity of the human body.
A comfortable to wear or even not recognizable sensor like in a wristwatch is crucial for the acceptance of such a sys- tem by the enduser. All measured data was recorded with 400 kS/s to capture a signal in the range of 0 to 200 kHz for further processing and classification after all measurements were taken.
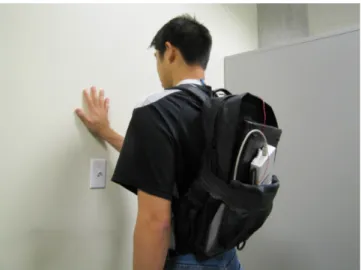
To validate the technique, an experiment was conducted in which touch positions on the wall should be recognized only by the differences in the received signal. In this experiment, 5 light switches and 1 blank wall spot above a power outlet were chosen in each of 10 different homes. These locations were chosen since the proximity to power lines promised a strong signal. At each of the 6 locations, 6 different touch gestures were performed by the participant. 5 of the gestures were contacts of the flat hand on, above, below, left and right of the chosen spot. The contacts around the spots were per- formed with approximately 20 cm distance to the spot. Fig- ure 1 shows a participant touching the wall at the ”above light switch” position. Additionally, a ”rest” gesture with the arms at the sides of the body and no wall contact was performed at each location. Each gesture was performed for several sec- onds and the captured signal then divided in short time win- dows (82 ms) that were separately processed and classified.
During the experiment, changes in the electrical system were minimized by turning off periodically state-changing devices such as computers, heating and air condition units. All light switches that were used in the experiment were switched on and the state of lights and appliances was kept constant for the time of the experiment.
For each time window the following features were computed:
• Mean voltage (DC voltage)
• Root-mean-square (RMS) value of voltage (AC voltage amplitude)
Figure 1: Participant performing a touch gesture above a light switch. The signal is measured at the partici- pant’s neck and than recorded by the data acquisition unit and a laptop in the bagpack. (Image from [1])
• All frequency bins between DC and 2 kHz (12 Hz resolu- tion) of a 32768-point FFT
• Frequency bins between DC and 25 kHz (200 Hz resolu- tion)
• Maximum values of frequency peaks at 20, 30, 50, 60, 80, 90, 110, 140 and 50 kHz
• Frequency samples between DC and 200 kHz (1 kHz res- olution)
All frequency features were used in both linear and log scale which leads to 1002 features for classification in total. The classification was done with machine learning using the Se- quential Minimal Optimization implementation of the sup- port vector machine in the Weka data mining software [5].
The 5-position classification of touch positions around a light switch achieved an average accuracy of 87.4%. The same classification on the blank wall achieved an average accuracy of 74.3%. This slightly worse result might date to the bigger distance of the spots to power lines and therefore a weaker signal.
The 6-location classification in the home achieved an average accuracy of 99.1% when using data from the ”contact ges- tures” at each location (i.e. the ”rest” gesture at each location was not used for classification). However, even without wall contact (i.e. using only the ”rest” gesture data) the achieved average accuracy was even 99.5%. One possible explanation for this result might be that the proportion of signal emitted from the power lines that should be relatively equal around the house is smaller in the ”rest” data.
In order to further understand the boundaries of this approach and to explore additional capabilities of this method, some additional experiments were conducted with only two partic- ipants. The used hardware and methodology was the same as in the previous experiment.
To explore the impact of the electrode position at the body, the 5-position classification of touch positions around a light
switch was repeated with the electrode placed at the partic- ipant’s forearm instead of the neck. The achieved accuracy was 98% and 97% for the two participants. This indicates that the electrode does not have to be worn at a probably uncomfortable position at the neck, but could be simply in- cluded in a wristwatch.
Classifying appliances by touching them could be a way to turn uninstrumented appliances into input devices. This should be relatively easy since most home appliances have large well grounded metal sections that should change the measured signal significantly. For the experiment, the partic- ipants touched each of six appliances in the same kitchen: re- frigerator, freezer, stove, microwave, dishwasher and tap. All appliances were plugged in, but not actively running. Sup- porting the hypothesis, the achieved accuracy was 100% for both participants.
To further increase the functionality, proximity sensing to a certain point could provide a more fine-grained input method than binary wall touches. To explore this ability, the Weka’s implementation of the Sequential Minimal Optimization re- gression algorithm [9] was used to determine the distance of the users hand to a light switch perpendicular to the wall in a range of 5 to 30 cm as well as in parallel to the wall on a horizontal line in a range of 10 to 60 cm. The overall RMS error was 4.1 cm for a distance perpendicular to the wall and 8.1 cm for a distance in parallel to the wall.
In the main experiments, all measurements ware taken with the light switch turned on to receive a strong signal. How- ever, the results for touches at the blank wall suggest that this might not be necessary. The 5-position classification around a light switch was repeated with the switch turned off. As expected a high accuracy was achieved with 99% and 97%
for the two participants.
Since the human body is not completely symmetric and the conductivity of the human body is not constant, one could expect the measured signal to be slightly different depending on which hand has contact to the wall. Additionally, contact with both hands should again change the received signal. In the experiments the participants were touching a light switch with the left, right or both hands. Achieved accuracies were 96% and 99%.
To refine the granularity even further, the number of fingers touching the wall might be another way to differentiate touch gestures at the same position. However, the average accuracy for classifying 1, 2, 3, 4, or 5 fingers of a single hand touching a light switch dropped to 53% and 59%. This result is most likely due to the very small changes in the contact area which result in small changes in the received signal.
Recognizing Whole-Body Gestures Motivated by these promis- ing results, a similar setup was used to classify full-body ges- tures without any wall contact [2]. Again, the voltage of the human body to a local ground signal was measured at the neck, but with a lower sampling rate of 250 kS/s what results in detectable frequencies up to 125 kHz. To increase the con- venience for the user, the data was captured by a small data acquisition unit and then wirelessly transmitted to a laptop
Figure 2: Mirror images of stick figures performing the 12 gestures (image from [2])
for recording and further processing.
In contrast to the previous experiment, start and endpoints of a gesture were not set manually, only a coarse timeframe was marked manually at measuring time. The exact seg- mentation was done automatically and offline after all data was measured. For the automatic segmentation the measured signal was down-sampled to a sampling rate of 244.14 S/s.
To this down-sampled data a low-pass filter was applied to extract the DC voltage offset. This offset was divided into 98 ms windows and for each window the interquartile range and the mean derivative of the DC voltage was computed. A static threshold was applied to the interquartile range and a dynamic threshold depending on the DC voltage waveform of the whole timeframe was applied to the mean derivative.
If at least one of the values exceeded its threshold the win- dow was considered active. The exact gesture was defined as the time from the first to the last active window within the coarse manual timeframe.
One disadvantage of the previous approach was the relatively large feature-set of 1002 features for each 82 ms window [1].
To reduce the size in this experiment a feature set consisting of the voltage mean (DC voltage), voltage RMS (AC voltage amplitude) and 17 frequency bins between DC and 500 Hz (30 Hz resolution) was computed offline for each of 7 equally spaced time windows per gesture. With the frequency fea- tures in both linear and log scale this resulted in 36 features per time window and 252 features per gesture. As in the pre- vious experiment, the classification was done with the SMO implementation of the SVM in the Weka software [5].
During the experiment, each participant performed 12 dif-
ferent gestures as shown in Figure 2. Each participant per- formed all gestures in two different indoor locations, the kitchen and the family room in his home.All together, 8 par- ticipants performed the gestures in 8 different homes. Again the heating and air condition of the houses were turned of to reduce changes in the electric system of the house. All lights in the used rooms were turned on and the state of nei- ther the lights nor appliances was manually changed during the experiment.
The achieved average accuracy for gesture recognition was 92.7%. For different locations the average accuracy of all gestures ranged from 86.5% to 98.3%. It is worth mention- ing that in average for all locations, only the accuracy for
”Left Wave” and ”Right Wave” was below 90% (83.9% and 79.2%). These two gestures got mostly confused with each other, which shows that the choice of gestures and the differ- ences between them is crucial for a very high accuracy. This observation is underlined by a slightly increased confusion rate between the ”Punch 2x, Kick” and ”Kick, Punch 2x”,
”Left Arm Down” and ”Right Arm Down”, and ”Step Left”
and ”Step Right” gestures. However, accuracy for all ges- tures except ”Left Wave” and ”Right Wave” ranged between 92.5% and 99.7%.
In addition to the gesture recognition a location classification was done with the same setup. For this experiment, 8 loca- tions were chosen in each of two homes. Two participants performed gestures in 5 of the 8 locations in different homes, a third participant in both homes. Two locations were shared between the participants in the same home. The signal was not captured over the whole gesture but only over 0.5 s after a manually set timestamp. To determine the impact of the size of the feature-set, the classification was done with the same features as in the gesture recognition experiment, but also with an extended feature-set. This extended feature-set con- sisted of the DC and RMS features, frequency bins between 0 Hz and 4 kHz (30 Hz resolution) and averages over a 1 kHz window between 0 Hz to 125 kHz with 1 kHz spacing.
All frequency features were normalized by the amplitude of the 60 Hz peak and expressed in both linear and logarithmic units. This resulted in an extended feature-set of 524 features in total.
Classifying between the 5 locations for each participant in one home resulted in an achieved average accuracy of 99.6%
with the extended feature-set. Also with the standard feature- set, a still very high accuracy of 97.1% was achieved.
To reduce the training time, a nice feature of the method would be the ability to classify locations that were trained by a different user. In a first test, classification of two locations where one participant’s data was used to train the classifier and a second participant’s data was used for testing, an ac- curacy of 100% with the full feature set and 96.3% with the standard feature set was achieved. Additionally, running the test with the 5 locations (of which 2 locations where shared between the users) as training data resulted in an accuracy of 96.1% using the full feature set and 84.6% using the standard feature set.
The measurements for the gesture recognition took place
at 16 different locations in total (2 locations in each of 8 homes). In each home, the data was captured with a dif- ferent participant. Using this data for location classification resulted in an accuracy of 99.4% with the full and 94.1% with the standard feature set.
Despite the high recognition accuracy, gestures to control the environment are almost useless if the data has to be processed offline. Therefore an interactive processing system was pro- posed. To reduce the bandwidth, the sampling rate of the data acquisition unit was lowered to 976.56 S/s. For the segmen- tation of the signal, it was down-sampled again to 244.14 S/s and divided into 33 ms frames. By applying a low-pass fil- ter the DC voltage offset was extracted from the signal. The finite difference of the offset was computed as the sample-to- sample difference. If the mean value of this finite difference in a frame exceeded a static threshold, the frame was consid- ered as active. Additionally, inactive periods of less than 197 ms were also considered to be active. A gesture was then defined as the longest possible sequence of adjacent active frames. The feature extraction was done in parallel to the segmentation. For the time domain features the signal was again down-sampled to 244.14 S/s and the voltage mean and RMS was computed for each 33 ms frame. For the frequency domain, 17 frequency bins between 0 Hz and 500 Hz with 30 Hz resolution were computed as in the offline algorithm for each 1.06 s window. When a gesture was detected, the time frame was divided into 5 equal sized windows and for each window an average of the corresponding, previously com- puted frames was computed for each feature. With these fea- tures the gesture was then classified by a previously trained SVM as in the offline algorithm.
Limitations While the presented results are already promis- ing, this system still has some strong limitations. First of all, the system is very sensible to changes in the electric en- vironment. The presented results were achieved in a con- trolled environment with minimized changes. Such an en- vironment cannot be considered for an end-user application and already small changes to the environment could signifi- cantly the achieved accuracy. One possible approach for this problem could be to monitor the environment with an ex- ternal device, but further work has to be done in this field.
Second, the system needs samples of gestures and locations to train the classifier. However, gesture recognition has been shown to already achieve an accuracy greater than 80% when trained with only 4 samples per gesture. The presented in- teractive system increases the usability in comparison to the offline classification, but has a latency around 0.4 s which might still be too long for certain applications. Other meth- ods than the proposed system might decrease this value to a more ”real time” experience. The biggest limitation is, how- ever, that the user has to wear the sensor on the body. Al- though the experiments showed that the sensor can be placed at different locations of the body, it is still uncomfortable for the user to have to wear a sensor all the time.
Off-body sensing
To increase the comfort for the user, Mujibiya and Rekimoto presented theMiragesystem [8]. It senses the distortion of the environmental electric field by the human body without
Figure 3: Stick figures performing the gestures used in the gesture recognition experiment (image from [8])
any body contact to recognize different gestures and activi- ties and even count single events during an repeating activity.
The system can also be used to classify the location by mea- suring the surrounding electric fields.
In a simple model, the body is coupled to the environments by capacitors. The properties of these capacitors change with every movement. This leads to changes in the voltage be- tween the body and the ground. Additionally, the body is coupled to the sensing electrode by another capacitor whose properties change with the distance between the body and the electrode as well as with the voltage of the body to ground.
The changes can be measured as the changing voltage of the sensing electrode to ground.
Since only the distortion of the electric field by the human body was measured and the speed of the human movement is limited, a low sampling frequency was sufficient to cap- ture all necessary data and therefore cheap, low performance and low power consuming hardware was sufficient for the data capturing. In the experiment, an off-the-shelf microcon- troller was used with a sensing electrode attached to one of its analogue inputs. With this hardware, the sensor can be used environmentally, peripheral-attached or even as a mo- bile sensor.
For the activity recognition a signal was computed as the low-pass filtered input signal multiplied with a sensing offset.
The signal amplitude and frequency together with a spectral analysis of the input signal in the range of 0 to 10 Hz were sufficient to distinguish between different repeating activi- ties. To verify this approach an experiment was conducted in which the participants performed 5 different activities: not being present in the room, being present and standing still, walking, running and jumping. All activities were performed without locomotion in a distance of at most 2 m to the sen- sor. The classification of the signal was done using the SMO implementation of the SVM included in the Weka software [5]. The achieved average accuracy was 96.72% for the clas- sification between 5 activities. The single event count during an activity, which was done only by counting the threshold crossings of the previously computed signal, rejecting cross- ings that were too close in time, showed an average error of 8.41% which is only slightly higher than the error of cur- rently available high-quality pedometers.
For the gesture recognition the signal was segmented by comparing the mean finite difference of non-overlapping 1- second windows to a dynamic threshold, if the absolute value of the mean exceeded the threshold the window was consid- ered to be part of a gesture. A signal was computed as in the
activity recognition and used to build a feature set consisting of
• Wave form
• Mean and median value
• Standard Deviation and Variance
• RMS
• Zero Crossing Rate and Mean Crossing Rate
• DC and AC voltage waveform of the raw input signal
• Signal spectrum from 0 to 10 Hz of the raw input signal (1 Hz resolution)
The feature set was used to classify the gesture using Weka SVM as for the activity recognition. In the experiment, 5 dif- ferent gestures were used as shown in Figure 3. The achieved average accuracy for the gesture recognition was 92.11%.
A slightly adapted system can also be used for location clas- sification. Since the distortion of the electric fields by the body cannot be used for this classification, the ambient elec- tric fields have to be measured and therefore the sampling rate has to be increased to capture a bigger frequency range.
However, with 400 S/s to capture a frequency range from 0 to 200 Hz, the sampling rate was still significantly smaller than in the on-body sensing experiments by Cohn [1, 2]. In the ex- periment a mobile sensor was worn in a pocket at the body, which was strongly coupled to the body due to the short dis- tance. This way, the body was used as an antenna similar to the on-body sensing approach, but without any direct body contact. 5 indoor locations in an office building and 1 out- door location were used in the experiment, a work desk, a meeting room, a kitchen, a hallway, a hardware lab and a soccer field. The location classification achieved an average accuracy of 98.12%.
The sensor can sense body movement in a range of approx- imately 2 m. Although this range is relative limited, it can- not be guaranteed that the the user is the only moving per- son in this range. Experiments with a 2-channel sensor and two participants performing different activities showed that the signals can be separated with a Independent Component Analysis. However, this analysis only separates the signals of different activities, not necessarily of different users.
APPLICATIONS
Electric field sensing has various possible applications in both static and mobile uses. As a small insight, some of them will be presented here.
Like vision based systems such as Kinect [13] and the Leap Motion Controller [6], it could be used to control devices with gestures, but without many disadvantages of cameras.
Especially the significantly lower power consumption would also enable gesture control for mobile devices which is not really possible with vision based systems.
As shown by all three projects, electric field sensing could provide an accurate indoor localization, e.g. in large public buildings. This is especially helpful since GPS based systems hardly work in many indoor environments.
As shown by Cohn [1], electric field sensing can provide a simple way to control indoor environments, for example the room temperature or audio systems, by wall touches without
the need to instrument the environment. This could signifi- cantly increase convenience without much effort or cost.
Already today electric field sensing is used for intruder de- tection, mainly in outdoor environments in combination with fences. However, passive electric field sensing could provide an invisible and very low power intruder detection systems for homes that leverages the electric fields of the power lines.
CONCLUSION
This work presented a current overview over the field of elec- tric field sensing for Human-Computer interaction, including giving reasons why development in this field is desirable or even necessary. The focus was set to passive field sensing for HCI since this is the field with the latest development.
It showed that electric field sensing can provide an easy and natural way of control while being very cheap and energy ef- ficient. It is, however, very sensible to changes in the electric environment such as switching lights on or of. Considering the still very early stage of research in the field of passive electric field sensing for HCI, the accomplished results are very promising and motivating for future research.
REFERENCES
1. Gabe Cohn, Daniel Morris, Shwetak N. Patel, and Desney S. Tan. 2011.Your noise is my command: sens- ing gestures using the body as an antenna.
2. Gabe Cohn, Daniel Morris, Shwetak Patel, and Desney Tan. 2012.Humantenna: using the body as an antenna for real-time whole-body interaction.
3. Paul Dietz and Darren Leigh. 2001.DiamondTouch: a multi-user touch technology.
4. Christoph Endres, Tim Schwartz, and Christian A. Mller.
2011.”Geremin”: 2D microgestures for drivers based on electric field sensing.
5. Mark Hall, Eibe Frank, Geoffrey Holmes, Bernhard Pfahringer, Peter Reutemann, and Ian H. Witten. 2009.
The WEKA data mining software: an update.
6. https://www.leapmotion.com/
7. https://www.microchip.com/pagehandler/en- us/technology/gestic/home.html
8. Adiyan Mujibiya and Jun Rekimoto. 2013.Mirage: ex- ploring interaction modalities using off-body static elec- tric field sensing.
9. S. K. Shevade, S. S. Keerthi, C. Bhattacharyya, and K.
R.K. Murthy. 2000.Improvements to the SMO algorithm for SVM regression.
10. J. R. Smith. 1996.Field mice: extracting hand geometry from electric field measurements.
11. Joshua Smith, Tom White, Christopher Dodge, Joseph Paradiso, Neil Gershenfeld, and David Allport. 1998.
Electric Field Sensing For Graphical Interfaces.
12. Joshua Reynolds Smith. 1999.Electric Field Imaging.
13. http://www.xbox.com/en-US/kinect
14. Thomas G. Zimmerman, Joshua R. Smith, Joseph A.
Paradiso, David Allport, and Neil Gershenfeld. 1995.
Applying electric field sensing to human-computer inter- faces.
![Figure 2: Mirror images of stick figures performing the 12 gestures (image from [2])](https://thumb-eu.123doks.com/thumbv2/1library_info/4309492.1570618/4.918.481.834.94.486/figure-mirror-images-stick-figures-performing-gestures-image.webp)
![Figure 3: Stick figures performing the gestures used in the gesture recognition experiment (image from [8])](https://thumb-eu.123doks.com/thumbv2/1library_info/4309492.1570618/6.918.89.437.98.195/figure-stick-figures-performing-gestures-gesture-recognition-experiment.webp)
