IHS Economics Series Working Paper 312
April 2015
Insolvency After the 2005 Bankruptcy Reform
Stefania Albanesi
Jaromir Nosal
Impressum Author(s):
Stefania Albanesi, Jaromir Nosal Title:
Insolvency After the 2005 Bankruptcy Reform ISSN: Unspecified
2015 Institut für Höhere Studien - Institute for Advanced Studies (IHS) Josefstädter Straße 39, A-1080 Wien
E-Mail: o ce@ihs.ac.atffi Web: ww w .ihs.ac. a t
All IHS Working Papers are available online: http://irihs. ihs. ac.at/view/ihs_series/
This paper is available for download without charge at:
https://irihs.ihs.ac.at/id/eprint/3236/
Insolvency After the 2005 Bankruptcy Reform
Stefania Albanesi
1and Jaromir Nosal
21FRBNY and CEPR
2Columbia University
April 2015
All IHS Working Papers in Economics are available online:
https://www.ihs.ac.at/library/publications/ihs-series/
Economics Series
Working Paper No. 312
Insolvency After the 2005 Bankruptcy Reform ∗
Stefania Albanesi FRBNY and CEPR
Jaromir Nosal Columbia University April 13, 2015
Abstract
Using a comprehensive panel data set on U.S. households, we study the effects of the 2005 Bankruptcy Abuse Prevention and Consumer Protection Act (BAPCPA), the most substantive reform of personal bankruptcy in the United States since the Bankruptcy Reform Act of 1978. The 2005 legislation introduced a means test based on income to establish eligibility for Chapter 7 bankruptcy and increased the adminis- trative requirements to file, leading to a rise in the opportunity cost and, especially, the financial cost of filing for bankruptcy. We study the effects of the reform on bankruptcy, insolvency, and foreclosure. We find that the reform caused a permanent drop in the Chapter 7 bankruptcy rate relative to pre-reform levels, due to the rise in filing costs associated with the reform, which can be interpreted as resulting from liquidity con- straints. We find that the decline in bankruptcy filings resulted in a rise in the rate and persistence of insolvency as well as an increase in the rate of foreclosure. We find no evidence of a link between the decline in bankruptcy and a rise in the number of individuals who are current on their debt. We document that these effects are con- centrated at the bottom of the income distribution, suggesting that the income means tests introduced by BAPCPA did not serve as an effective screening device. We show that insolvency is associated with worse financial outcomes than bankruptcy, as insol- vent individuals have less access to new lines of credit and display lower credit scores than individuals who file for bankruptcy. Since bankruptcy filings declined much more for low-income individuals, our findings suggest that, for this group, BAPCPA may have removed an important form of relief from financial distress.
∗For useful comments, we wish to thank Christopher Conlon, Luigi Guiso, David Lucca, Neale Mahoney, Don Morgan, Claudia Olivetti, Christoph Rothe, Joe Tracy, Jonathan Vogel and seminar participants at Columbia University, FRBNY, SED Annual Meetings, National Bank of Poland, NBER Summer Institute, NBER Household Finance: Research Findings and Implications for Policy conference, 13th Workshop on Macroeconomic Dynamics, and University of Waterloo. We are also grateful to Zach Bleemer and Matt Ploenzke for excellent research assistance. The views expressed here are those of the authors and do not necessarily reflect the views of the Federal Reserve Bank of New York or the Federal Reserve System. Contact information: Albanesi: stefania.albanesi@gmail.com; Nosal: jnosal@columbia.edu.
1 Introduction
This paper studies the impact of the 2005 Bankruptcy Abuse Prevention and Consumer Protection Act on bankruptcy, insolvency and foreclosure behavior of U.S. households. The Act is the single most important piece of legislation regarding personal bankruptcy since the Bankruptcy Reform Act of 1978. The main provision of the law were to introduce an income means tests to determine eligibility for Chapter 7 bankruptcy.
1The new law also increased the cost of filing in a variety of ways. It raised the amount of paperwork required and mandated that filers attend compulsory credit counseling classes at their own expense.
It also introduced a new provision that attorneys can now be held personally liable for inaccuracies in the filing.
One of the major consequences of the law’s new requirements was a sizable rise in attorney fees for bankruptcy cases. Median attorney fees increased by 38% for Chapter 7 filers, from an average of $663 dollars pre-reform to $986 post-reform.
2Given the extreme low incomes of filers pre-reform and the fact that bankrupt households are often cash poor,
3cost changes of this magnitude can significantly affect potential filers’ options. Thus, the reform can serve as a natural laboratory in order to assess the impact costs on bankruptcy and delinquent behavior. As such, it can provide valuable insights into a long-standing debate on the balance between the social insurance provided by the bankruptcy code versus the moral hazard necessarily associated with any such insurance.
Our analysis is based on anonymous administrative credit file data from a nationally representative panel of U.S. individuals from 1999 to 2013. These data allow us to observe the drop in bankruptcies and the changing characteristics of bankrupts, as well as the behavior of financially distressed individuals who post-2005 decide not to file for bankruptcy. A large literature following BAPCPA’s introduction studies its effects on the bankruptcy filing rate and on the characteristics of those who file for bankruptcy, based mainly on surveys of filers or bankruptcy courts records.
4Our analysis is the first to shed light on the outcomes of the individuals who no longer file for bankruptcy post-reform. Specifically, we derive three sets of results.
1Individuals who fail to pass the income means test can still file for Chapter 7 if their debt to income ratio is high enough.
2See Jones (2008), Lupica (2012), White (2007).
3Documented for example in Mann and Porter (2009) and Gross, Notowidigdo, and Wang (2012).
4In a leading study, Lawless et al. (2008) use the 2007 Consumer Bankruptcy Project to document the changes in the characteristics of bankrupts when compared with data from similar studies in 1981, 1991 and 2001. They find that the the Act did not change the income composition of bankrupts but increased their in-bankruptcy debt and the length of time before filing. One limitation of these studies is that they focus solely on a small sample of bankrupt individuals from a selected number of states.
First, we show, controlling for a comprehensive set of court district level economic and regulatory variables, that BAPCPA is associated with a large drop in Chapter 7 bankruptcy filings, a much smaller drop in Chapter 13 filings, a rise in foreclosures, and a rise in the fraction of individuals who are insolvent–have severe credit delinquencies but do not file for bankruptcy. Using a novel income imputation procedure, we show that the strength of these responses is larger for individuals with income below the national median. This finding suggests that the means test on income did not play a major role in driving the responses to the reform, particularly the decline in the bankruptcy rate, while it is consistent with the rise in the monetary costs of filing playing an important role.
Second, we exploit the geographical variation in attorney filing fees across U.S. districts pre- and post-reform to quantify the role of the monetary filing cost on bankruptcy behavior.
We find that higher filing fees are strongly negatively related to Chapter 7 bankruptcies, but not to Chapter 13 bankruptcies. A major difference between these two chapters is that fees for Chapter 7 have to be paid up-front, while fees for Chapter 13 can be paid in installments during the bankruptcy discharge period. Since the fees for both chapters increased by similar magnitudes post-reform, this suggests that the up-front nature of the filing cost for Chapter 7 bankruptcy plays a crucial role in discouraging potential filers, supporting the interpretation that these individuals are liquidity constrained.
5We also show that the response to the filing cost change associated with the reform is stronger for individuals below the median national income, confirming the hypothesis that the rise in filing costs, not the means test for income, was the main mechanism through which BAPCPA affected bankruptcy behavior.
Finally, we document the substitution patterns from Chapter 7 bankruptcy to foreclosure, insolvency and being current on all payments using district level variation. We find a strong substitution from bankruptcy to foreclosure and insolvency, but no impact on the frequency of individuals who are current on all debt.
Our analysis concentrates on studying the behavior of individuals who enter a new spell of financial distress, which we identify with a
new delinquencyor a
new insolvencyafter 8 quarters with a clean record. A delinquency occurs if a payment is 30, 60 or 90 days late on any account, while an insolvency occurs if a payment is 120 days or more late or charged off on any account. Exploiting the panel dimension of our data, we estimate the probability of transitioning from a new spell of financial distress to Chapter 7 and Chapter 13 bankruptcy, insolvency and foreclosure. To do so, we calculate frequency distributions, leading to estimates of the transition probabilities across these states, which we aggregate
5It would be difficult for filers to borrow to finance Chapter 7 filing costs, since debts is contracted close enough to filing date can be considered fraudulent due to lack of intent to repay.
at the court district level.
Our first set of findings regard the time variation in these transition probabilities in the aggregate, controlling for district-level economic and regulatory factors.
6This exercise captures the timing and direction of the responses to the reform, and it guides the rest of our analysis. We find that, upon implementation of the Act, the transition into Chapter 7 bankruptcy drops by 60 log points from a new delinquency and by 80 log points from a new insolvency. Concurrently, the transition from a new delinquency to insolvency without foreclosure rises by 20 log points and the transition to foreclosure (without bankruptcy) rises by 75 log points after the reform, while the transition to current declines by 10 log points.
Similarly, the transition from a new insolvency to foreclosure rises by 40 log points after the reform. We also find a very modest drop of the transition from a new delinquency or insolvency to Chapter 13 bankruptcy. This implies that as a consequence of the reform, Chapter 13 filings grow as a fraction of all filings, mostly as a result of the large drop in Chapter 7 filings. All the documented responses are stronger for low income individuals, which suggests a role of the rise in the monetary cost of filing for bankruptcy.
These findings suggest that individuals who would have filed for bankruptcy pre-2005 are now pushed into insolvency and foreclosure and find it more difficult to pay off their debts and return to being current. We interpret the rise of the transition into foreclosure from a new delinquency and a new insolvency as resulting from financially distressed individuals resorting to default on secured debt, having lost the option to default on their unsecured debt.
7BAPCPA increased the cost of filing for bankruptcy in a variety of ways. In particular, the rise in paperwork and the introduction of personal liability for attorneys in case of inaccuracies led to a sizable increase in attorney fees. The next step in our analysis focusses on the role of the rise in these fees, which account for about 75% of the total cost of filing for bankrutpy (see Lupica (2012)). Crucially, even though the Act is a federal law, both the initial level of the fees and the change associated with the reform exhibit sizable cross-district variation. We exploit this geographic variation to examine the mechanism through which BAPCPA led to a decline in bankruptcy filings.
We adopt a difference-in-difference approach to quantify the effect of the cost on bankruptcy, insolvency and foreclosure. Specifically, we first examine the quantitative re-
6We include a number of economic covariates, such as unemployment, personal disposable income, house prices and their four quarter change. The state level regulatory controls include information on homestead exemption, wage garnishment and foreclosure regulation.
7Given the homestead exemption, most bankrupt households can retain their main residence and continue to service real estate debt associated with that property.
sponse of bankruptcy rates to the reform through the change in the filing fees at the district level. We then estimate the degree of substitution from bankruptcy to insolvency and fore- closure.
We find a statistically and economically significant impact of attorney fees on transitions into Chapter 7 bankruptcy. Our estimates imply that moving from the 25th to the 75th percentile of the cost distribution increases the drop in Chapter 7 bankruptcy by 18 log points. When we estimate the elasticity of the flow into bankruptcy separately pre- and post-reform, we find that the relationship is stable–implying that the overall increase in the costs post-reform will drive bigger variation in bankruptcy outcomes. We show that cost changes are not driven by differences in endogenous bankruptcy outcomes, economic variables or regulatory variables, leading us to conclude that the variation in these costs is plausibly exogenous. As a robustness, we also provide instrumental variable analysis. Specifically, we instrument the cost change with the political preferences of the judges, or alternatively, we instrument the post-reform costs with their value pre-reform. Both strategies confirm our baseline results.
We repeat our analysis distinguishing among individuals above and below the median national income, and we find that all the effects are much stronger for individuals with income below the median. This suggests that the high cost of filing for bankruptcy post- reform mostly drove the response. These findings also suggest that the income means test for Chapter 7 introduced by the reform was not the main screening mechanism inducing the reduction in Chapter 7 bankruptcy filings. This interpretation is also confirmed by the behavior of Chapter 13 bankruptcy, for which we find no relation between the change in Chapter 13 attorney fees and the response of the filing rate to the reform. An important difference between Chapter 7 and 13 bankruptcy is that Chapter 7 filing costs need to be paid upfront, while they can be part of the court mandated repayment plan for Chapter 13 bankruptcy. Given this difference, the lack of relation between the response of Chapter 13 filings and the change in associated attorney fees post-reform is consistent with the hypothesis that liquidity constraints drive the response of Chapter 7 filings to the reform.
The last step in our analysis is to quantify the substitution from bankruptcy to other
outcomes post-reform. Specifically, controlling for economic and regulatory factors, we es-
timate the district-level mean response of transition probabilities from new insolvencies to
foreclosure, insolvency, bankruptcy and current at 4 and 8 quarter horizons. For these out-
comes, we find that a larger drop in the transition into bankruptcy is associated with a
statistically and economically sizable increase in the persistence of insolvency and a larger
transition probability into foreclosure. At the 4 quarter horizon, the median estimated drop
of the transition into bankruptcy (66%) increases the persistence of the insolvency state by 3.3% and the transition into foreclosure by 34%. Interestingly, we do not find a relation between the drop in the flows into bankruptcy and the flows into current. There is also no evidence of a deterrence effect of the law, as the persistence of staying current is not related to the drop in flows to bankruptcy.
Our findings indicate that the decline in Chapter 7 bankruptcy associated with the reform is associated with a rise in insolvency, with and without foreclosure. It is therefore important to determine whether this response is consequential for households. To examine this question, we consider cohorts of newly insolvent individuals, distinguishing those who go bankrupt in the 8 quarters after the new insolvency and those who don’t. We then examine the behavior of several financial indicators for a 2 year window around that new insolvency. Among individuals who become newly insolvent at the same date, we find that the individuals who will eventually go bankrupt initially have lower credit scores, suggesting that they are negatively selected. However, they experience a sharp boost in their credit score after bankruptcy, whereas credit scores recover at a much slower pace for individuals who remain insolvent. One quarter after bankruptcy, the credit score of bankrupt individuals exceeds the credit score of insolvent individuals 1 quarters after insolvency by 40-80 points. In addition, those who go bankrupt open new unsecured accounts post-bankruptcy at a higher rate (by around 15 percentage points) than those who don’t go bankrupt, while the number of inquiries is very similar across the two groups. This indicates a difference in access to credit, not demand for credit. We conclude from this evidence that the ability to file for Chapter 7 bankruptcy is associated with better access to credit, and while both insolvency and bankruptcy are forms of default, the debt discharge associated with bankruptcy leaves filers in a better financial position than individuals who become insolvent in similar circumstances.
Our analysis has wide-ranging implications for the design of policies regulating consumer
credit and bankruptcy. First, we show that a sizable group of individuals exists that does not
file for bankruptcy, but seems unable to pay off their debts. These individuals are concen-
trated at the bottom of the income distribution, and therefore they are the ones who would
be expected to benefit most from the relief offered by personal bankruptcy. Our analysis
suggests that any policies affecting the financial cost of filing for bankruptcy will impact
disproportionately these individuals. Second, we show that there is a strong substitution
between Chapter 7 bankruptcy and foreclosure, and hence regulating either one of these
institutions is likely to impact the other in significant ways. Finally, we provide a systematic
analysis of the consequences of failure to file for bankruptcy for insolvent individuals, which
include lower access to credit and lower credit scores.
One of the main goals of personal bankruptcy is to provide an incentive compatible insur- ance scheme against streams of negative income shocks that make repayment of debts con- tracted in better times too onerous or impossible for the debtor. Our finding that bankruptcy filings have declined mostly for low income, possibly liquidity constrained individuals, result- ing in a substantial rise in the rate and persistence of insolvency suggests that the Act may have removed this form of insurance for these households. It also suggests that the income means test that was introduced to ameliorate possible moral hazard associated with Chapter 7 bankruptcy was not effective. Further, the fact that the decline in bankruptcy filings was associated with a rise in the foreclosure rate implies that formal default on unsecured debt has been replaced to a substantial degree by default on secured debt, possibly exacerbating the housing crisis.
The rest of the paper is organized as follows. Section 2 provides a short overview of the bankruptcy law in the U.S., including the changes implied by the 2005 reform. Section 3 reports our estimates of transition probabilities into various delinquency states. Section 4 describes our cross-district regression analysis. Section 6 examines the consequences of the substitution into insolvency from bankruptcy and concludes. The Appendix presents additional details of our results.
2 The 2005 Bankruptcy Reform
Households in financial distress in the U.S. can resolve their insolvency by filing for bankruptcy. Upon filing, debtors obtain immediate relief from all collection efforts, including direct communication, lawsuits and wage garnishment. Most unsecured debt is discharge- able, excluding taxes, alimony and child support obligations, student loans and debt obtained by fraud.
Chapter 7, usually called ‘straight bankruptcy’ or ‘fresh start’ option, is the most com- monly used bankruptcy procedure - up to 2005 a remarkably stable 70% of bankruptcies were Chapter 7 bankruptcies. Under Chapter 7, filers submit a list of all their assets to the courts. The part of the assets which exceeds certain exemption levels
8is then used to satisfy unsecured creditors. The rest of the debts are discharged, and debtors are not obliged to use future income for debt repayment (hence ‘fresh start’). Chapter 7 bankrupts are not allowed to re-file another Chapter 7 case for the next 6 years (increased to 8 by the 2005 Act), and
8Asset exemptions are determined at the state level. Exempt assets may include clothing, furniture, ‘tools of trade’, a vehicle up to some value. Additionally, most states have homestead exemptions, which protect equity in the house up to a state-level specified limit.
have a bankruptcy flag on their credit report for 10 years after filing.
Under Chapter 13, bankrupts keep all of their assets, but must use their future income to repay part of their unsecured debt
9. Debtors propose their own repayment plans (pre-2005, post-2005 they must use all of their law-defined disposable income to pay off debts) lasting 3-5 years, with the restriction that the total proposed repayment cannot be lower than the value of their non-exempt assets under Chapter 7. A Chapter 13 bankruptcy is considered discharged after the debt repayment plan has been executed, and the Ch.13 bankruptcy flag stays on the credit record for 7 years after discharge.
Historically, ever since the introduction of the bankruptcy law as we know it, both un- secured debt levels and bankruptcy rates have been rapidly rising over time (the trend extending all the way back to 1978), which gave rise to numerous studies on the sources of the rise
10, as well as active policy discussion on the efficiency of existing law. That discussion resulted in the 2005 bankruptcy reform.
The BAPCPA was signed by president George W. Bush on April 20, 2005 and applied to bankruptcy cases filed on or after October 17, 2005. It introduced several major changes to bankruptcy regulation which increased the burden, financial and otherwise, of filing for bankruptcy protection. Among the most notable new features are the introduction of an income ‘means test’ and sufficient indebtedness tests to determine eligibility for filing for Chapter 7 bankruptcy. Specifically, to be eligible to file for Chapter 7, individuals who fail the means test must have (i) their monthly income net of allowable expenses calculated according to IRS rules be less than $166.67 per month and (ii) their net monthly income multiplied by 60 be less than 25 percent of their unsecured debt. In addition, Ch. 13 filers lost the ability to propose their own repayment plans. Overall, there was also a significant increase in the filing documentation burden for both chapters. Filers must file detailed financial information with the bankruptcy court, essentially showing proof of sufficient indebtedness and inability to pay, as well as good faith attempts at paying back. Bankruptcy lawyers must certify the accuracy of the information, and are subject to strict fines in case inaccuracies are detected.
In addition, the Act requires debtors to enroll in a credit counseling class before they file and a financial management course before their debts are discharged.
9More debts are dischargeable under Chapter 13 than Chapter 7, including some car loans and debts incurred by fraud or cash advances shortly before filing (the so called ‘super discharge’).
10Including Athreya (2002), Domowitz and Eovaldi (1993), Domowitz and Sartain (1999), Gross and Souleles (2002), Fay, Hurst, and White (2002), Livshits, MacGee, and Tertilt (2007), Livshits, MacGee, and Tertilt (2010).
The cost change
The sum of these provisions resulted in a significant rise in the cost of filing for bankruptcy. The total out-of-pocket cost of filing for bankruptcy increased from
$600 and $1600 for Chapters 7 and 13 to $2500 and $3500, respectively (White (2007), also consistent with findings in Lupica (2012)). In our study, we will focus on attorney fees and their increase associated with the reform. Attorney fees comprise 75% of the total financial cost of filing for bankruptcy (Lupica (2012)), and rose on average 35% after the reform.
3 Transitions
We use the Federal Reserve Bank of New York’s Consumer Credit Panel/Equifax Data (CCP), which is an anonymous longitudinal panel of individuals with quarterly frequency, starting in 1999:Q1 and ending in 2013:Q3. The panel comprises a 5% random sample of all individuals who have a credit report with Equifax. The data is described in detail in Lee and van der Klaauw (2010). In our analysis, we use a 1% sample, including information on approximately 2.5 million individuals in each quarter.
The data contains over 600 variables,
11allowing us to track all aspects of individuals’
financial liabilities, including bankruptcy and foreclosure, mortgage status, detailed delin- quencies, various types of debt, with number of accounts and balances. Apart from the financial information, the data contains individual descriptors such as age, ZIP code and credit score. The variables included in our analysis are described in detail in Appendix A.
3.1 The Effects of BAPCA over Time
To understand the path into bankruptcy and financial distress, we estimate the probability of transitioning between a set of mutually exclusive financial states, for different horizons. This approach uses to the full extent the panel nature of the data and allows us to identify the timing and magnitude of the response to the reform. In any given quarter, an individual’s state is Current, if there are no delinquencies of any type in her record for that quarter, and no bankruptcy or foreclosure flags. An individual’s state is Delinquent, if she has accounts that are 30, 60 or 90 days delinquent. An individual’s state is Insolvent if she has any debt that is 120 days plus delinquent or in charge-off.
12An individual is Bankrupt, if she displays a bankruptcy flag, or in Foreclosure if she displays a foreclosure flag. The bankruptcy flag is activated by a new bankruptcy filing, where we distinguish between Ch. 7 and Ch. 13.
11For data dictionary, go tohttp://www.newyorkfed.org/householdcredit/2013-q3/data/pdf/data_
dictionary_HHDC.pdf.
12Student debt is not dischargeable in bankruptcy, and is excluded from the analysis.
The bankruptcy flag for Ch. 7 stays on the record for 10 years. The one for Ch. 13 stays on the record for 7 years after the payment plan has been completed.The foreclosure flag is activated by a new foreclosure record on the individual’s account, and lasts for 7 years from its first appearance.
We estimate the 4-quarter-ahead transition probabilities across these states for each quar- ter in the sample, starting from a
new delinquencyand a
new insolvency. A new delinquencyis defined as a state in which in an individual is delinquent, after 8 quarters without delin- quencies, insolvencies, bankruptcy or foreclosure. We focus on the transitions from a new delinquency to identify the possible start of a spell of financial distress. Approximately, 0.8% of the population becomes newly delinquent in each quarter in our sample. We also consider transitions from a new insolvency, defined as a state in which an individual becomes insolvent after 8 quarters of no insolvencies, with no bankruptcy or foreclosures. A new in- solvency captures the start of a spell of more severe financial distress. Approximately 0.6%
of the overall population becomes newly insolvent in each quarter of our sample, and this percentage is stable over time.
To eliminate the effects of business cycles and other economic factors possibly driving the transitions from a new delinquency or insolvency to bankruptcy and other outcomes of interest, we estimate the following regression:
yit
=
Xs(t)6=0
βs(t)Is(t)
+
γi+
φXit+
t,(1)
where
yitis the log transition in district
iat quarter
t, βs(t)capture time effects, relative to base period 0,
Is(t)is an indicator for period
s(year or quarter),
γidenote district effects, and
Xitdenotes a set of economic controls, in logs.
13The estimated
βs(t)capture the timing and magnitude of the response to the reform. They are also able to detect the presence of any pre-existing trends in the transitions of interest.
We report the estimates of the time effects for the yearly specification below, starting from the transitions from a new delinquency.
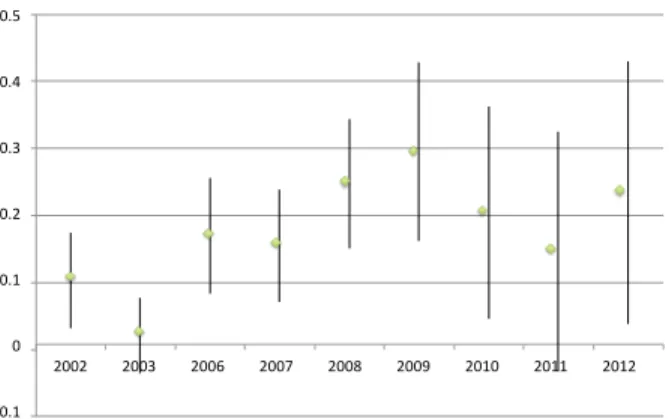
14Figure 1 reports the estimate for the time effects for the transitions from a new delinquency.
The top left panel displays the estimates for the transitions into Ch. 7 bankruptcy, which show a sizable and permanent drop in the transitions. The drop is approximately equal to
13These include district level personal income, unemployment rate and home price index, as well as the 4 quarter change in these variables.
14The estimates of the coefficients for the controls and for the quarterly specification do not change the conclusions of this section, and are available from the authors upon request.
-‐1.4 -‐1.2 -‐1 -‐0.8 -‐0.6 -‐0.4 -‐0.2 0
2002 2003 2006 2007 2008 2009 2010 2011 2012
(a) Ch 7 bankruptcy
-‐0.1 0 0.1 0.2 0.3 0.4 0.5
2002 2003 2006 2007 2008 2009 2010 2011 2012
(b) New insolvency without foreclosure
-‐0.4 -‐0.2 0 0.2 0.4 0.6 0.8 1 1.2
2002 2003 2006 2007 2008 2009 2010 2011 2012
(c) Foreclosure
-‐0.2 -‐0.15 -‐0.1 -‐0.05 0 0.05 0.1 0.15
2002 2003 2006 2007 2008 2009 2010 2011 2012
(d) Current
Figure 1:
βs(t)for 4 quarter ahead transition probability from Newly Delinquent. Bars denote 95% confidence intervals. Source: Authors’ calculation based on Federal Reserve Bank of New York’s Consumer Credit Panel/Equifax Data.
60 log points between 2005 and 2006-2008, and rises to 100 log points in 2011 and 2012, after
abating somewhat during 2009 and 2010. Moreover, after controlling for economic controls
and district effect, there appears to be no trend in the transition into bankruptcy after a
new insolvency in the years prior to the reform. All the
βs(t)coefficients are significant at
least at the 5% level. The top right panel displays the transition from a new delinquency
to insolvency, without foreclosure. In this case, there is a sharp and persistent rise in the
transition to insolvency post reform, averaging approximately 20 log points. The bottom left
panel displays the transition from a new delinquency to foreclosure (without bankruptcy),
which rises by 80-100 log points post reform. Finally, the bottom right panel displays the
transition probability from a new delinquency to Current. The probability declines by 5-15
log points post reform, suggesting that the decline in bankruptcy is not matched by a greater
ability of newly delinquent individuals to repay their debt and return to being current.
A stable 80% of newly insolvent households show a delinquency 1 quarter prior a new insolvency, as shown in table 1. Since individuals who eventually become bankrupt mostly transition to insolvency first, we also examine the transition probabilities from a new insol- vency to Chapter 7 bankruptcy and foreclosure.
Table 1: Fraction of Newly Insolvents with Delinquency
6 qtrs before 4 qtrs before 2 qtrs before 1 qtr before At new insolvency
9.5% 13.7% 24.9% 80.0% 32.9%
1999-2012 averages. Source: Authors’ calculation based on Federal Reserve Bank of New York’s Consumer Credit Panel/Equifax Data.
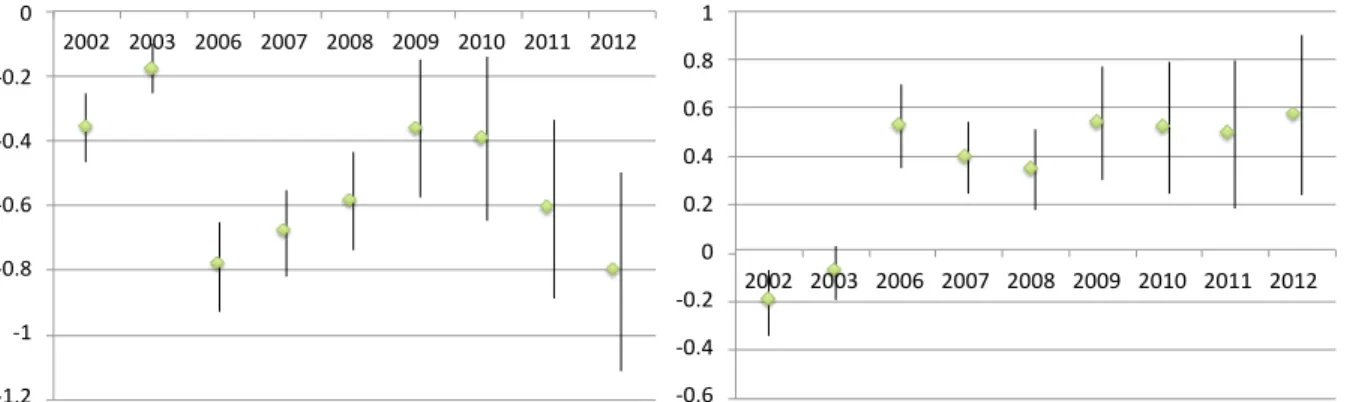
Figure 2 displays the estimates for the transition into Ch. 7 bankruptcy and foreclosure.
The transition into Ch. 7 bankruptcy (left panel) drops by 20 to 60 log points relative to the pre-reform average in this case, with the drop maximized in 2006-2008 and 2011-12.
The right panel displays the transitions into foreclosure, which rises by approximately 40 log points in the post reform period.
-‐1.2 -‐1 -‐0.8 -‐0.6 -‐0.4 -‐0.2 0
2002 2003 2006 2007 2008 2009 2010 2011 2012
-‐0.6 -‐0.4 -‐0.2 0 0.2 0.4 0.6 0.8 1
2002 2003 2006 2007 2008 2009 2010 2011 2012
Figure 2:
βs(t)for 4 quarter ahead transition probability from Newly Insolvent to Ch. 7 bankruptcy (left panel) and foreclosure (right panel). Bars denote 95% confidence intervals.
Source: Authors’ calculation based on Federal Reserve Bank of New York’s Consumer Credit Panel/Equifax Data.
The link between bankruptcy filing, real estate debt and foreclosure has been extensively discussed in the literature.
15This link can arise via several mechanisms. First, a bankruptcy
15Indeed, Fay, Hurst, and White (2002) argue that the financial benefit of filing for bankruptcy is intrin- sically linked to real estate net worth, via the homestead exemption and other factors. See also Li (2009), Carroll and Li (2011), Morgan and Strain (2007), White and Zhu (2008), and Morgan, Iverson, and Botsch (2012).
filing, both for Chapter 7 and Chapter 13, will stay a pending foreclosure procedure or the beginning of such procedure. In addition to this mechanical effect, individuals who file for bankruptcy may be able to renegotiate the terms of their mortgage loans, and thus repair a home debt delinquency, preventing foreclosure, or be able to cure an existing foreclosure.
Finally, especially for Chapter 7 filers who are below their state’s homestead exemption levels, the ability to discharge their unsecured debt may prevent any delinquencies on the home debt. On the other hand, the inability to file for bankruptcy may make foreclosure more appealing, as it enables individuals to discharge–at the cost of losing their home–their home debt, which may enable them to remain current on their unsecured and other debt.
16In Section 5.5, we give evidence of a more direct link between the decline of the transition into Chapter 7 bankruptcy and the rise in foreclosure at the district level, that strongly suggests that the decline in foreclosure post-BAPCPA is associated with the resulting decline in bankruptcy.
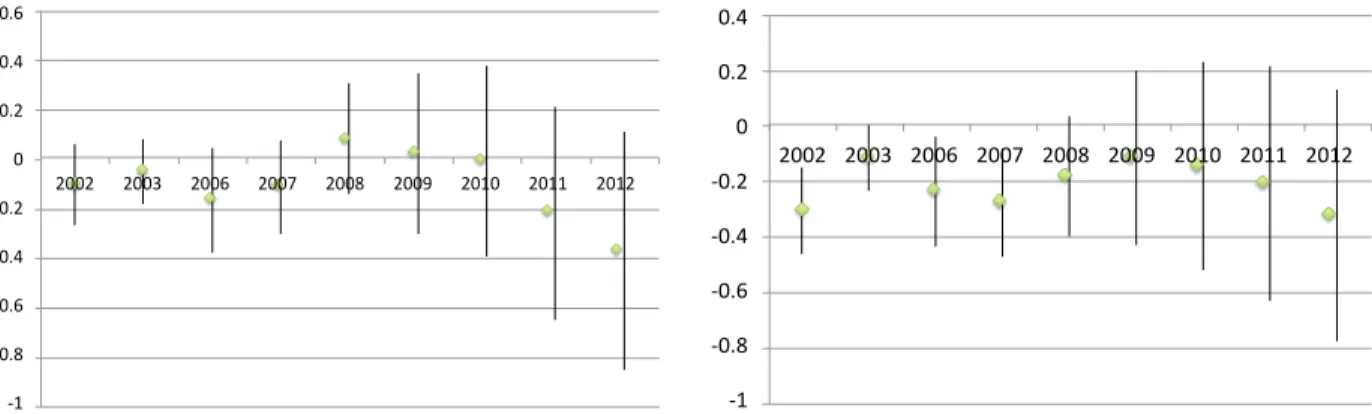
Finally, we consider transitions into Chapter 13 bankruptcy filings from both a new delinquency and a new insolvency. The results are displayed in figure 3. As can be seen from the figure, the transition to Chapter 13 bankruptcy declines from both a new delinquency (left panel) and a new insolvency (right panel), but the drop associated with the reform is much smaller than for Chapter 7 bankruptcy. From a new delinquency, there is an approximately 18 log point drop from 2004, while from a new insolvency, the drop from 2004 is approximately 25 log points in 2006-2007 and 35 log points 2012. In both cases, the transition into Chapter 13 bankruptcy rises by about 10 log points between 2008 and 2009.
The fact that transitions into Chapter 13 bankruptcy drops a lot less than the transition into Chapter 7 bankruptcy is consistent with the intent of BAPCPA, which imposed means- testing and other requirements on Chapter 7 bankruptcy but left Chapter 13 bankruptcy mostly unaltered. The drop in Chapter 13 filings may be due to the fact that attorney fees for this procedure also rose (see Lupica (2012)).
For the rest of the analysis, we will focus on Chapter 7 bankruptcy for two reasons. First, Chapter 7 bankruptcy is the form of bankruptcy that offers the most effective form of debt relief, when the bankruptcy is discharged, and comprises the largest fraction of bankruptcy procedures, both pre-and post reform. As shown in Norberg and Velkey (2007) and Eraslan et al. (2014), only 33% of all Chapter 13 bankruptcies are discharged, which corresponds to the fraction of filers that successfully complete the court mandated repayment plan.
16Our findings that transitions into foreclosure rise in response to the bankruptcy reform could be driven by any one of these mechanisms, and we plan to explore the empirical importance of these alternative forces in future work.
-‐1 -‐0.8 -‐0.6 -‐0.4 -‐0.2 0 0.2 0.4 0.6
2002 2003 2006 2007 2008 2009 2010 2011 2012
-‐1 -‐0.8 -‐0.6 -‐0.4 -‐0.2 0 0.2 0.4
2002 2003 2006 2007 2008 2009 2010 2011 2012
Figure 3:
βs(t)for 4 quarter ahead transition probability from Newly Delinquent (left panel) and Newly Insolvent (right panel) to Chapter 13 bankruptcy filings. Bars denote 95% confi- dence intervals. Source: Authors’ calculation based on Federal Reserve Bank of New York’s Consumer Credit Panel/Equifax Data.
Moreover, 30-33% of debtors who have excited bankruptcy through discharge or dismissal filed again at least once, and even for those who emerged successfully from their cases through discharge, the refiling rate exceeds 20 percent. These values are extremely high considering that since the mid-1990s the unconditional bankruptcy filing rate for households in general is less than 1.5 percent in the U.S. Jagtiani and Li (2014) also find that Chapter 13 filers are much less likely to receive new credit cards than Chapter 7 filers even after controlling for borrower characteristics and local economic environment, consistent with Chapter 13 bankruptcy providing less of a fresh start in credit markets than Chapter 7.
17Second, Chapter 13 fees, including attorney fees, can be included in the repayment plan, and need not be presented upfront. The fact that Chapter 13 filers can borrow to pay for the bankruptcy procedure implies that liquidity constraints should not play a role for the response to Chapter 13 bankruptcy to the reform. In Section 5.3, we show that there is no link between the change in Chapter 13 attorney fees and the decline in Chapter 13 filings across districts, which we take as evidence supporting our hypothesis that the reduction of bankruptcy filings following BAPCPA was due to liquidity constraints.
3.2 Transitions by Income
One plausible explanation for the pre- and post-reform behavior is that the large rise in filing cost associated with the reform made it too expensive for certain individuals to file.
17Jagtiani and Li (2014) find that Chapter 13 filers end up with a slightly larger credit limit amount than Chapter 7 filers overall, because they are able to maintain more of their old credit from before bankruptcy filing
Moreover, these individuals, if indeed liquidity constrained, would likely end up in insolvency, rather than paying off their debts and becoming current. This is consistent with Gross, Notowidigdo, and Wang (2012), who find that bankruptcy filings rise for individuals who receive tax rebates. The Equifax data does not provide individual income. However, for 2009, we have access to payroll data , linked to Equifax, from a large income verification firm. We use these data in conjunction to the Survey of Consumer Finances (SCF) to impute labor income to individuals in our Equifax sample. The details of our imputation method are discussed in Appendix B.
In summary, our method is based on using the SCF to estimate an individual’s income quartile, as a function of her debt holdings and age. Debt categories included are unsecured, auto, home, and student debt, where for each category, we index an individual’s decile in the holdings of a particular debt category. This approach is robust to changes over time in the relation between debt levels and income levels. We estimate this relation for every year in our sample in which the SCF is available. We use the coefficients for the last available SCF year to determine an individual’s income ranking by quarter until a new SCF survey becomes available. For 2009, we verify the accuracy of our imputation approach in the sample of individuals for which we have income data. We find that our imputation is highly successful at predicting whether individuals are in the first or fourth income quartile, and moderately successful at predicting whether individuals in the second and third quartile.
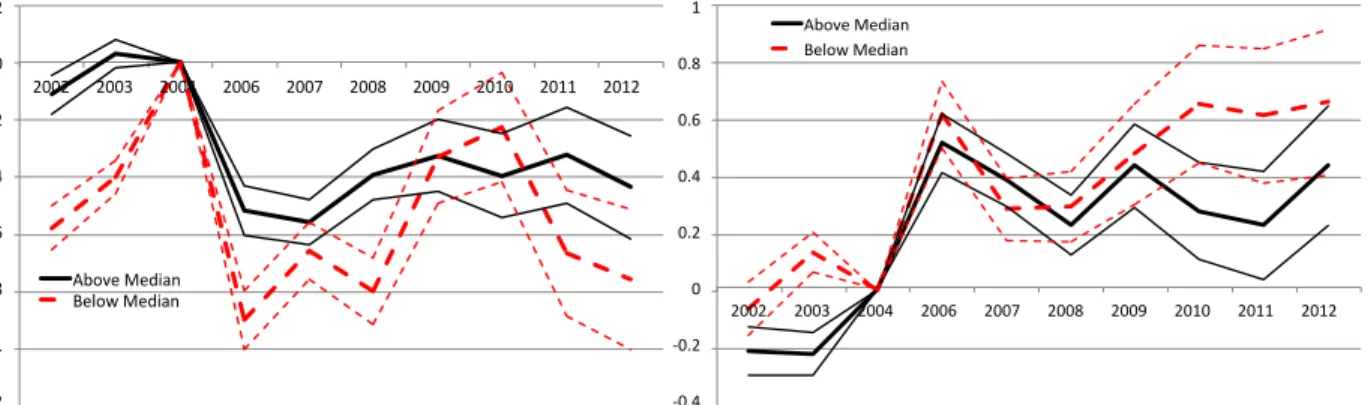
We estimate regression (1) for individuals below and above the median imputed income in each district and compare the estimates in figure 4. The estimates indicate that the effects of the reform are more pronounced for individuals below the median of the imputed income distribution. The left panel of figure 4 displays the estimates for the transition from new insolvency to bankruptcy. The drop in the transition into bankruptcy is deeper and more persistent for individuals below the median of the income distribution. The transition from a new insolvency to bankruptcy filing drops by 90 log points for individuals below the median of the income distribution between 2004 and 2006, while it only drops by 50 log points for individuals above the median. The transition into bankruptcy rises for individuals below the median income during the 2007-09 recession, but it is still 20 log points lower than in 2004.
It drops again for this group to -80 log points relative to 2004 by the end of our sample. For
individuals above the median of imputed income, the bankruptcy settles to approximately 40
log points lower than in 2004 by 2008. The difference between the transition from insolvency
to bankruptcy for individuals below and above the median of imputed income is significant at
least at the 10% level for most years, and significantly different at the 5% level in 2006-2009
and in 2011-2012.
The right panel displays the estimates for the transition from a new insolvency to fore- closure. Here, we see a sizable and persistent rise for individuals below the median of the inputed income distribution, as well as for those above the median between 2004 and 2009 of approximately 50 log points. After 2009, the transition into foreclosure continues to rise for individuals below the median of the imputed income distribution, ending 65 log points higher than in 2004 in 2012. For individuals above the median, the transition into foreclosure settles to approximately 35 log points higher than in 2004.
18Taken together, these results suggest that the effects of the reform were stronger for individuals at the bottom of the income distribution.
-‐1.2 -‐1 -‐0.8 -‐0.6 -‐0.4 -‐0.2 0 0.2
2002 2003 2004 2006 2007 2008 2009 2010 2011 2012
Above Median Below Median
-‐0.4 -‐0.2 0 0.2 0.4 0.6 0.8 1
2002 2003 2004 2006 2007 2008 2009 2010 2011 2012 Above Median
Below Median
Figure 4:
βs(t)for 4 quarter ahead transition probability from Newly Insolvent to Bankrupt (left panel) and from Newly Insolvent to Foreclosure (right panel) for individuals below and above the median of imputed income. Source: Authors’ calculation based on Federal Reserve Bank of New York’s Consumer Credit Panel/Equifax Data.
4 Variation by District
The introduction of the BAPCPA and the resulting increase in the filing requirements re- sulted in a significant increase in the filing costs for households (attorney fees, filing fee and debtor education expenses). Attorney fees, comprising approximately 75% of total direct ac- cess costs (both pre- and post-reform), are the biggest component of filing costs. Based on a comprehensive study of filing fees, Lupica (2012) reports an average increase in attorney fees of 37% for Chapter 7 filers. Behind these average increases, there is significant district-level variation: for example, for Chapter 7 filers, the cost changes vary from an increase of 122%
18The relatively small difference in the transition from insolvency to foreclosure between individuals below and above the median of the imputed income distribution may be due to the fact that homeownership is lower for individuals with low income. See Appendix B for details.
(Southern District of Georgia) to a drop of 28% (Southern District of Florida). In this sec- tion, we take attorney fees as a proxy for bankruptcy costs and exploit their variation across court districts in order to provide further evidence of the effects of the law on bankruptcy decisions, and specifically on the role of liquidity constraints in shaping the response to the reform.
We proxy the change in monetary costs associated with bankruptcy filing with the change in attorney fees for no asset cases, which account for around 90% of all bankruptcy filings.
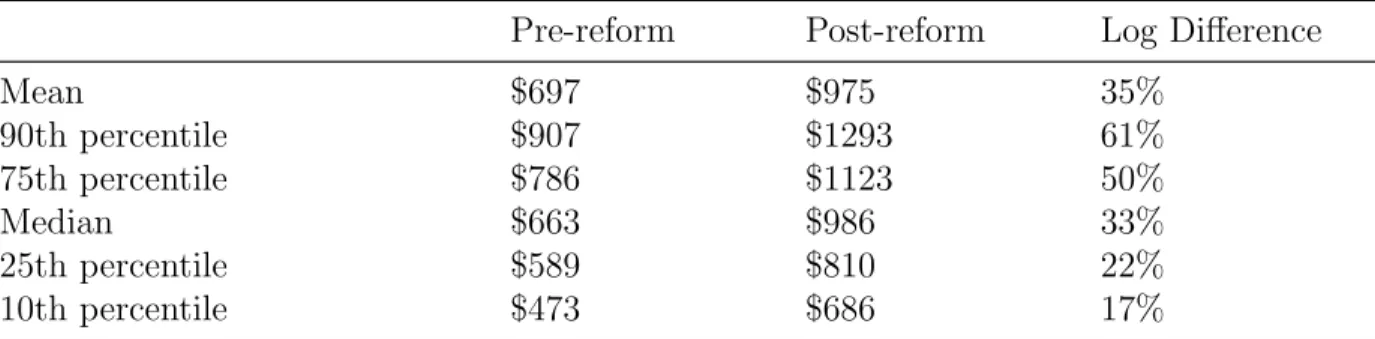
Table 2 presents descriptive statistics on the distribution of costs and cost changes. These costs exhibit a large cross-district variation both prior and after the bankruptcy reform. The prior range was $356 (Tennessee Middle) to $1920 (Florida Southern), while the post range is $543 (Illinois Central) to $1530 (Arizona). As argued in Lupica (2012), even controlling for state characteristics and filers’ characteristics, BAPCPA had a significant effect on attorney fees changes across districts. The district average attorney fee pre-reform was $700 and went up to $1000 post-reform.
Table 2: Attorney fees: Chapter 7.
Pre-reform Post-reform Log Difference
Mean $697 $975 35%
90th percentile $907 $1293 61%
75th percentile $786 $1123 50%
Median $663 $986 33%
25th percentile $589 $810 22%
10th percentile $473 $686 17%
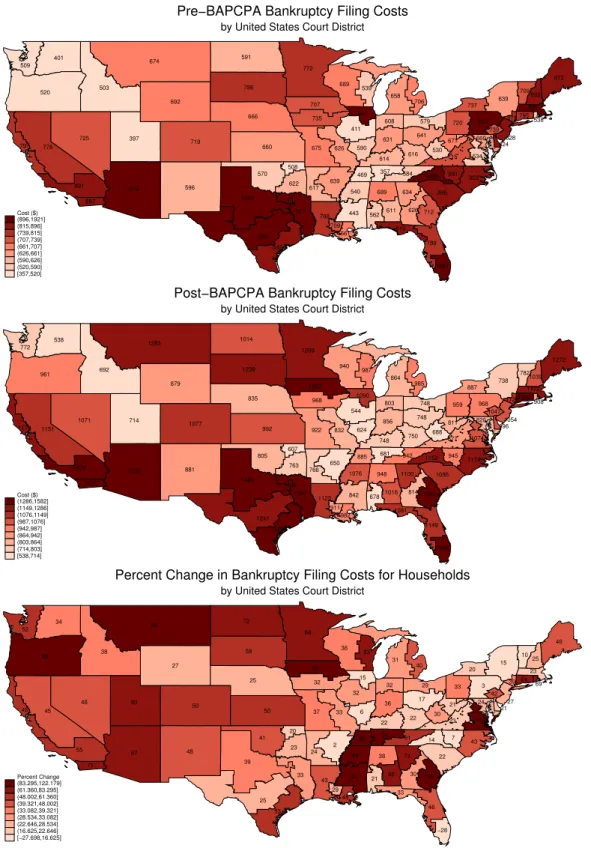
Figure 5 presents the pre- and post- reform levels of attorney fees for Ch. 7 bankruptcy by district, as well as the percentage change in these costs associated with the reform.
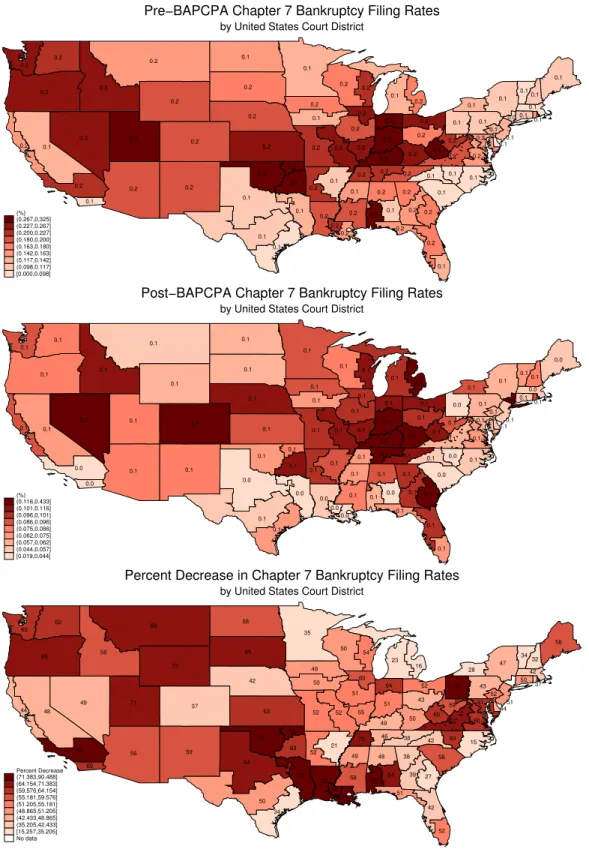
High Ch. 7 attorney fees are concentrated in the North and South East, the Gulf districts, and in California and New Mexico. Most of these districts also exhibit high attorney fees post-reform. The biggest percentage increases in attorney fees occur for some of the districts with the lowest pre-reform fees, however, the ranking of districts by Ch. 7 attorney fees is stable pre- and post-reform. The correlation between the pre- and post-reform ranking of these fees is 75%. Tables 3 and 4 present descriptive statistics for the bankruptcy rate by district, pre- and post-reform, for filings and discharged cases. Figure 6 provides a visualization.
Our analysis proceeds in two steps. We first repeat our transitions analysis, grouping
689
562 611 639
919 617 887 891 797 778
725 397
596 719 692
795
824
815 789
1921 634
626 712 707
735 503
947
590 411
608
631 660
614 616
661 709 788
957
660
872
658 706 772
626 675
540
443 674
1009 881 822 591
666
832
828 737
639
579 815
641
508 622 570 520
937 739
720 538
896 786
469 357 584
1019
977
842 992
715 534
509 401
689 539
530 671
709
Cost ($) (896,1921]
(815,896]
(739,815]
(707,739]
(661,707]
(626,661]
(590,626]
(520,590]
[357,520]
by United States Court District
Pre−BAPCPA Bankruptcy Filing Costs
948
6781016 650
1530 766 1515 1378 1179 1131
1071 714
881 1077 879
1305
996
1081 1149
1389 1100
814 1582 1307
968 692
1090
624 544
803
856 992
748 750
982 911 1123
1172
820
1272
864 985 1269
832 922
1076
842 1283
1152 945 1174 1014
835
1039
1054
887 738
748 1129
748
607
763 805 961
968 1047
959 908
1095 1239
885 681 942
1420
1301
1286 1241
877 1074 772
538
940 987
688 811
782
Cost ($) (1286,1582]
(1149,1286]
(1076,1149]
(987,1076]
(942,987]
(864,942]
(803,864]
(714,803]
[538,714]
by United States Court District
Post−BAPCPA Bankruptcy Filing Costs
38
21 66 2
67 24 71 55
48 45
48 80
48 50 27
64
21
33 46
−28 74
30 122 85
32 38
15
6 32
32
36 50
22 22
48 29 43
23
24
46
31 40 64
33 37
99
90 90
14 7
43 72
25
25
27 20
15
29 39
17
20
23 41 85
3 42
33 69
22 58
89 91 61
39
33
53 25
23 101
52 34
36 83
30 21
10
Percent Change (83.295,122.179]
(61.360,83.295]
(48.002,61.360]
(39.321,48.002]
(33.082,39.321]
(28.534,33.082]
(22.646,28.534]
(16.625,22.646]
[−27.698,16.625]
by United States Court District
Percent Change in Bankruptcy Filing Costs for Households
Figure 5: Attorney fees for Ch. 7 bankruptcy by district, pre- and post- reform, and per-
centage change associated with the reform.
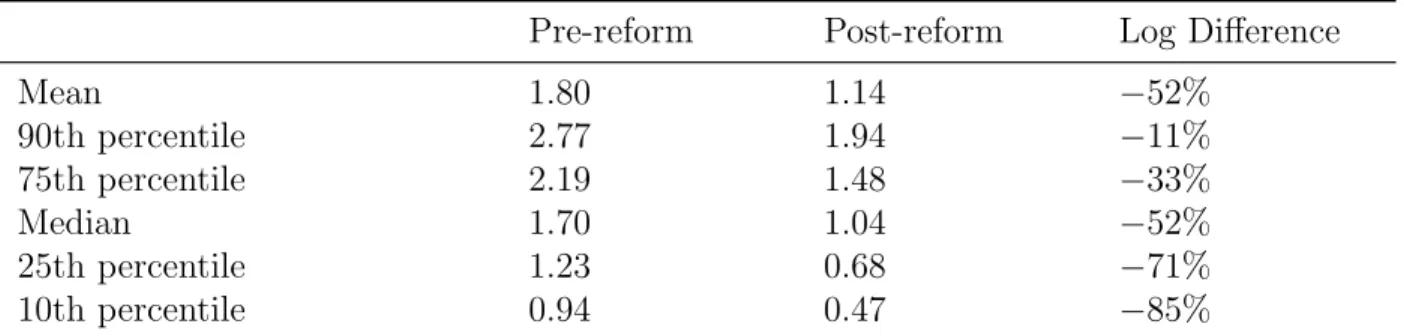
Table 3: Quarterly Chapter 7 bankruptcy rates: Filings.
Pre-reform Post-reform Log Difference
Mean 1.80 1.14
−52%90th percentile 2.77 1.94
−11%75th percentile 2.19 1.48
−33%Median 1.70 1.04
−52%25th percentile 1.23 0.68
−71%10th percentile 0.94 0.47
−85%Source: Authors’ calculation based on Federal Reserve Bank of New York’s Consumer Credit Panel/Equifax Data.
Table 4: Quarterly Chapter 7 bankruptcy rates: Discharged bankruptcy.
Pre-reform Post-reform Log Difference
Mean 1.74 1.16
−37%90th percentile 2.96 2.00 1%
75th percentile 2.17 1.51
−19%Median 1.53 1.03
−37%25th percentile 1.04 0.68
−54%10th percentile 0.68 0.46
−75%Source: Authors’ calculation based on Federal Reserve Bank of New York’s Consumer Credit Panel/Equifax Data.
districts by their cost change, and comparing estimated transitions across districts with high and low changes in attorney fees associated with the reform. The second step consists in running a difference-in-difference exercise to obtain a quantitative assessment of the effect of the reform on bankruptcy, insolvency and foreclosure, taking into account variation in other variables that potentially influence these outcomes, such as economic conditions at the district level, or regulatory characteristics at the state level.
4.1 Transitions by District
We use the attorney fees changes for Chapter 7 bankruptcy filings by court district, reported
in Lupica (2012), and then group districts into top-30% (‘high increase’) and bottom-30%
(‘low increase’) when ranked by filing cost percentage change.
19We then compute the transition matrices, as in Section 3, separately for the high-increase and low-increase districts.
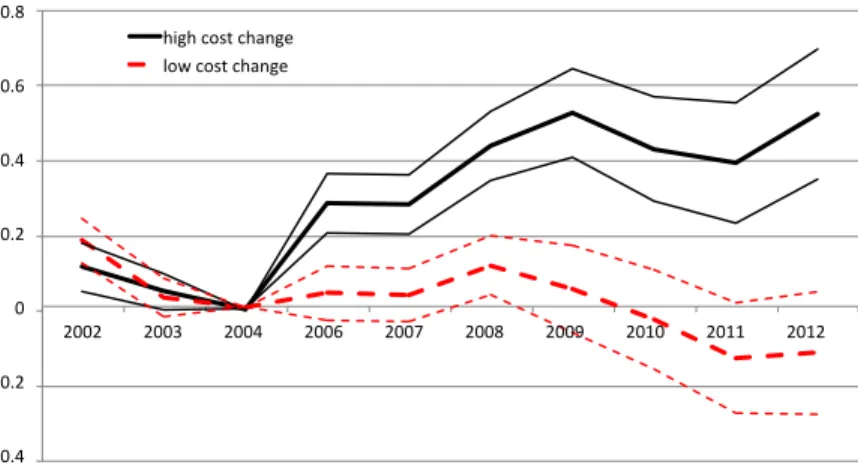
Our main findings are reported in figures 7 and 8, where the solid (black) line displays the estimated time effects from specification (1) transition probabilities for high cost change districts, and the dashed (red) line reports this average for low cost change districts.
Figure 7 displays the time effects for the transition probability from a delinquency to insolvent. While there is virtually no time variation for the low cost change district, there is a sharp rise in the transition into insolvency for high cost change district starting with the reform. The change settles at 40 log points in 2008.
The transition probability into bankruptcy from newly insolvent, displayed in figure 8 (left panel), drops more and more persistently in high cost change districts, consistent with the notion that the cost increase is the mechanism through which the reform affects the transitions into bankruptcy and severe delinquency. Finally, the transition probability from a new insolvency to foreclosure (figure 8, right panel) rises more than twice as much in high cost change districts relative to low cost change districts.
Summarizing, the cross-district analysis confirms our hypothesis that the increase in filing costs has significant implications for household bankruptcy and delinquency behavior. Our findings are consistent with the notion that higher increase in costs prevents a larger fraction of financially distressed individuals from filing for bankruptcy protection, pushing them into insolvency and foreclosure. Given evidence in Lupica (2012) that the cost increases are independent of business cycle or aggregate filing behavior, we view our findings as suggestive of direct effects of the law on these outcomes. In the next section, we provide further evidence by using a regression approach, where we control for business cycle and recession effects on the district level, and exploit the cross-district variation in filing cost.
19We focus here on Chapter 7, which is the dominant chapter of choice for US households - roughly 70%
of observed filings are Chapter 7 filings. This chapter is also more suitable for filers with low assets, which are more likely to be cash-strapped, increasing the potential impact of filing costs changes.
0.2
0.3 0.1 0.1
0.2 0.2 0.1 0.2
0.2 0.1
0.3 0.3
0.2 0.2 0.2
0.1
0.1
0.2 0.2
0.1 0.2
0.2 0.2 0.2
0.1 0.3
0.2
0.2 0.2
0.3
0.3 0.2
0.3 0.3
0.2 0.2 0.2
0.1
0.2
0.1
0.1 0.2
0.1
0.2 0.2
0.1
0.2 0.2
0.1 0.1 0.1 0.1
0.2
0.1
0.1
0.1 0.1
0.2 0.0
0.2
0.3
0.3 0.3 0.2
0.1 0.1
0.1 0.1
0.1 0.2
0.2 0.2 0.2
0.1
0.1
0.1 0.1
0.2 0.2
0.2 0.2
0.2 0.2
0.3 0.2
0.1
(%) (0.267,0.325]
(0.227,0.267]
(0.200,0.227]
(0.180,0.200]
(0.163,0.180]
(0.142,0.163]
(0.117,0.142]
(0.098,0.117]
[0.000,0.098]
by United States Court District
Pre−BAPCPA Chapter 7 Bankruptcy Filing Rates
0.1
0.1 0.0 0.1
0.1 0.1 0.0 0.0
0.1 0.1
0.1 0.1
0.1 0.1 0.1
0.1
0.1
0.1 0.1
0.1 0.1
0.1 0.1 0.1
0.1 0.1
0.1
0.1 0.1
0.1
0.1 0.1
0.1 0.1
0.0 0.0 0.0
0.0
0.1
0.0
0.1 0.1 0.1
0.1 0.1
0.1
0.1 0.1
0.1 0.0 0.1 0.1
0.1
0.1
0.1 0.1
0.1
0.1 0.4
0.1
0.1
0.1 0.1 0.1
0.1 0.1
0.0 0.1
0.0 0.1
0.1 0.1 0.1
0.0
0.0
0.1 0.1
0.1 0.1
0.1 0.1
0.1 0.1
0.1 0.1
0.1
(%) (0.116,0.433]
(0.101,0.116]
(0.096,0.101]
(0.086,0.096]
(0.075,0.086]
(0.062,0.075]
(0.057,0.062]
(0.044,0.057]
[0.019,0.044]
by United States Court District
Post−BAPCPA Chapter 7 Bankruptcy Filing Rates
48
82 64 21
56 52 60 90
44 48
49 71
59 37 70
50
44
51 42
52 38
39 27 49
50 58
60
55 51
64
51 63
49 50
73 79 73
42
61
58
23 16 35
52 52
49
58 68
42 60
15 58
42
32
51 28
47
52 43
74 63 77 65
43 52
78 37
58 65
70 46 38
64
73
34 50
67 60
60 62
50 54
60 59
34
Percent Decrease (71.383,90.488]
(64.154,71.383]
(59.576,64.154]
(55.181,59.576]
(51.205,55.181]
(48.865,51.205]
(42.433,48.865]
(35.205,42.433]
[15.257,35.205]
No data
by United States Court District
Percent Decrease in Chapter 7 Bankruptcy Filing Rates
Figure 6: Chapter 7 bankruptcy by district, pre- and post- reform, and mean percentage
drop post-reform. Source: Authors’ calculation based on Federal Reserve Bank of New
York’s Consumer Credit Panel/Equifax Data.
-‐0.4 -‐0.2 0 0.2 0.4 0.6 0.8
2002 2003 2004 2006 2007 2008 2009 2010 2011 2012
high cost change low cost change
Figure 7:
βs(t)for 4 quarter ahead transition probability from Newly Delinquent to Insolvent (without foreclosure) for districts in the top 30% (high cost change) and bottom 30% (low cost change) of the cost change distribution. Source: Authors’ calculation based on Federal Reserve Bank of New York’s Consumer Credit Panel/Equifax Data.
-‐1.4 -‐1.2 -‐1 -‐0.8 -‐0.6 -‐0.4 -‐0.2
0 2002 2003 2004 2006 2007 2008 2009 2010 2011 2012
high cost change low cost change
-‐0.6 -‐0.4 -‐0.2 0 0.2 0.4 0.6 0.8 1 1.2
2002 2003 2004 2006 2007 2008 2009 2010 2011 2012 high cost change
low cost change