Working Paper
Ride-pooling efficiency in large, medium-sized and small towns Simulation assessment in the Munich metropolitan region
Author(s):
Zwick, Felix; Kuehnel, Nico; Moeckel, Rolf; Axhausen, Kay W.
Publication Date:
2020-12
Permanent Link:
https://doi.org/10.3929/ethz-b-000456200
Rights / License:
In Copyright - Non-Commercial Use Permitted
This page was generated automatically upon download from the ETH Zurich Research Collection. For more information please consult the Terms of use.
Small Towns
Simulation Assessment in the Munich Metropolitan Region
Felix Zwick Nico Kuehnel Rolf Moeckel Kay W. Axhausen
Preprint December 2020
Ride-Pooling Efficiency in Large, Medium-Sized and Small Towns
Felix Zwick IVT
ETH Zürich &
MOIA GmbH Hamburg
felix.zwick@ivt.baug.ethz.ch
Nico Kuehnel
Department of Civil, Geo and Environmental Engineering
TU Munich
Rolf Moeckel
Department of Civil, Geo and Environmental Engineering
TU Munich
Kay W. Axhausen IVT
ETH Zurich
December 2020
Abstract
This study introduces an autonomous ride-pooling service to six communities with varying population sizes and trip densities in the Munich Metropolitan Region. We investigate a laissez-faire scenario without additional policies, defining the modal shift through an incremental mode choice model. Additionally, a draconian scenario in which each within- city car trip is replaced by ride-pooling is analyzed. Results indicate a logarithmic increase in system efficiency with increasing trip densities. While the results confirm the potential of ride-pooling systems to reduce private car fleets drastically, a reduction of traveled km is identified for scenarios with more than 1,000 requests per km2 per day.
Keywords
On-demand mobility; Ride-sharing; New mobility; Population density; Pooling efficiency
1 Introduction
In the course of digitization on-demand transport services have emerged world-wide. They offer a personalized and convenient transportation service bookable via smartphone app, and promise to reduce required resources to satisfy mobility needs compared to a system in which everybody drives alone in a private car.
There are multiple studies assessing the impacts of on-demand services. While private cars are usually only used for a few daily trips of one person, hailed vehicles can serve multiple travel parties, and thus, the number of required vehicles is reduced (Pernestål and Kristoffersson, 2019; Jing et al., 2020). Unpooled on-demand services generally lead to an increase of vehicle kilometers travelled (VKT) due to additional trips to pick up customers and to reallocate vehicles to areas with high expected demand (Henao and Marshall, 2019). When trips are pooled, meaning that trips with a similar route are undertaken in the same vehicle, the potential to reduce fleet sizes and VKT increases (Pernestål and Kristoffersson, 2019). In this paper, we investigate the potential of pooled on-demand mobility in six different cities with population sizes ranging from 16 thousand to 1.5 million inhabitants and quantify the impact of request density on service efficiency.
The work is based on a previous simulation assessment introducing ride-pooling (RP) in Munich (Zwick et al., 2020).
A market analysis by Foljanty (2020) showed that in September 2020 there were more than 200 active ride-pooling projects with a majority begun after 2015. While the largest ride-pooling service by Via (2020) employed a fleet of more than 6,000 vehicles in New York City in 2019 (The City of New York, 2020), most of the mentioned services operate with small fleet sizes below 50 vehicles. The majority of the services are designed either as a feeder service for the first/last mile to transit or in scenarios with low-demand densities to replace inefficient bus routes.
Reck and Axhausen (2020) investigated multiple first/last mile feeder on-demand services and point out that for many of the services ridership is below the previous expectations of the respective promoters. They conceptually explain the low usage by the additional transfer and wait times and by the additional costs that often exceed values of travel time savings of potential users. Besides these challenges there is a risk that due to a low-request density, trips cannot be pooled efficiently, and thus VKT increase.
Fishelson (2018) analysed the impact of demand density on the efficiency of unpooled on-demand vehicles and found a poor service performance (measured in service profit) below a request density of 16 rides/km2 and a logarithmic increase in performance with increasing request density.
While there are multiple studies quantifying the impact of ride-pooling, we did not find any papers analyzing the effects of ride-pooling for different town sizes and request densities
systematically. In this study, we introduce an autonomous ride-pooling system with equal service parameters in six different towns in Bavaria, Germany, employ a mode choice model to define mode shifts and simulate the requests with a ride-pooling fleet large enough to serve all customers. This way, we provide relevant statistics to predict the efficiency of ride-pooling services in varying urban contexts.
2 Methodology and Simulation Setup
The methodology is in line with (Zwick et al., 2020) to ensure comparability of the five newly developed scenarios here and the mentioned simulation assessment for Munich.
The open-source agent- and trip-based demand model MITO (Microscopic Transportation Orchestrator) (Moeckel et al., 2020) was used to obtain travel demand for each agent of the synthetic population of the Munich metropolitan area. The synthetic population includes persons, households, jobs and dwellings and was prepared with an iterative proportional updating method (Moreno and Moeckel, 2018). The multi-agent transport simulation MATSim (Horniet al., 2016) was used to assign all agents’ car and ride-pooling trips on the network, which was derived from OpenStreetMap (OSM) (OpenStreetMap Contributors, 2020).
For the simulation of ride-pooling we made use of the drt extension introduced by Bischoff et al.(2017). We implemented a door-to-door service with a maximum wait time of 10 min and a maximum detour of 10 min + 50 % of the travel time for the trip without detouring.
The stop duration is set to 30 s. We enabled the default rebalancing described by Bischoff and Maciejewski (2020). All service parameters are in line with the door-to-door scenarios in (Zwick et al., 2020).
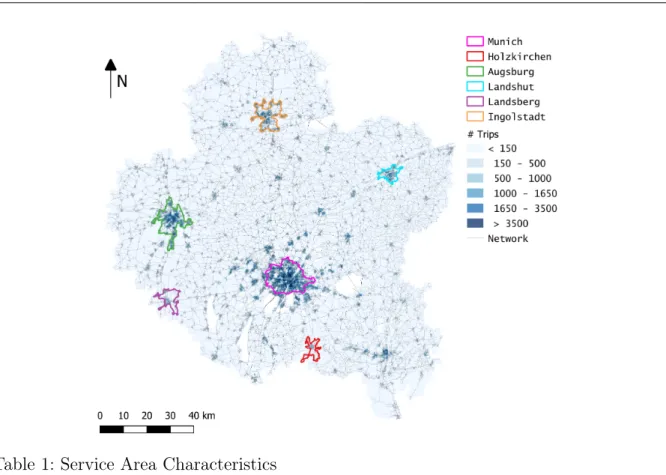
The study area with the six considered service areas is shown in Figure 1. Each cell of the study area is pigmented according to the number of trips departing in the respective cell. The service area in Munich is derived from (Zwick et al., 2020), while all other service areas were selected to cover the most densely populated areas (in relation to the community’s total population) in and around each city border. They display a range of population sizes and densities and represent each of the four Bavarian city typologies (Bayerische Staatskanzlei, 2020).
The characteristics of each service area are shown in Table 1. The population num- bers were obtained from (Bayrisches Landesamt für Statistik, 2019) and account for the entire city that can slightly deviate from the population size in the respective service areas. The car ownership rate is based on the synthetic population of each service area.
Figure 1: Study area overview including six service areas.
Table 1: Service Area Characteristics
Laissez-faire scenario Draconian scenario Area Population Service area
size [km2]
RP share
[%] RP trips RP trip density
[trips/km2] RP trips RP trip density [trips/km2]
Munich 1,471,104 195.7 16 503,037 2,570 1,912,783 9,774
Augsburg 295,216 127.4 15 132,802 1,042 521,783 4,096
Ingolstadt 137,408 98.8 14 35,408 358 246,957 2,500
Landshut 72,560 40.6 12 16,382 403 128,623 3,168
Landsberg 29,165 50.2 11 4,209 84 61,443 1,224
Holzkirchen 16,750 34.1 7 653 19 30,536 895
Car ownership was not included in official census data and is not controlled as such.
However, a car ownership model was estimated based on socio-demographic attributes, such as income, home area type, distance to transit and driver licenses (Okrah et al., 2018). We simulated two scenarios for each service area: Alaissez-faire scenario in which autonomous ride-pooling is implemented and available to all agents for within-service-area trips and adraconian scenario in which all car trips within the service area are replaced by ride-pooling trips. The mode choice results in the laissez-faire scenario were determined with an incremental logit model approach described by Koppelman (1983). The choice parameters for ride-pooling are based on the car passenger mode in MITO’s default mode choice model, with updated generalized costs that take into account waiting and detour time as well as costs of the service. The modal shifts towards ride-pooling increase with
the population size. Reasons can be the lower car ownership in large towns and longer trip distances.
In the draconian scenario, we first employed a full-scale base case simulation of MITO’s car travel demand in MATSim and let it iterate until equilibrium was reached. Thereby, we identified trips that enter, leave or are completely inside each use case’s respective service area. In the next step, we cropped all trips outside of the service area and replaced the remaining car trips by ride-pooling, such that agents will arrive or leave the service area at the same time and location as they would have in the car simulation. As this scenario mimics a policy in which the usage of private cars inside the service area is completely forbidden, trips that cross the service area are not considered as they are expected to route around the service area in reality.
3 Service Results
The ride-pooling service was evaluated for each scenario with a focus on system efficiency.
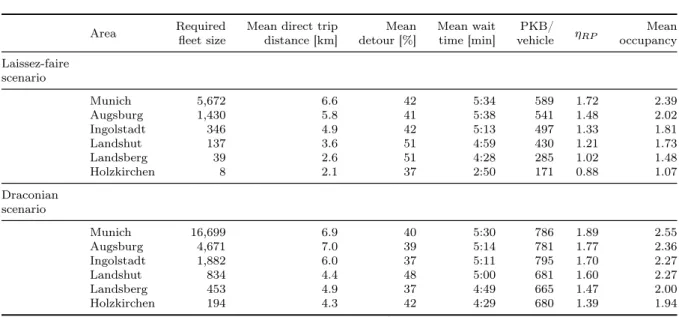
Table 2 shows the service performance indicators for each scenario. The number of necessary vehicles describes the maximum number of vehicles in service, i.e. transporting passengers or driving towards a pick-up or relocating, at the same time over the course of a day. We do not account for additional vehicles that are required due to charging or maintenance breaks to ensure comparability across the scenarios. However, the input fleet sizes are slightly larger. The service level is similar across all scenarios with an average wait time between 4:29 minutes and 5:38 minutes, with the exception of the laissez-faire scenario in the small city of Holzkirchen with an average wait time of 2:50 minutes. The mean detour ranges between 37 % and 51 % with the highest detour rates in small service areas with short trip distances. The rejection rate is below 0.2 % for all scenarios.
To define the system efficiency, we measured the passenger kilometers booked (PKB) in each scenario through the product of ride-pooling trips and the mean direct trip distance.
The PKB value reflects the number of kilometers that would have been driven if all agents had travelled alone in a private vehicle. Per vehicle, up to 600 PKB are covered in the laissez-faire scenarios and up to 800 km are covered in the draconian scenario. Considering average trip distances far below 10 km, this result shows the enormous potential to reduce the required vehicle fleet size and is an important indicator for ride-pooling operators to estimate fleet sizes for a given expected demand.
Table 2: Simulation results
Area Required
fleet size
Mean direct trip distance [km]
Mean detour [%]
Mean wait time [min]
PKB/
vehicle ηRP Mean
occupancy Laissez-faire
scenario
Munich 5,672 6.6 42 5:34 589 1.72 2.39
Augsburg 1,430 5.8 41 5:38 541 1.48 2.02
Ingolstadt 346 4.9 42 5:13 497 1.33 1.81
Landshut 137 3.6 51 4:59 430 1.21 1.73
Landsberg 39 2.6 51 4:28 285 1.02 1.48
Holzkirchen 8 2.1 37 2:50 171 0.88 1.07
Draconian scenario
Munich 16,699 6.9 40 5:30 786 1.89 2.55
Augsburg 4,671 7.0 39 5:14 781 1.77 2.36
Ingolstadt 1,882 6.0 37 5:11 795 1.70 2.27
Landshut 834 4.4 48 5:00 681 1.60 2.27
Landsberg 453 4.9 37 4:49 665 1.47 2.00
Holzkirchen 194 4.3 42 4:29 680 1.39 1.94
PKB: Passenger kilometers booked excluding detours;ηRP = PKB/VKT
A performance indicator for ride-pooling systems is the system efficiency, ηRP, defined as the ratio of the passenger kilometers booked (PKB), dPKB, to the vehicle kilometers travelled (VKT), dVKT, proposed by Liebchen et al. (2020). This indicator takes into account the following three factors:
• mean detouring (less detouring leads to higher efficiency), represented by the ratio of PKB,dPKB, to the passenger kilometers travelled including detours (PKT),dPKT,
• mean occupancy (higher occupancy leads to higher efficiency), represented by the ratio of PKT, dP KT, to the overall amount of vehicle kilometers driven occupied (VKO), dVKO and
• occupied km (more occupied km, i.e. less empty km, lead to higher efficiency), represented by the ratio of VKO to vehicle kilometers travelled (VKT), dVKT:
ηRP= 1
mean detouring·mean occupancy·occupied km share = dPKB dPKT
· dPKT
dVKO
·dVKO
dVKT
= dPKB dVKT
. (1)
Liebchen et al. (2020) give a value of 1.36 as the reference ηRP value for car travel, meaning that above this value the ride-pooling system causes fewer vehicle kilometers than if all passengers were driving by car (with a mean occupancy of 1.36). This value is calculated through the average occupancy of private cars in Germany but does not take into account other factors like parking search traffic or detours to avoid traffic. In the laissez-faire scenario, only the services in Munich and Augsburg exceed this value, whereas the draconian scenarios in all case study areas do.
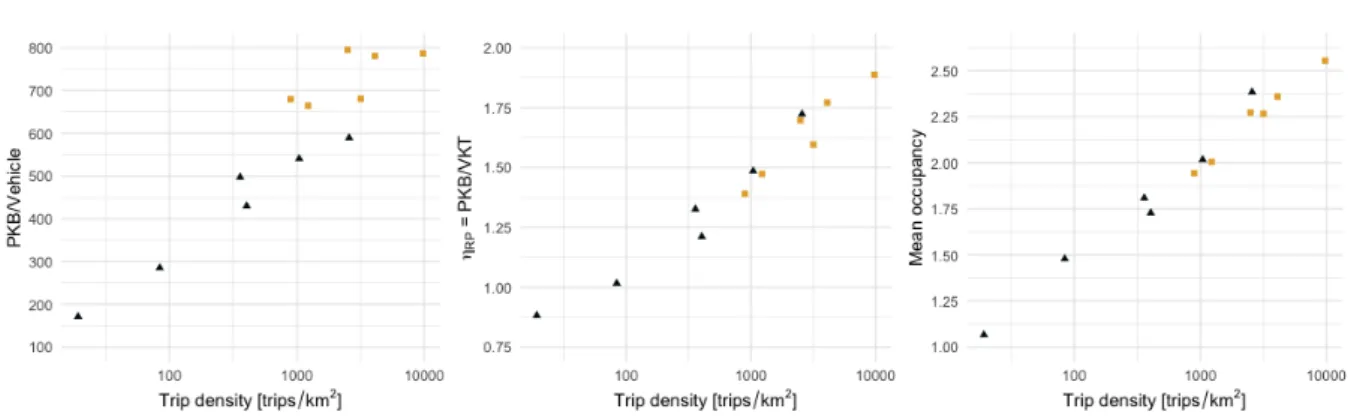
Figure 2: Correlation of trip density and average vehicle occupancy, PKB/VKT and PKB per vehicle (note the log10-scale).
The mean vehicle occupancy represents the mean number of passengers that sit in a ride-pooling vehicle for all vehicles over time, also taking into account empty km. The values vary from 1.07 to 2.55 and are higher in the draconian scenarios. It is noteworthy that MITO’s travel demand forecasting does not model group travel, which would increase the ride-pooling efficiency further.
Figure 2 shows the three service-efficiency indicators plotted against trip density on a logarithmic scale. All indicators generally increase with increasing trip density. The PKB per vehicle increase logarithmically for the laissez-faire scenarios. In the draconian scenario, we observe stagnating values around 700 km for the smaller cities Landshut, Landsberg and Holzkirchen and around 800 km for the larger cities Munich, Augsburg and Ingolstadt, which might exhibit natural limits of the system. It also shows that PKB per vehicle do not only correlate with trip density but also with other factors, such as service area size, trip distances and total number of trips. Operational challenges like driver or charging breaks can decrease the efficiency of each vehicle and should be included in future research. The increases of η and mean occupancy with increasing trip density show a clear logarithmic pattern throughout all scenarios.
4 Conclusion
This study systematically analyses the system efficiency of ride-pooling systems in six urban areas with varying population sizes and densities. We show a clear logarithmic relationship between trip density and the system efficiency indicatorsη andmean vehicle
occupancy. Liebchen et al. (2020) stated that a positive impact on traffic compared to a system with everyone travelling by car is reached with a η value above 1.36. We observe that a daily trip density of at least 1000 trips/km2 is necessary to reach this value. Current real-world ride-pooling implementations for first/last mile feeder services or in sparsely populated areas face much lower request densities, and thus a low utilization can be expected alongside the challenges mentioned by Reck and Axhausen (2020). Despite the low efficiency, a system facing such low demand may still add societal value if the attractiveness of public transportation is increased. Furthermore, we observe a great potential to satisfy the same travel demand with substantially fewer vehicles throughout all scenarios.
In this study we only focus on one on-demand system with the same service parameters throughout all scenarios. Other ride-pooling policies like the one proposed by Alonso- Mora et al. (2017) might lead to a more efficient pooling of passengers in different spatial environments. However, as shown by Zwick and Axhausen (2020), the potential for an efficiency increase is rather low in scenarios with low rejection rates. A further potential could be the implementation of a non-on-demand system that pre-optimizes trips long before the trip departures. Future research may incorporate functionalities to collect pre-booked rides and assign the most efficient allocation in advance. Another limitation of this study is the consideration of an optimized autonomous service without any operational challenges, such as driver shifts and breaks, charging for electric vehicles, delayed passengers or construction sites. Future studies should define the impact of these challenges for electric non-autonomous ride-pooling services.
Acknowledgements
This study was completed with the support of the Technical University of Munich – Institute for Advanced Study, funded by the German Excellence Initiative and the European Union Seventh Framework Programme [grant number 291763]. Felix Zwick is a PhD candidate at ETH Zurich and funded by MOIA GmbH.
5 References
Alonso-Mora, J., S. Samaranayake, A. Wallar, E. Frazzoli and D. Rus (2017) On-demand high-capacity ride-sharing via dynamic trip-vehicle assignment, Proceedings of the National Academy of Sciences of the United States of America, 114 (3) 462–467, ISSN 10916490.
Bayerische Staatskanzlei (2020) Anhang 1 der Verordnung über das Landesen- twicklungsprogramm Bayern (LEP), https://www.gesetze-bayern.de/Content/
Document/BayLEP-ANL{_}2?hl=true.
Bayrisches Landesamt für Statistik (2019) Einwohnerzahlen am 31. März 2019, Technical Report, Fürth.
Bischoff, J. and M. Maciejewski (2020) Proactive empty vehicle rebalancing for Demand Responsive Transport services, Procedia Computer Science, 170, 739–744, jan 2020, ISSN 18770509.
Bischoff, J., M. Maciejewski and K. Nagel (2017) City-wide shared taxis: A simulation study in Berlin, paper presented at the 2017 IEEE 20th International Conference on Intelligent Transportation Systems (ITSC), vol. 2018-March, 275–280, oct 2017, ISBN 978-1-5386-1526-3.
Fishelson, J. (2018) Planning for a Shared Automated Transportation Future, Ph.D.
Thesis, University of Michigan.
Foljanty, L. (2020) Mapping the Global On-Demand Ridepooling Market.
Henao, A. and W. E. Marshall (2019) The impact of ride-hailing on vehicle miles traveled, Transportation,46 (6) 2173–2194, dec 2019, ISSN 15729435.
Horni, A., K. Nagel and K. W. Axhausen (eds.) (2016) The Multi-Agent Transport Simulation MATSim, Ubiquity Press, aug 2016, ISBN 9781909188754.
Jing, P., H. Hu, F. Zhan, Y. Chen and Y. Shi (2020) Agent-Based Simulation of Au- tonomous Vehicles: A Systematic Literature Review, IEEE Access, 8, 79089–79103, ISSN 2169-3536.
Koppelman, F. S. (1983) Predicting transit ridership in response to transit service changes, Journal of Transportation Engineering,109 (4) 548–564.
Liebchen, C., M. Lehnert, C. Mehlert and M. Schiefelbusch (2020) Ridepooling-Effizienz messbar machen, Der Nahverkehr,9, 18–21.
Moeckel, R., N. Kuehnel, C. Llorca, A. T. Moreno and H. Rayaprolu (2020) Agent-Based Simulation to Improve Policy Sensitivity of Trip-Based Models, Journal of Advanced Transportation,2020, 1902162, ISSN 0197-6729.
Moreno, A. and R. Moeckel (2018) Population Synthesis Handling Three Geographical Resolutions, ISPRS International Journal of Geo-Information, 7 (5) 174, may 2018, ISSN 2220-9964.
Okrah, M. B., A. T. Moreno, C. Llorca and R. Moeckel (2018) Modeling Household Car Ownership Level Changes in an Integrated Land-Use/Transport Model, paper presented at theTransportation Research Board 97th Annual Meeting.
OpenStreetMap Contributors (2020) OpenStreetMap, www.openstreetmap.org. Last accessed: 2020-11-15.
Pernestål, A. and I. Kristoffersson (2019) Effects of driverless vehicles : Comparing simulations to get a broader picture,European Journal of Transport and Infrastructure Research, 1 (19) 1–23.
Reck, D. J. and K. W. Axhausen (2020) Subsidized ridesourcing for the first/last mile:
How valuable for whom?,European Journal of Transport and Infrastructure Research, 20 (4) 59–77, ISSN 15677141.
The City of New York (2020) NYC Open Data - FHV Base Aggregate Report, nov 2020, https://data.cityofnewyork.us/Transportation/FHV-Base-Aggregate-Report/
2v9c-2k7f.
Via (2020) https://ridewithvia.com/. Last accessed: 2020-11-15.
Zwick, F. and K. W. Axhausen (2020) Analysis of ridepooling strategies with MATSim, paper presented at the20th Swiss Transport Research Conference.
Zwick, F., N. Kuehnel, R. Moeckel and K. W. Axhausen (2020) Agent-Based Simulation of City-Wide Autonomous Ride-Pooling and the Impact on Traffic Noise.