Flue Gas Treatment
Innovative Technical Solutions for Reduction of Waste Fuel Specific Emissions in Cement Plants
Renato Sarc, Roland Pomberger and Karl E. Lorber
1. Situation of European cement industry ...475
1.1. Energy recovery from RDF in the austrian cement industry ...478
1.2. Energy recovery for RDF in cement kilns...481
2. Emissions from cement plants ...483
2.1. Selected real data on measured emissions from austrian cement plants ...485
2.2. Comparison of specific CO2 emissions at international level ...489
3. Innovative technical solutions for reduction of waste fuel specific emissions ...490
3.1. Exmercury splitted preheater system ...491
3.2. CTP-off-gas treatment system ...492
4. Conclusions ...494
5. References ...495 In this contribution, after the introduction in the issue and presentation of the current state of international cement industry, real data on measured emissions (dust, organic carbon, nitrogen oxide, mercury, cadmium and thallium as well as dioxins and furans) from selected Austrian cement plants are delivered. Additionally, selected data on CO2 emissions are shown. Finally, innovative technical solutions for reduction of waste fuel specific emissions are presented. On the one side, Exmercury splitted preheater system for reduction of mercury emissions in the precipitated filter dust, and on the other side the CTP-regenerative thermal oxidation (RTO) for efficient treatment of volatile organic pollutants and odours in off gas are described. Both technologies have been successfully installed and are operating in selected Austrian cement plants.
1. Situation of European cement industry
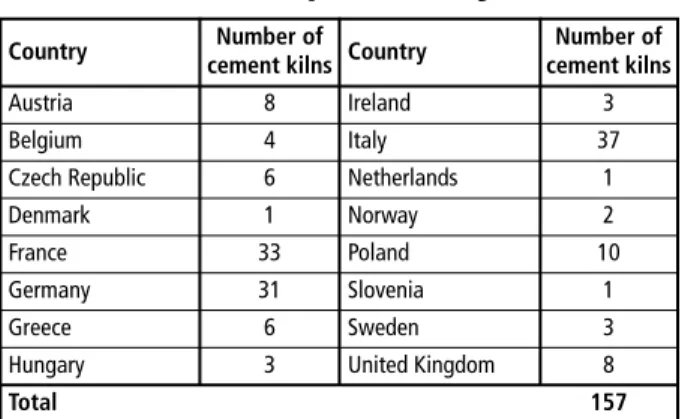
Altogether, 157 cement kilns use alternative fuels (refuse derived fuels – RDF) for supplying their thermal energy demand in selected countries of the EU and in Nor- way. The regional distribution of these installations across the EU Member States is documented in the following Table 1.
Flue Gas Treatment
After adequate and extensive (pre-)treatment of input waste materials in different proces- sing plants and applying strictly defined quality assurance measures, various non-hazardous and/or hazardous waste materials from households, commerce and industry can be used as RDF in co-incineration plants (cement industry, among others): sewage sludge, waste wood, high calorific fractions from mechanical-physical treatment (MPT) or mechanical- biological treatment (MBT) plants, calorific fractions of household and commercial wastes, shredder light fractions (for example, from old vehicles and waste electric and electronic equipment (WEEE), scrap tyres, waste oil and used solvents. In the narrow sense of the definition, only solid waste fuels which are prepared from non-hazardous sorted or mixed solid wastes exclusively (municipal waste fractions, commercial wastes, production wastes, construction and demolition waste, packaging wastes, lightweight fractions from MBT- plants, among others) including quality assurance measures and intended to be used for the purpose of energy generation are defined as solid recovered fuels (SRF). [29]
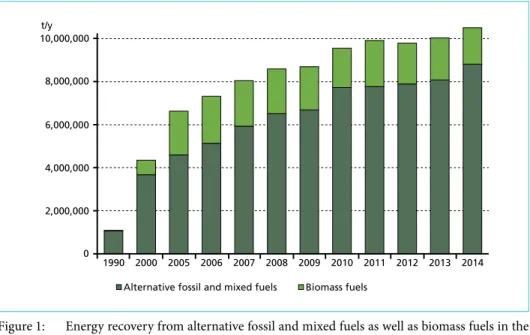
In total, about 10,510,000 tonnes RDF have been utilized for energy recovery in the EU 28 in 2014, corresponding to an average thermal substitution rate (TSR) of 41 percent, compare Figure 1. [31]At the global level, average TSR is about 16 percent, whereby TSR in CKJ (China, Korea and Japan) is 8 percent, in India 3 percent only, 13 percent in Canada and in the USA 15 percent. [26]
The TSR however vary quite distinctively between individual countries, with the cement industry in some countries achieving a TSR of only 7 percent, compared to more than 75 percent in others. Figure 2 shows the current TSR in all of the analysed countries, along with the expected medium-term and long-term outlook, based on expert opinion of local representatives. [14]
Austria (not shown in Figure 2) Germany, Czech Republic, Poland, Sweden, Belgium and the UK have achieved TSR well above the EU average. Hungary and France operate in the same range of the EU average. Ireland, Portugal, Spain, Bulgaria, Italy and Greece performed more than ten percent point below the EU average. The perceived potential for further increase in fuel substitution varies significantly between all of the analysed countries. When being asked, the experts of the six best performing states envisioned that the TSR in their country can reach 65 percent or higher in the medium-term outlook (5 to 10 years), while five more country experts expected their fuel substitution to reach 40 percent in that period. [14]
Country Number of
Country Number of
cement kilns cement kilns
Austria 8 Ireland 3
Belgium 4 Italy 37
Czech Republic 6 Netherlands 1
Denmark 1 Norway 2
France 33 Poland 10
Germany 31 Slovenia 1
Greece 6 Sweden 3
Hungary 3 United Kingdom 8
Total 157
Sources:
Brown, M.: Refuse Derived Fuel – A European Market Heading for Over- capacity. In: Thomé-Kozmiensky, K.;
Thiel, S. (eds.): Waste Management, Volume 6. Neuruppin: TK Verlag Karl Thomé-Kozmiensky, 2016. ISBN: 978-3- 944310-29-9
De Beer, J.; Cihlar, J.; Hensing, I.; Zabeti, M.: Status and prospects of co-processing of waste in EU cement plants. Ecofys – A Navigant Company. 2017; Online: https://
cembureau.eu/media/1612/2017-05-11_
ecofys_publication_alternativefuels_re- port.pdf
Table 1: Cement kilns capable of utilizing SRF and RDF
Flue Gas Treatment Figure 2: Current and expected medium-term and long-term outlook TSR in selected EU Member
States
Source: De Beer, J.; Cihlar, J.; Hensing, I.; Zabeti, M.: Status and prospects of co-processing of waste in EU cement plants. Ecofys – A Navigant Company. 2017; Online: https://cembureau.eu/media/1612/2017-05-11_ecofys_publication_alternativefuels_report.pdf
0 2,000,000 4,000,000 6,000,000 8,000,000 10,000,000
1990 2000 2005 2006 2007 2008 2009 2010 2011 2012 2013 2014 Alternative fossil and mixed fuels Biomass fuels
t/y
Figure 1: Energy recovery from alternative fossil and mixed fuels as well as biomass fuels in the EU 28 for the time period 1990 to 2014
Source: WBCSD: WBCSD Cement Sustainability Initiative Getting the Numbers Right Project Emissions Report 2014. 2017;
Online: http://www.wbcsdcement.org/index.php/key-issues/climate-protection/GNR-database
80 100
%
60 40 20
German y
Czech Rep.Belgium Poland Sweden
UK EU 28 Hungar
y
France Irelan d
Portuga l
Spain Bulgaria
Italy Greec
e
Current rate Medium-term outlook Long-term outlook 0
65 62 53 52 48 44
41 40 37
29 28 23 21 13 7
20 40 30 60 40 50 50 40 35 60 50 80 50 60 65
80 60 80 60 85 65 80 65 80 80 90 80 90
De Beer et al. [14] noted as follow: Since the co-processing rate depends on the availability of waste for fuel, it was expected that a relation exists between the maturity of the waste management system and co-processing rates. As Figure 3 shows, a certain connection between the share of waste being landfilled and fuel substitution in cement kilns is no- ticeable, however the link is not conclusive.
Flue Gas Treatment
Figure 3: Relation between landfilling and TSR
Source: De Beer, J.; Cihlar, J.; Hensing, I.; Zabeti, M.: Status and prospects of co-processing of waste in EU cement plants. Ecofys – A Navigant Company. 2017; Online: https://cembureau.eu/media/1612/2017-05-11_ecofys_publication_alternativefuels_report.pdf
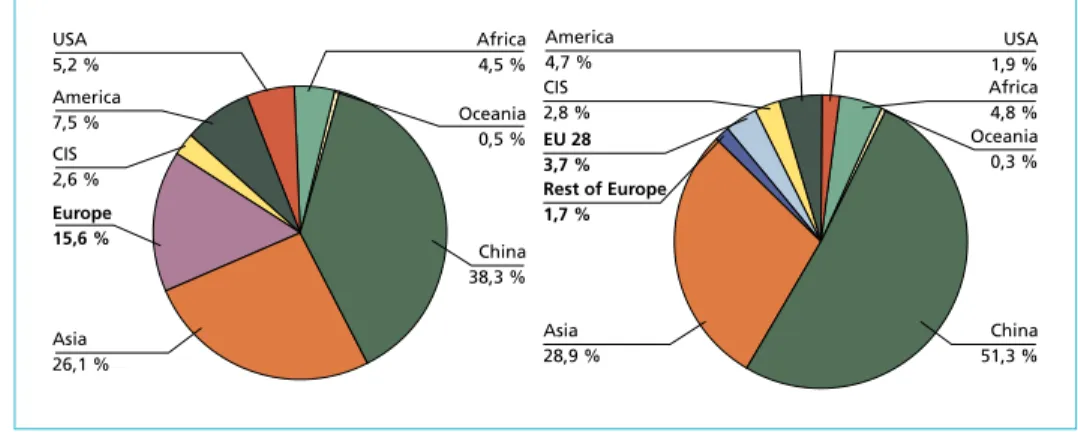
Current worldwide production of cement is well above 4,500 million tonnes per year [2]. Europe’s share at the world market has decreased from 15 percent in 2001 to 5 percent in 2015 (Figure 4).
100
Greece Bulgaria
Italy
Spain Portugal
Ireland
Hungary UK EU 28 average
Sweden
Poland
Czech Republic
Germany Belgium Waste being landfilled
(excl. major mineral wastes)
%
80 60 40 20
10 20 30
thermal energy consumption in cement kilns coming from alternative fuels
%
40 50 60 70
The size of the bubble (blue) is not indicative of the clinker production in the country as data were unavailable. All data are for 2014, with the exception of Portugal and Bulgaria where data are from 2013.
0 0
The size of the bubble indicates the relative clinker per capita production in the country
France
China 38,3 % CIS
2,6 %
China 51,3 % Europe
15,6 %
Asia 26,1 %
Oceania 0,5 % Africa 4,5 % USA
5,2 % America 7,5 %
Asia 28,9 % Rest of Europe 1,7 % EU 28 3,7 % CIS 2,8 % America 4,7 %
USA 1,9 % Africa 4,8 % Oceania 0,3 %
Figure 4: Europe’s share of worldwide cement production in 2001 (left) and 2015 (right)
Source: Papsch, F.; Spaun, S.: Ressourcenschonung in der österreichischen Zementindustrie [Conservation of natural resources in the Austrian cement industry]. In: Österreichische Ingenieur- und Architekten-Zeitschrift, 161. Jg., Heft 1-12/2016, 2016
1.1. Energy recovery from RDF in the austrian cement industry
In Austria, there are eleven cement production plants installed, with a total plant capa- city of 5.1 million t/y of clinker. In total, eight cement plants are currently in operation
Flue Gas Treatment
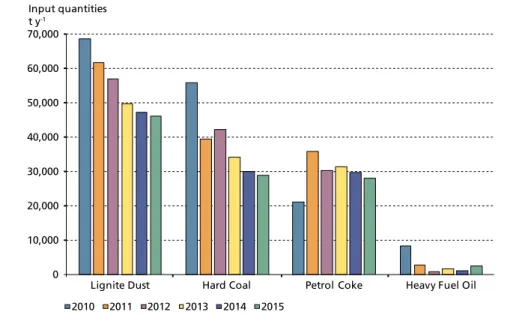
(data for 2016). The specific heat consumption is reported with 3,788 MJ/tclinker. Most important conventional fossil fuels with their average Lower Heating Value (LHV in [MJ tOS-1]) used in the clinker process are [25]:
• lignite coal, LHV: 22,150 MJ/tOS,
• hard coal, LHV: 30,270 MJ/tOS,
• petrol coke, LHV: 31,080 MJ/tOS,
• heavy fuel oil, LHV: 40,030 MJ/tOS.
The following Figure 5 shows amounts of the most common conventional fossil fuels burnt in the Austrian cement industry. From 2010 until 2015, almost all of these types of fuels have experienced a remarkable decline in consumption. The reason is the parallel increase of RDF utilization in Austrian cement plants, from 63 percent already achieved in 2010 to 76 percent in 2015. [25]
0 10,000 20,000 30,000 40,000 50,000 60,000 70,000
Lignite Dust Hard Coal Petrol Coke Heavy Fuel Oil Input quantities
t y-1
2010 2011 2012 2013 2014 2015
Figure 5: Quantities of selected conventional fossil fuels used in the Austrian cement industry, time period 2010 to 2015
Source: Mauschitz, G.: Emissionen aus Anlagen der österreichischen Zementindustrie [Emissions from plants of the Austrian cement industry]. Report. Vienna: Vienna University of Technology, 2016
On the other side, as mentioned above amounts of RDF used have been constantly rising in cement industry. In total, about 493,329 t/y of RDF were used in Austrian cement industry, corresponding to a TSR of about 76.1 percent in 2015, with a (weight and energy) share of about 62 percent SRF, Figure 6. [25] Even a hundred percent thermal substitution of fossil fuel is technically possible, when an optimized feedstock mix (for example: animal fat and bone meal, used solvents, SRF) is fed at kiln outlet side (main burner) and scrap tyres are fed at kiln inlet side (secondary burner) [28].
Flue Gas Treatment
Mauschitz (2016) reports following frequently used RDF and their LHVs:
• SRF, LHV: 19,400 MJ/tOS,
• end-of-life-tyres, LHV: 29,330 MJ/tOS,
• residuals from paper industry, LHV: 4,850 MJ/tOS,
• used solvents, LHV: 25,420 MJ/tOS,
• waste oil, LHV: 32,850 MJ/tOS.
Regarding SRF, it has to be noted, that in the cement industry following SRF specifica- tions with well defined qualities (LHV, particle size (d95 in [mm]) etc.) are used [29]:
• SRF medium quality: having d95 ≤ 80 (for Hotdisc: d95 ≤ 300) mm and 12 ≤ LHV ≤ 18 MJ/kgOS which is used for energy recovery in secondary firing systems of cement kiln and/or in special pre-combustion chambers like Hotdisc and
• SRF premium quality: having d95 ≤ 30 (up to 35) mm and 18 ≤ LHV ≤ 25 MJ/kgOS that is used for energy recovery in primary firing system of cement kiln.
0 50,000 100,000 150,000 200,000 250,000 300,000
SRF End-of-life tyres Residuals from
paper industry Waste solvents Waste oils
2010 2011 2012 2013 2014 2015
Input quantities t/y
Figure 6: Quantities of selected RDF used in the Austrian cement industry, time period 2010 to 2015
Source: Mauschitz, G.: Emissionen aus Anlagen der österreichischen Zementindustrie (Emissions from plants of the Austrian cement industry). Report. Vienna: Vienna University of Technology, 2016
Waste fuels that make up the biggest share of RDF are SRF medium and premium quality. Since the beginning of the nineties, RDF has experienced a massive increase as alternative fuel burnt in Austrian cement kilns. Figure 7 shows this development in detail, not based on the mass of RDF, but on its energy content. Finally, TSR of 76 percent in 2015 has been reached.
Flue Gas Treatment Figure 7: Thermal energy input of RDF in Austrian cement plants (except for grinding) for the
time period 1988 to 2015
Source: Mauschitz, G.: Emissionen aus Anlagen der österreichischen Zementindustrie (Emissions from plants of the Austrian cement industry). Report. Vienna: Vienna University of Technology, 2016
1.2. Energy recovery for RDF in cement kilns
A wide range of waste materials can be considered for energy recovery, having suitable input raw material properties because of their chemical and physical composition. What type of waste finally will be used in the kiln depends on different requirements, such as clinker production process specification and operating conditions, the raw meal and fuels composition, the feeding points, the off-gas cleaning systems, and the available waste amounts or the waste management structure in general [15].
Selected process conditions for the use of waste fuels in the clinker process can be summarised (acc. to [15]) as follows:
• maximum gas temperature of about 2,000 °C (main burner, flame temperature) and bed temperature of about 1,450 °C in rotary kilns,
• gas retention time of about eight seconds at temperatures above 1,200 °C in rotary kilns,
10,000
Thermal energy input TJ/y
Substitution of conventional, fossil fuels (2015): 76.1 percent Total quantity of RDF (2015): 493,329 t y-1
*Sawdust, waste wood, rubber waste, high caloric fraction, residues from agriculture, etc.
End-of-life tyres
SRF Others* Meat-and-bone meal
Waste oils Waste solvents
Residuals from paper industry 9,000
8,000 7,000 6,000 5,000 4,000 3,000 2,000 1,000
1988 1989
1990 1991
1992 1993
1994 1995
1996 1997
1998 1999
2000 2001
2002 2003
2004 2005
2006 2007
2008 2009
2010 2011
2012 2013
2014 2015 0
Animal fat
Flue Gas Treatment
• oxidizing gas atmosphere in rotary kiln,
• gas retention time in the secondary firing system (at kiln inlet) of more than two seconds at temperatures of above 850 °C.
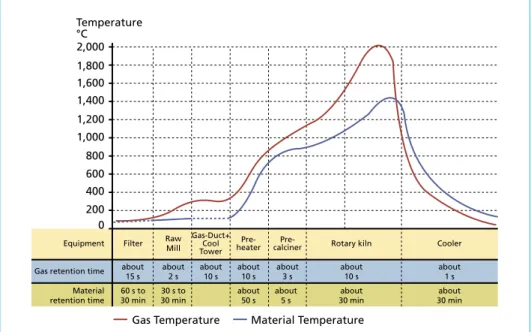
As described below, a characteristic feature of the pyro-chemical clinker burning process is the temperature distribution of gas and solids inside the cement plant which covers a wide range (about 100 to 2,000 °C), Figure 8.
2,000 1,800 1,600 1,400 1,000 1,200
600 800
400 200 Temperature
°C
Gas Temperature Material Temperature 0
Equipment Filter Raw Mill
Gas-Duct+
TowerCool
heaterPre- Pre-
calciner Rotary kiln Cooler
Gas retention time about 15 s about
2 s about 10 s about
10 s about 3 s about
5 s about
50 s 60 s to
30 min 30 s to 30 min
about
10 s about
1 s about 30 min about
30 min Material
retention time
Figure 8: Thermochemical process of clinker burning at different temperature zones
Source: Willitsch, F.; Reinhold, H.: Exmercury – Splitted Preheater System – A new Solution for Emission Reduction in the Cement Industry. 2015; Online: www.atec-greco.com, www.scheuch.com, www.wup.at
There are technical reasons and legal restrictions as well, that restrain the location of the fuel feeding ports in the kiln system:
• The raw meal is heated up gradually, after grinding from 80 °C to about 1,000 °C at the kiln inlet up to the sintering temperature of 1,450 °C in the burning zone, Figure 8;
• According to the Directive 2010/75/EU on Industrial Emissions [17] as well as to the Austrian Waste Incineration Ordinance (WIO) [3], the off-gas has to be heated up to a temperature of > 850 °C with a minimum retention time of two seconds.
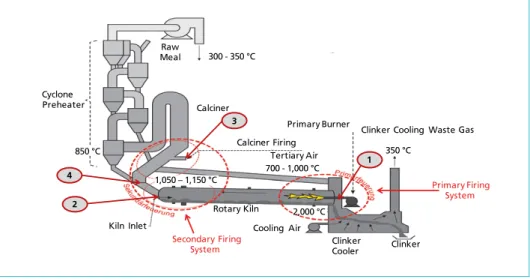
As shown in Figure 9, different feeding ports can be used to charge various types of fuels into the kiln. The potential feeding ports in a cement production plant are [18]:
(1) via the main burner at the rotary kiln outlet end: SRF premium quality: particle size (d95) < 35 mm, LHV: > 18 MJ/kgOS,
Flue Gas Treatment
(2) via secondary burners to the riser duct at the kiln inlet: RDF – scrap tyres, (3) via precalciner burners to the precalciner: SRF medium quality: d95 < 80 mm, LHV:
12 to 18 MJ/kgOS,
(4) via a feed chute to the precalciner (for lump fuel): SRF medium quality: d95 < 300 mm, LHV: 12 to 18 MJ/kgOS.
2 4
1 Cyclone
Preheater
Raw Meal
Calciner 3
Kiln Inlet
Secondary Firing System
Rotary Kiln Cooling Air
Clinker
Cooler Clinker
Primary Firing System Clinker Cooling Waste Gas Primary Burner
Tertiary Air Calciner Firing 300 - 350 °C
2,000 °C
350 °C 700 - 1,000 °C
850 °C
1,050 – 1,150 °C
Figure 9: Potential feeding ports for SRF into the cement kiln
Source: Lorber, K. E.; Sarc, R.: Innovative Pollution Abatement Systems for Waste Fuel operated Cement Kiln. In: Gidarakos, E.; Cossu, R.; Stegmann, R. (eds.): Crete 2016 – 4th International Conference on Industrial and Hazardous Waste Management.
Executive Summaries. Crete, 27-30th September 2016. ISBN: 978-960-8475-24-3
It has to be noted that the way of feeding fuel into the kiln is very important, as this can have a direct effect on the resulting emissions. The safest way to do this is such that the combustion gases from the fuel pass the highest temperature zone (up to 2,000 °C) of the kiln, namely by feeding them through the main burner [15].
2. Emissions from cement plants
Co-incineration of fossil, as well as alternative fuels, results in emissions to air and residues (for example ash) that become a part of the clinker. Type and quantity of the emissions do not only depend on the burning process, but also on the quality of the input material (in other words raw meal and fuel). Simply said, if a material with a higher concentration of a volatile heavy metal, for example mercury (Hg) and thallium (Tl) is fed into the kiln, a higher portion of this heavy metal will be adsorbed on the fine dust and consequently a higher concentration of the heavy metal can be measured in the off-gas and/or filter dust. This phenomenon is described by the volatilization in the hot zone of the combustion process and re-adsorption and precipitation on colder dust particle surface and is specific for each element. Hence, it has to be distinguished
Flue Gas Treatment
between heavy metals that are or have a species that are volatile (in other words Hg, Tl) and those which are non-volatile (for example Cr, As and Ni). A third group includes metals that are or have compounds that are semi-volatile (Sb, Cd, Pb among others). [29]
Non-volatile heavy metals are bound in the solid phase by more than 99 percent [12, 19], for example in clinker. Due to of different gas and dust treatment facilities (for example, bag filter or ESP) and/or separation processes (for example chlorine bypass) operated in the cement industry, there is generally no exact connection between input fuel concentrations and emission level of most heavy metals. [29]
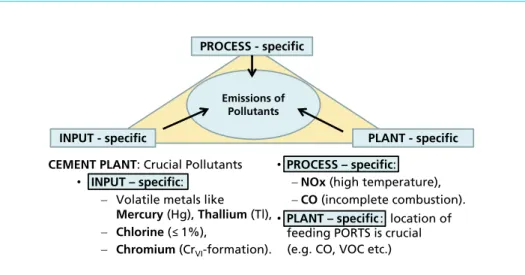
As shown in Figure 10, the emission of pollutants by co-incineration plants like cement kiln can be related to the input materials, the process conditions and the plant itself.
To minimize negative impacts on environment, legal control regimes are defined for co-incineration plants.
CEMENT PLANT: Crucial Pollutants
• INPUT – specific:
Volatile metals like Mercury (Hg), Thallium (Tl), Chlorine (≤1%),
Chromium (CrVI-formation).
Emissions of Pollutants
INPUT - specific PLANT - specific
PROCESS - specific
• PROCESS – specific:
NOx (high temperature), CO (incomplete combustion).
• PLANT – specific: location of feeding PORTS is crucial (e.g. CO, VOC etc.)
Figure 10: Emissions of pollutants during co-incineration in cement kiln and their dependences
Source: Lorber, K. E.; Sarc, R.: Status and Development of Waste to Energy (WtE) in Austria. In: Nelles, M.; Wu, K.; Cai, J.; Jay Cheng, J. (eds.): Proceedings of the 6th International Conference on Environmental Technology and Knowledge Transfer (ICET).
Hefei, P. R. China, May 19-20, 2016. ISBN: 978-3-86009-431-0
As shown in Table 2, the emission limit values for cement plants, laid down in the European Union Industrial Emissions Directive (IED) [17] as well as in the Austrian WIO [3], follow closely the Best Available Technique (BAT) rules for cement industry [15]. Using RDF in the cement industry has become BAT status already in 2010 [18].
Another precondition to be fulfilled for the utilization of RDF in the clinker process is, that no negative quality changes in the product itself are allowed, since the cement quality is strictly defined by standard EN 197-1:2011 [1].
Additionally, each country is free to define additional criteria, including limit values for other emissions, such as carbon monoxide or ammonia, in case, new (innovative) treatment methods for off-gas are installed. [29]
Flue Gas Treatment Table 2: Emission limit values for co-incineration plant, i.e. cement industry
Parameter Unit BAT-Cement1 WID-EU2 IED3 WIO4
BAT-AEL range O2 content = 10 %
Total dust mg Nm-3 < 10 – < 20 30 30 20
HCI mg Nm-3 < 10 10 10 10
HF mg Nm-3 <1 1 1 0.7
NOX (preheater kilns) mg Nm-3 < 100 – 350 800 (existing) 500 800 (existing) NOX (Lepol and long kilns) mg Nm-3 200 – 500 500 (new) < 800 500 (new)
Hg mg Nm-3 < 0.05 0.05 0.05 0.05
Σ (Cd + TI) mg Nm-3 < 0.05 0.05 0.05 0.05 Σ (Sb + As + Pb + Cr +
Co + Cu + Mn + Ni + V) mg Nm-3 < 0.5 0.5 0.5 0.5 Dioxins + Furans ng TE Nm-3 < 0.05 – 0.1 0.1 0.1 0.1
SO2 mg Nm-3 < 50 – < 400 50 50 50
Total organic carbon mg Nm-3 < 10 – < 30 10 10 10
BAT = Best Available Technique (EU); WID = Waste Incineration Directive (EU); IED = Industrial Emissions Directive (EU); WIO = Waste Incineration Ordinance (AT); BATAEL = BAT – Associated Emission Levels
Sources:
1 European Commission (ed.): Best Available Techniques (BAT) Reference Document for the Production of Cement, Lime and Magnesium Oxide. Reference Report by the Joint Research Centre of the European Commission. Seville, 2013
2 European Commission (ed.): Directive 2000/76/EC of the European Parliament and of the council of 4th December 2000 on the incineration of waste. Brussels, Belgium: European Commission, 2000
3 European Commission (ed.): Directive 2010/75/EU of the European Parliament and of the council of 24th November 2010 on industrial emissions (integrated pollution prevention and control). Brussels, Belgium: European Commission, 2010
4 BMLFUW: Verordnung des Bundesministers für Land- und Forstwirtschaft, Umwelt und Wasserwirtschaft und des Bundes- ministers für Wirtschaft, Familie und Jugend über die Verbrennung von Abfällen (Abfallverbrennungsverordnung – AVV) (Waste Incineration Ordinance (WIO)). StF: BGBl. II Nr. 389/2002, 2002
2.1. Selected real data on measured emissions from austrian cement plants
Directive 2010/75/EC on industrial emissions stipulates in Article 55 that for waste incineration plants or waste co-incineration plants with a nominal capacity of two ton- nes per hour, a report on the functioning and monitoring of the plant has to be made available to the public annually [17]. Austria has implemented the Directive on Indus- trial Emissions with an amendment of the Waste Incineration Ordinance [3].
In Austria, the responsible authority for issuing the report is the Ministry for Agri- culture, Forestry, Environment and Water Management (BMLFUW). Cement plants, which use RDF, are classified as co-incineration plants and are thus included in the report. Provided information includes among others the level of emissions into the air. Some of the emissions have to be measured continuously (such as dust, organic carbon, mercury and nitrogen oxide), others discontinuously (such as cadmium and thallium as well as PCDD/F). Under certain conditions, mercury may be measured discontinuously, as well. Limit values are fixed for half-hourly average or daily average, while measured values are presented as monthly average. Thus, limit values cannot be directly compared to measured values. Selected results from off-gas measurements for four co-incineration plants routinely using RDF for reaching high TSR are summarized and presented in following Figures 11, 12, 13, 14, 15 and 16. [10]
Flue Gas Treatment
Max. MMV*
mg/Nm3
0 10 20 30 40 50 60 70 80
2009 2010 2011 2012 2013 2014 2015
* MMV = monthly mean value
Lafarge cement plant Mannersdorf Lafarge cement plant Retznei Cement plant Hatschek Cement plant Leube
Figure 12: Development of organic carbon emissions from four Austrian cement kilns, period 2009 to 2015 (measured continuously)
Source: BMLFUW (ed.): Bericht des Bundesministers für Land- und Forstwirtschaft, Umwelt und Wasserwirtschaft über Verbrennungs- und Mitverbrennungsanlagen gemäß § 18 AVV – Berichtszeitraum 2009; 2010; 2011; 2012; 2013; 2014; 2015 (Report of the Federal Ministry of Agriculture and Forestry, the Environment and Water Management on Incineration and Co-Incineration plants according to the Article 18 of the Waste Incineration Ordinance). Vienna, Austria, 2011; 2012; 2013;
2014; 2015; 2016; 2017 0 5 10 15 20 25 30
2008 2009 2010 2011 2012 2013 2014 2015 2016
Max. MMV*
mg/Nm3
* MMV = monthly mean value
Lafarge cement plant Mannersdorf Lafarge cement plant Retznei
Cement plant Hatschek Cement plant Leube
Figure 11: Development of dust emissions from four Austrian cement kilns, period 2009 to 2015 (measured continuously)
Source: BMLFUW (ed.): Bericht des Bundesministers für Land- und Forstwirtschaft, Umwelt und Wasserwirtschaft über Verbrennungs- und Mitverbrennungsanlagen gemäß § 18 AVV – Berichtszeitraum 2009; 2010; 2011; 2012; 2013; 2014; 2015 (Report of the Federal Ministry of Agriculture and Forestry, the Environment and Water Management on Incineration and Co-Incineration plants according to the Article 18 of the Waste Incineration Ordinance). Vienna, Austria, 2011; 2012; 2013;
2014; 2015; 2016; 2017
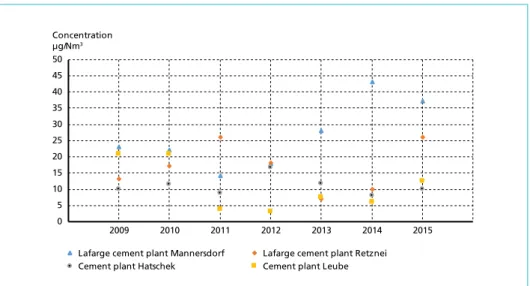
Flue Gas Treatment Figure 13: Development of mercury emissions from four Austrian cement kilns, period 2009 to
2015 (measured partly continuously and partly discontinuously)
Source: BMLFUW (ed.): Bericht des Bundesministers für Land- und Forstwirtschaft, Umwelt und Wasserwirtschaft über Verbrennungs- und Mitverbrennungsanlagen gemäß § 18 AVV – Berichtszeitraum 2009; 2010; 2011; 2012; 2013; 2014; 2015 (Report of the Federal Ministry of Agriculture and Forestry, the Environment and Water Management on Incineration and Co-Incineration plants according to the Article 18 of the Waste Incineration Ordinance). Vienna, Austria, 2011; 2012; 2013;
2014; 2015; 2016; 2017 0 5 10 15 20 25 30 35 40 45 50
2009 2010 2011 2012 2013 2014 2015
Concentration µg/Nm3
Lafarge cement plant Mannersdorf Lafarge cement plant Retznei Cement plant Hatschek Cement plant Leube
0 100 200 300 400 500 600
2008 2009 2010 2011 2012 2013 2014 2015
Lafarge cement plant Mannersdorf Lafarge cement plant Retznei Cement plant Hatschek Cement plant Leube Concentration
mg/Nm3
Figure 14: Development of nitrogen oxide emissions from four Austrian cement kilns, period 2009 to 2015 (measured continuously)
Source: BMLFUW (ed.): Bericht des Bundesministers für Land- und Forstwirtschaft, Umwelt und Wasserwirtschaft über Verbrennungs- und Mitverbrennungsanlagen gemäß § 18 AVV – Berichtszeitraum 2009; 2010; 2011; 2012; 2013; 2014; 2015 (Report of the Federal Ministry of Agriculture and Forestry, the Environment and Water Management on Incineration and Co-Incineration plants according to the Article 18 of the Waste Incineration Ordinance). Vienna, Austria, 2011; 2012; 2013;
2014; 2015; 2016; 2017
Flue Gas Treatment
Figure 15: Development of cadmium and thallium emissions from four Austrian cement kilns, period 2009 to 2015 (measured discontinuously)
Source: BMLFUW (ed.): Bericht des Bundesministers für Land- und Forstwirtschaft, Umwelt und Wasserwirtschaft über Verbrennungs- und Mitverbrennungsanlagen gemäß § 18 AVV – Berichtszeitraum 2009; 2010; 2011; 2012; 2013; 2014; 2015 (Report of the Federal Ministry of Agriculture and Forestry, the Environment and Water Management on Incineration and Co-Incineration plants according to the Article 18 of the Waste Incineration Ordinance). Vienna, Austria, 2011; 2012; 2013;
2014; 2015; 2016; 2017 0 0.5 1.0 1.5 2.0 2.5 3.0 3.5 4.0 4.5 5.0
2008 2009 2010 2011 2012 2013 2014 2015 2016
Lafarge cement plant Retznei Cement plant Hatschek Cement plant Leube Concentration
µg/Nm3
Lafarge cement plant Mannersdorf
Figure 16: Development of dioxins and furans emissions from four Austrian cement kilns, period 2009 to 2015 (measured discontinuously)
Source: BMLFUW (ed.): Bericht des Bundesministers für Land- und Forstwirtschaft, Umwelt und Wasserwirtschaft über Verbrennungs- und Mitverbrennungsanlagen gemäß § 18 AVV – Berichtszeitraum 2009; 2010; 2011; 2012; 2013; 2014; 2015 (Report of the Federal Ministry of Agriculture and Forestry, the Environment and Water Management on Incineration and Co-Incineration plants according to the Article 18 of the Waste Incineration Ordinance). Vienna, Austria, 2011; 2012; 2013;
2014; 2015; 2016; 2017 0 0.005 0.010 0.015 0.020 0.025 0.030 0.035 0.040 0.045
2008 2009 2010 2011 2012 2013 2014 2015
Lafarge cement plant Mannersdorf Lafarge cement plant Retznei Cement plant Hatschek Cement plant Leube Concentration
µg/Nm3
Flue Gas Treatment
2.2. Comparison of specific CO
2emissions at international level
548 623 645
806
0 100 200
Austria
Morocco+Algeria+Tunisia Poland
Brazil India
Germany Italy
EU 28 Czech Republic
France Global
China+Korea+Japan Philippines
Spain Thailand
Egypt
United Kingdom Canada USA 300
400 500 600 700 800 900 kg CO2/ t cement equivalents
Data for year 2014
Hard coal:
96 kg CO2/GJ Natural gas:
56 kg CO2/GJ
Total fuel mix in 2015:
67 kg CO2/GJ Alternative fuel mix in 2015:
59 kg CO2/GJ 30
1997 1998 1999 2000 2001 2002 2003 2003 2005 2006 2007 2008 2009 2010 2011 2012 2013 2014 2015 40
50 60 70 80 90 100
CO2 Emission factor kg/GJ
Figure 17: Specific CO2 emissions [kgCO2/t] for cement production in an international comparison
Source: Papsch, F.; Spaun, S.: Ressourcenschonung in der österreichischen Zementindustrie [Conservation of natural resources in the Austrian cement industry]. In: Österreichische Ingenieur- und Architekten-Zeitschrift, 161. Jg., Heft 1-12/2016, 2016
Figure 18: CO2 emission factor [kgCO2 fossil/t] for the fuel mix of Austrian cement industry
Source: Papsch, F.; Spaun, S.: Ressourcenschonung in der österreichischen Zementindustrie [Conservation of natural resources in the Austrian cement industry]. In: Österreichische Ingenieur- und Architekten-Zeitschrift, 161. Jg., Heft 1-12/2016, 2016
Flue Gas Treatment
On a global level, the production of cement causes approximately 5 percent of CO2 emis- sions. Since 1990, which is the base year of the Kyoto Protocol, Austrian CO2 emissions for cement production were successfully reduced by 17 percent. Consequently, Austria has the lowest specific CO2 emissions per tonne of produced cement on international context, i.e. 548 kg CO2/t (data for 2014), compare Figure 17. The average specific emission value (in [kg CO2/t]) for EU 28 is 623, at the global level 645 and the highest one is 806 for cement plants in the USA. [26]
As mentioned before, Austrian TSR was 76.1 percent in 2015 and such high TSR is one of the main strategies to reach efficient CO2-fossil emission reduction. RDF contain a certain percentage of biogenic carbon, which in the balance is not counted as being relevant for climate change. Figure 18 shows that RDF has approximately the same or at least a comparable CO2 (fossil) emission factor as natural gas and the total fuel mix of conventional and alternative fuels used in cement plants is far below the values that are reported for hard coal. [26]
3. Innovative technical solutions for reduction of waste fuel specific emissions
In this section, two newly developed pollution abatement systems for retrofitting and adaption of existing cement plants are reported, concerning mercury in the precipitated filter dust and organic pollutants (CO, VOC, PCDD/F, odours and others) as well as nitrogen oxide and ammonia in the off-gas [21].
As mentioned before, in the last couple of years, the substitution of conventional fossil fuels by waste fuels (SRF or RDF) in the cement industry has developed to an important tool in energy conservation as well as waste management. In Austria, about 76.1 percent (2015) of thermal energy and 14 percent (2014; data for EU 28: 3.8 percent) of input material (raw meal and additives) used in the clinker process in the meanwhile are supplied by recovered waste materials. [26]
As the material stream (in other words raw meal, clinker) passes different temperature zones from the raw meal mill or the raw gas filter all the way down to the rotary kiln outlet (that is the primary burner) in counter current arrangement to the gas stream, volatilization (or vaporization) processes are taking place followed by condensation on colder parts of the plant. As shown in Figure 19, for volatile elements like mercury, thallium , sodium, chlorine etc. internal (between different preheater cyclone stages) and external cycles (between preheater cyclones and raw dust filter) can be formed during the pyro-process, resulting in unwanted enrichment due to accumulation of these compounds (in other words permanent input but no output). Hence, as already mentioned before, the proper selection of feeding ports for raw material and fuel is crucial for smooth plant operation. Finally, these vicious cycles, causing enrichment of unwanted compounds in the process, are resulting in higher stack emissions. [21]
Flue Gas Treatment Figure 19:
Internal and external cycles of volatile elements in the clinker process.
Kiln feed
Stack
BH catch
Sorbing Raw mill feed
Coal mill Stripping
90°C
Exhaust
1,000°C
Fuel Feedstocks
Dustremoval
330°C
Fuels from kiln and precalciner Recycling
Particle-bound Hg Gas-phase Hg Hg input & output
Sources:
Lorber, K. E.; Wruss, K.; Sarc, R.; Pomberger, R.: Durch den Aufgabeort bedingte Immissionen beim Einsatz alternativer Roh- und Brennstoffe im Zementwerk [Ambient air concentrations of pollutants caused by waste fuels charged at different ports of a cement plant]. In: Thomé-Kozmiensky, K.J.; Löschau, M. (eds.): Immissionsschutz, Volume 5. Neuruppin: TK Verlag Karl Thomé-Kozmiensky, 2015; ISBN: 978-3-944310-23-7
Sikkema, J.K.: Fate and transport of mercury in portland cement manufacturing facilities. Graduate Theses and Dissertations.
Paper 11907, 2011
Willitsch, F.; Reinhold, H.: Exmercury – Splitted Preheater System – A new Solution for Emission Reduction in the Cement Industry. 2015; Online: www.atec-greco.com, www.scheuch.com, www.wup.at
To control the emissions of waste fuel operated cement plants efficiently, the installation of innovative pollution abatement systems are demanded by society and authorities.
3.1. Exmercury splitted preheater system
In the clinker process, the collected kiln filter dust (about 5 to 7 t/h) is usually recy- cled as valuable raw material at the raw meal mill, leading to unwanted enrichment of volatile elements like mercury and thallium in the process and finally to enhanced stack emissions into environment, cf. Figure 20. [21]
As shown in Figure 20, in the described new exmercury reduction system recently installed and operated in the cement plant of the w&p Zement GmbH in Wietersdorf (Austria), kiln filter dust (5 to 7 t/h) with accumulated mercury is withdrawn and is led to a mercury volatilization reactor where at 350 to 400 °C mercury is stripped off in the hot partial gas stream (3 to 5 vol.-%) taken from heat exchanger cyclone 5. The hot kiln filter dust, now free of mercury, is separated by several cyclones followed by a ceramic cartridge filter and returns into the process via preheater cyclone 3. The particle free mercury loaded gas stream is rapidly quenched by water injection, and adsorbent (that is hearth furnace coke) is added for separation of mercury on bag filters. After several cycles, spent adsorbent (50 kg/d) is removed for disposal. Finally, the mercury free gas is added to the main gas stream prior to raw meal mill. [20, 21]
Flue Gas Treatment
Hg adsorbed on filter dust (5-7 t/h) Cyclone Battery
Adsorbent (Ca(OH)2, Coke) dosing
Bag Filter
Spent Coke Adsorbent (50 kg/d)
Clean Gas stream back to Raw Meal Mill Ceramic Filter Quenching
Hg-Evaporation Reactor (350 – 400°C)
Heat Exchanger Cyclone #5 (3-5 Vol.-%)
Figure 20: Exmercury splitted preheater system for reduction of mercury emissions from cement plants
Sources:
Kern, S.; Salzer, F.; Reinhold, H.: Breaking the mercury cycle for emission abatement with the Ex Mercury – Splitted Preheater System. In: Zement Kalk Gips 9, 2015, p. 38-44 (www.zkg.de)
Lorber, K. E.; Wruss, K.; Sarc, R.; Pomberger, R.: Durch den Aufgabeort bedingte Immissionen beim Einsatz alternativer Roh- und Brennstoffe im Zementwerk [Ambient air concentrations of pollutants caused by waste fuels charged at different ports of a cement plant]. In: Thomé-Kozmiensky, K.J.; Löschau, M. (eds.): Immissionsschutz, Volume 5. Neuruppin: TK Verlag Karl Thomé-Kozmiensky, 2015; ISBN: 978-3-944310-23-7
Willitsch, F.; Reinhold, H.: Exmercury – Splitted Preheater System – A new Solution for Emission Reduction in the Cement Industry. 2015; Online: www.atec-greco.com, www.scheuch.com, www.wup.at
For the full-scale pilot project described, reported removal efficiency for particulated Hg is more than 90 percent and the mercury emissions at the stack can be reduced up to 80 percent, so that the stack emission limit < 30 µg/Nm3 (measured data average:
10 µg/Nm3) can be reached safely. As the removed kiln filter dust is heated up and returns hot to the pyro-process afterwards, the described new mercury with drawing technique does not significantly increase energy consumption of the precalciner system.
Additionally, there is no extra manpower required to operate the exmercury splitted preheater system. [24, 27, 32]
3.2. CTP-off-gas treatment system
NOx-emissions can be reduced by well-established air pollution control technologies (like selective catalytic reduction – SCR and selective non-catalytic reduction – SNCR).
Organic pollutants and odours efficiently can be treated in off-gas of cement plants by a newly developed RTO system, optionally equipped with SCR or SNCR. The RTO consists of the following major components: main fan, inlet and outlet ducts with valves,
Flue Gas Treatment
reactor (consisting of heat exchanger and combustion chamber) and burner system.
In the reported new off-gas treatment system, the filtered off-gas gets preheated in the lower part of ceramic heat exchanger beds and is then directed into the SCR-stage, where nitrogen oxide is catalytically reduced by ammonia-injection. The off-gas is then further heated up to 880 to 930 °C in the upper part of the ceramic heat exchanger, where organic pollutants and CO are thermally converted to CO2 and H2O. [2, 13, 21]
When leaving the combustion chamber through the upper and then lower section of the ceramic heat exchanger beds, heat is reclaimed from the off-gas. For the described CTP-off-gas treatment system (Figure 21), reduction of stack-emissions are repor- ted with more than 95 percent efficiency, when off-gas volumes between 100,000 to 420,000 Nm3/h are treated. [13]
Burner/gas injection
RTO Combustion chamber
High temperature Heat exchanger
Upper flow distribution zone
Low temperature Heat exchanger
SCR catalyst
Lower flow distribution zone
Waste gas from raw mill and dryers NH3
Figure 21: CTP-Off-Gas Treatment System for the simultaneous reduction of organic (CO, TOC, PCDD/F, odours) pollutants and NOX in cement plant
Source: Chemisch Thermische Prozesstechnik GmbH (CTP): Cement Industry – Innovative Solution in Air Pollution Control.
In: www.ctp-airpollutioncontrol.com, 2015
Flue Gas Treatment
In the cement plant of the Wopfinger Baustoffindustrie GmbH in Wopfing (Austria), RTO technology is designed and operated for 218,000 Nm3/h of raw gas. Additionally, an SNCR system for reduction of NOx-emissions in the combustion chamber is inte- grated in the RTO technology. The RTO has been operating for almost five years with very high availabilities and provides an abatement rate for CO and organic compounds of about 99 percent. In the integrated SNCR system, NOx-reduction rate of more than 50 percent have been reached. Additionally, the increase of CO-concentration and con- centration of organic compounds in the raw gas (in other words before RTO system) allows the RTO to be operated in autothermal mode, which means that the RTO does not require any additional fuel. [2]
4. Conclusions
Current world-wide production of cement is well above 4,500 million tonnes per year.
Europe’s share at the world market has decreased from 15 percent in 2001 to 5 percent in 2015. In cement industry, primary and secondary raw materials as well as conven- tional fossil and waste fuels are used for production of clinker. In 2014, 3.8 percent (in the EU-28) and even 14 percent (in Austria) of input material (raw meal and additi- ves) used in the clinker process are supplied by recovered waste materials. Utilization of secondary or alternative waste fuels (for example RDF including SRF) for energy recovery (in other words thermal substitution) has become state of the art. In total, about 10,510,000 t RDF have been utilized for energy recovery in the EU-28 in 2014, corresponding to the average TSR of 41 percent which is well above the worldwide‘s score of 16 percent. In Austria, about 493,329 t/y of RDF were used in Austrian cement industry, corresponding to a TSR of about 76.1 percent in 2015.
De Beer et al. [14] conclude in their study that the potential benefits of further increase of TSR (compare Figure 2) in cement industry can be expressed by four key perfor- mance indicators. Calculations for scenario with 60 percent TSR in all EU 28 Member States show that 26 million tonnes of CO2 emissions would be avoided, 15.7 million tonnes of waste would be processed, 11.1 million tonnes of coal equivalent would be saved and 12.2 billion Euro of investment in dedicated waste-to-energy plants would be avoided simultaneously.
Clinker burning process is a pyro-chemical procedure where the temperature dis- tribution of gas and solids inside the cement plant covers a wide range (about 100 to 2,000 °C). Therefore, different feeding ports should be used to charge various types of fuels into the kiln. Finally, the way of feeding fuel into the kiln is crucial, as this can have a direct effect on the resulting emissions. Emission of pollutants by co-incineration plants like cement kiln can be related to the input materials, the process conditions and the plant itself.
Real data presented on measured emissions (dust, organic carbon, mercury, nitrogen oxide, cadmium and thallium as well as dioxins and furans) from selected Austrian cement plants show that limit values can be met, but real measured values sometimes undergo major fluctuations.
Flue Gas Treatment
To reduce emissions of waste fuel operated cement plants further, the installation of innovative pollution abatement systems seems to be the next technological development step in the cement industry. Actual examples from Austria show that the new innovative technology exmercury splitted preheater system for reduction of mercury emissions in the precipitated filter dust has successfully completed the testing phase, and achieved results are very positive for the observed operating period. The same conclusion also applies for the CTP-regenerative thermal oxidation which is operated for efficient treat- ment of organic pollutants and odours in off gas. Finally, it seems to be only a question of time, when these new innovative technologies will become international state of the art in the cement industry when using waste fuel.
5. References
[1] Austrian Standards Institute (ASI): Cement-Part 1: Composition, specifications and conformity criteria for common cement, EN 197-1. Vienna, Austria, 2011
[2] Binninger, T.; Schulze, K.: Regenerative thermal oxidation in the cement industry – technology and operation. In: Thomé-Kozmiensky, K. J.; Thiel, S. (eds.): Waste Management, Volume 6.
Neuruppin: TK Verlag Karl Thomé-Kozmiensky, 2016; ISBN 978-3-944310-29-9
[3] BMLFUW: Verordnung des Bundesministers für Land- und Forstwirtschaft, Umwelt und Was- serwirtschaft und des Bundesministers für Wirtschaft, Familie und Jugend über die Verbrennung von Abfällen (Abfallverbrennungsverordnung – AVV) [Waste Incineration Ordinance (WIO)].
StF: BGBl. II Nr. 389/2002, 2002
[4] BMLFUW (ed.): Bericht des Bundesministers für Land- und Forstwirtschaft, Umwelt und Was- serwirtschaft über Verbrennungs- und Mitverbrennungsanlagen gemäß § 18 AVV – Berichts- zeitraum 2009 (Report of the Federal Ministry of Agriculture and Forestry, the Environment and Water Management on Incineration and Co-Incineration plants according to the Article 18 of the Waste Incineration Ordinance). Vienna, Austria, 2011
[5] BMLFUW (ed.): Bericht des Bundesministers für Land- und Forstwirtschaft, Umwelt und Was- serwirtschaft über Verbrennungs- und Mitverbrennungsanlagen gemäß § 18 AVV – Berichts- zeitraum 2010 (Report of the Federal Ministry of Agriculture and Forestry, the Environment and Water Management on Incineration and Co-Incineration plants according to the Article 18 of the Waste Incineration Ordinance). Vienna, Austria, 2012
[6] BMLFUW (ed.): Bericht des Bundesministers für Land- und Forstwirtschaft, Umwelt und Was- serwirtschaft über Verbrennungs- und Mitverbrennungsanlagen gemäß § 18 AVV – Berichts- zeitraum 2011 (Report of the Federal Ministry of Agriculture and Forestry, the Environment and Water Management on Incineration and Co-Incineration plants according to the Article 18 of the Waste Incineration Ordinance). Vienna, Austria, 2013
[7] BMLFUW (ed.): Bericht des Bundesministers für Land- und Forstwirtschaft, Umwelt und Was- serwirtschaft über Verbrennungs- und Mitverbrennungsanlagen gemäß § 18 AVV – Berichts- zeitraum 2012 (Report of the Federal Ministry of Agriculture and Forestry, the Environment and Water Management on Incineration and Co-Incineration plants according to the Article 18 of the Waste Incineration Ordinance). Vienna, Austria, 2014
[8] BMLFUW (ed.): Bericht des Bundesministers für Land- und Forstwirtschaft, Umwelt und Was- serwirtschaft über Verbrennungs- und Mitverbrennungsanlagen gemäß § 18 AVV – Berichts- zeitraum 2013 (Report of the Federal Ministry of Agriculture and Forestry, the Environment and Water Management on Incineration and Co-Incineration plants according to the Article 18 of the Waste Incineration Ordinance). Vienna, Austria, 2015
[9] BMLFUW (ed.): Bericht des Bundesministers für Land- und Forstwirtschaft, Umwelt und Was- serwirtschaft über Verbrennungs- und Mitverbrennungsanlagen gemäß § 18 AVV – Berichts- zeitraum 2014 (Report of the Federal Ministry of Agriculture and Forestry, the Environment and Water Management on Incineration and Co-Incineration plants according to the Article 18 of the Waste Incineration Ordinance). Vienna, Austria, 2016
Flue Gas Treatment
[10] BMLFUW (ed.): Bericht des Bundesministers für Land- und Forstwirtschaft, Umwelt und Was- serwirtschaft über Verbrennungs- und Mitverbrennungsanlagen gemäß § 18 AVV – Berichts- zeitraum 2015 (Report of the Federal Ministry of Agriculture and Forestry, the Environment and Water Management on Incineration and Co-Incineration plants according to the Article 18 of the Waste Incineration Ordinance). Vienna, Austria, 2017
[11] Brown, M.: Refuse Derived Fuel – A European Market Heading for Overcapacity. In: Thomé- Kozmiensky, K.; Thiel, S. (eds.): Waste Management, Volume 6. Neuruppin: TK Verlag Karl Thomé-Kozmiensky, 2016. ISBN: 978-3-944310-29-9
[12] BZL & DPU (BZL Kommunikation und Projektsteuerung GmbH/DPU-Deutsche Projekt Union GmbH) (eds.): Abschlussbericht-Anforderungen an Ersatzbrennstoffe aus Abfällen für die Zementindustrie (Final report-Requirements on Refuse Derived Fuels from Waste for the Cement Industry). Im Auftrag von Ministerium für Umwelt und Verkehr des Landes Baden- Württemberg. Oyten, 2000
[13] Chemisch Thermische Prozesstechnik GmbH (CTP): Cement Industry – Innovative Solution in Air Pollution Control. In: www.ctp-airpollutioncontrol.com, 2015
[14] De Beer, J.; Cihlar, J.; Hensing, I.; Zabeti, M.: Status and prospects of co-processing of waste in EU cement plants. Ecofys – A Navigant Company. 2017; Online: https://cembureau.eu/me- dia/1612/2017-05-11_ecofys_publication_alternativefuels_report.pdf
[15] European Commission (ed.): Best Available Techniques (BAT) Reference Document for the Production of Cement, Lime and Magnesium Oxide. Reference Report by the Joint Research Centre of the European Commission. Seville, 2013
[16] European Commission (ed.): Directive 2000/76/EC of the European Parliament and of the coun- cil of December 4th, 2000 on the incineration of waste. Brussels, Belgium: European Commission, 2000
[17] European Commission (ed.): Directive 2010/75/EU of the European Parliament and of the coun- cil of 24th November 2010 on industrial emissions (integrated pollution prevention and control).
Brussels, Belgium: European Commission, 2010
[18] European Commission (ed.): Reference document on best available techniques in the cement, lime and magnesium oxide manufacturing industries. Brussels: European Commission (EC), 2010
[19] Genon, G.; Brizio, E.: Perspectives and limits for cement kilns as a destination for RDF. In: El- sevier, Waste Management 28, 2008, p. 2375-2385. Available online at www.sciencedirect.com [20] Kern, S.; Salzer, F.; Reinhold, H.: Breaking the mercury cycle for emission abatement with the
Ex Mercury – Splitted Preheater System. In: Zement Kalk Gips 9, 2015, p. 38-44 (www.zkg.de) [21] Lorber, K. E.; Sarc, R.: Innovative Pollution Abatement Systems for Waste Fuel operated Cement
Kiln. In: Gidarakos, E.; Cossu, R.; Stegmann, R. (eds.): Crete 2016 – 4th International Confe- rence on Industrial and Hazardous Waste Management. Executive Summaries. Crete, September 27 to 30, 2016. ISBN: 978-960-8475-24-3
[22] Lorber, K. E.; Sarc, R.: Special Waste to Energy (WtE). Lecture Course at 4th International Conference on Industrial and Hazardous Waste Management. Crete, September 27 to 30, 2016 [23] Lorber, K. E.; Sarc, R.: Status and Development of Waste to Energy (WtE) in Austria. In: Nelles, M.; Wu, K.; Cai, J.; Jay Cheng, J. (eds.): Proceedings of the 6th International Conference on Environmental Technology and Knowledge Transfer (ICET). Hefei, P. R. China, May 19- to 20, 2016. ISBN: 978-3-86009-431-0
[24] Lorber, K. E.; Wruss, K.; Sarc, R.; Pomberger, R.: Durch den Aufgabeort bedingte Immissionen beim Einsatz alternativer Roh- und Brennstoffe im Zementwerk (Ambient air concentrations of pollutants caused by waste fuels charged at different ports of a cement plant). In: Thomé- Kozmiensky, K.J.; Löschau, M. (eds.): Immissionsschutz, Volume 5. Neuruppin: TK Verlag Karl Thomé-Kozmiensky, 2015; ISBN: 978-3-944310-23-7