Article
Mitochondria Targeting with Luminescent Rhenium(I) Complexes
Joanna Skiba1, Tytus Berna´s2, Damian Trzybi ´nski3, Krzysztof Wo´zniak3, Giarita Ferraro4, Daniela Marasco5,6,7, Antonello Merlino4,7, Marsel Z. Shafikov8,9, Rafał Czerwieniec9,10,* and Konrad Kowalski1,*
1 Faculty of Chemistry, Department of Organic Chemistry, University of Łód´z, Tamka 12, 91-403 Łód´z, Poland;
asiaskiba@02.pl
2 Nencki Institute of Experimental Biology, Polish Academy of Sciences, ul. Pasteura 3, 02-093 Warszawa, Poland; t.bernas@nencki.gov.pl
3 Faculty of Chemistry, Biological and Chemical Research Centre, University of Warsaw, ˙Zwirki i Wigury 101, 02-089 Warszawa, Poland; trzybinski@chem.uw.edu.pl (D.T.); kwozniak@chem.uw.edu.pl (K.W.)
4 Department of Chemical Sciences, University of Naples Federico II, Complesso Univ. di Monte Sant’ Angelo, Via Cintia, I-80126 Napoli, Italy; giarita.ferraro@unina.it (G.F.); antonello.merlino@unina.it (A.M.)
5 Department of Pharmacy, University of Naples Federico II, Via Mezzocannone 16, 80134 Napoli, Italy;
daniela.marasco@unina.it
6 CIRPEB: Centro Interuniversitario di Ricerca sui Peptidi Bioattivi, Via Mezzocannone 16, I-80134 Napoli, Italy
7 CNR Institute of Biostructures and Bioimages, Via Mezzocannone 16, I-80134 Napoli, Italy
8 Department of Technology of Organic Synthesis, Institute of Chemical Engineering, Ural Federal University, 19 Mira Str., 620002 Ekaterinburg, Russia; shafikoff@gmail.com
9 Institut für Physikalische und Theoretische Chemie, Universität Regensburg, Universitätsstraße 31, D-93040 Regensburg, Germany
10 Lehrstuhl für Anorganische Chemie I, University of Bayreuth, D-95440 Bayreuth, Germany
* Correspondence: Rafal.Czerwieniec@uni-bayreuth.de (R.C.); kondor15@wp.pl (K.K.);
Tel.: +48-42-635-5759 (K.K.) Academic Editor: Roman Dembinski
Received: 19 April 2017; Accepted: 11 May 2017; Published: 15 May 2017
Abstract:Two new neutralfac-[Re(CO)3(phen)L] compounds (1,2), with phen = 1,10-phenanthroline and L = O2C(CH2)5CH3 or O2C(CH2)4C≡CH, were synthetized in one-pot procedures from fac-[Re(CO)3(phen)Cl] and the corresponding carboxylic acids, and were fully characterized by IR and UV-Vis absorption spectroscopy,1H- and13C-NMR, mass spectrometry and X-ray crystallography.
The compounds, which display orange luminescence, were used as probes for living cancer HeLa cell staining. Confocal microscopy revealed accumulation of both dyes in mitochondria. To investigate the mechanism of mitochondrial staining, a new non-emissive compound,fac-[Re(CO)3(phen)L], with L = O2C(CH2)3((C5H5)Fe(C5H4), i.e., containing a ferrocenyl moiety, was synthetized and characterized (3). 3 shows the same mitochondrial accumulation pattern as1 and2. Emission of 3can only be possible when ferrocene-containing ligand dissociates from the metal center to produce a species containing the luminescentfac[Re(CO)3(phen)]+core. The release of ligands from the Re center was verified in vitro through the conjugation with model proteins. These findings suggest that the mitochondria accumulation of compounds1–3is due to the formation of luminescent fac-[Re(CO)3(phen)]+products, which react with cellular matrix molecules giving secondary products and are uptaken into the negatively charged mitochondrial membranes. Thus, reported compounds feature a rare dissociation-driven mechanism of action with great potential for biological applications.
Keywords:bioorganometallics; rhenium complexes; ferrocene; confocal microscopy; luminescence;
mitochondria staining; phototoxicity
Molecules2017,22, 809; doi:10.3390/molecules22050809 www.mdpi.com/journal/molecules
1. Introduction
Luminescent transition metal complexes have been extensively used in organic light-emitting diodes (OLEDs) [1], as optical sensors [2], and in solar cell materials [3]. Over the last decade, this class of materials has attracted an increased attention as luminescent [4–13] and vibrational- luminescent [14] probes for bioimaging. In particular, fac-[Re(CO)3(N∧N)L] (N∧N = aromatic diimine and L = ancillary ligand) complexes have been investigated for bioimaging applications [4,13].
Upon photoexcitation,fac-[Re(CO)3(N∧N)L] complexes display green to orange phosphorescence stemming from triplet metal-to-ligand charge-transfer (3MLCT) states [15–18]. The emission occurs at much longer wavelengths and with distinctly longer decay times than the cell autofluorescence. Both effects are beneficial for bioimaging applications [5]. Studies on luminescent rhenium complexes have also had a great impact on development of99mTc and186,188Re containing radiopharmaceuticals [13,19].
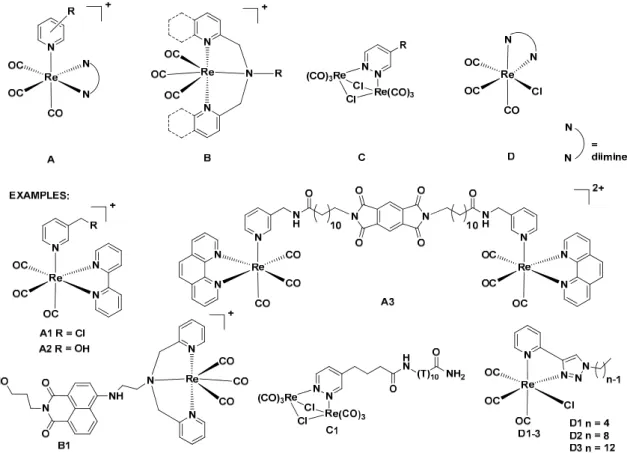
A literature survey shows that four basic classes of luminescent bioprobes withfac-{Re(CO)3} cores can be identified (Figure1A–D).
1. Introduction
Luminescent transition metal complexes have been extensively used in organic light-emitting diodes (OLEDs) [1], as optical sensors [2], and in solar cell materials [3]. Over the last decade, this class of materials has attracted an increased attention as luminescent [4–13] and vibrational- luminescent [14] probes for bioimaging. In particular, fac-[Re(CO)3(N N)L] (N N = aromatic diimine
˄ ˄
and L = ancillary ligand) complexes have been investigated for bioimaging applications [4,13]. Upon photoexcitation, fac-[Re(CO)3(N N)L] complexes display green to orange phosphorescence stemming˄
from triplet metal-to-ligand charge-transfer (3MLCT) states [15–18]. The emission occurs at much longer wavelengths and with distinctly longer decay times than the cell autofluorescence. Both effects are beneficial for bioimaging applications [5]. Studies on luminescent rhenium complexes have also had a great impact on development of 99mTc and 186,188Re containing radiopharmaceuticals [13,19].A literature survey shows that four basic classes of luminescent bioprobes with fac-{Re(CO)3} cores can be identified (Figure 1A–D).
Figure 1. Basic structures of luminescent fac-{Re(CO)3} complexes for cell bioimaging and their examples.
Four basic classes of luminescent bioprobes with fac-{Re(CO)3} cores (A–D).
Most of the research has been focused on cationic complexes (classes A and B in Figure 1) which preferably stain mitochondria [20–23]. Relevant examples of such compounds comprise cationic A1 [20]
and A2 [21] species which stain mitochondria of MCF-7 cells, and dication A3, which accumulates in endoplasmatic retictulum (ER), Golgi apparatus and mitochondria [22]. Staining mechanisms significantly depend on many factors, e.g. probe concentration or ligand reactivity [20,23,24]. For example, it has been found that compound A1 covalently binds to thiol-rich mitochondrial components that allow for efficient accumulation [20]. A remarkable example of class B compounds is the naphthalimide derivative B1 which shows a concentration-dependent pathway of accumulation in cellular compartments. At low concentrations, B1 stains smooth endoplasmic membranes of osteoarthritic cells, while at higher concentrations it rapidly binds to mitochondria membranes [23].
Neutral complexes (classes C and D in Figure 1) have been found to accumulate in nucleus and perinuclear compartments of the cell [24,25]. Dirhenium piridazine complex C1 stain the cytoplasm
Figure 1. Basic structures of luminescent fac-{Re(CO)3} complexes for cell bioimaging and their examples. Four basic classes of luminescent bioprobes with fac-{Re(CO)3} cores (A–D).
Most of the research has been focused on cationic complexes (classesAandBin Figure1) which preferably stain mitochondria [20–23]. Relevant examples of such compounds comprise cationicA1[20]
andA2[21] species which stain mitochondria of MCF-7 cells, and dicationA3, which accumulates in endoplasmatic retictulum (ER), Golgi apparatus and mitochondria [22]. Staining mechanisms significantly depend on many factors, e.g. probe concentration or ligand reactivity [20,23,24].
For example, it has been found that compound A1 covalently binds to thiol-rich mitochondrial components that allow for efficient accumulation [20]. A remarkable example of classBcompounds is the naphthalimide derivativeB1which shows a concentration-dependent pathway of accumulation in cellular compartments. At low concentrations, B1 stains smooth endoplasmic membranes of osteoarthritic cells, while at higher concentrations it rapidly binds to mitochondria membranes [23].
Neutral complexes (classesCandD in Figure 1) have been found to accumulate in nucleus and perinuclear compartments of the cell [24,25]. Dirhenium piridazine complexC1stain the cytoplasm and nucleus [25], and compoundsD1–3stain the perinuclear region of MDA-MB-231 cells [24]. It has been observed that the cellular uptake ofD1–3compounds increases as the alkyl chain length of the ligand increases [24]. Moreover, for several compounds photocytotoxic and/or cytotoxic activity has been observed [26–37].
Herein we report the synthesis and characterization, including X-ray structure analysis, of three new fac-[Re(CO)3(1,10-phenantroline)L] complexes, hereafter called 1–3, with different ancillary ligands: L = heptanoic acid (1), hept-6-ynoic acid (2), and 4-(1-ferrocenyl)-butanoic acid (3), respectively.
Complexes1and2are luminescent, whereas complex3, comprising of a quenching ferrocenyl moiety, does not [38]. Accumulation of1–3in mitochondria is observed for HeLa cells via confocal microscopy.
Upon prolonged laser irradiation,2displays photocytotoxic activity. Comparative analysis of the data collected for the three compounds and results obtained for the adducts of1and3with model proteins enables us to propose a mechanism explaining the molecular basis of the mitochondrial accumulation of1–3.
2. Results and Discussion
2.1. Synthesis of Complexes1–3
A literature survey shows thatfac-[Re(CO)3(phen)L], where phen = 1,10-phenanthroline and L = carboxylate ligand, complexes can be prepared by: (i) reaction offac-[Re(CO)3(phen)X] (with X = Cl or Br) precursor with a silver salt of respective carboxylic acid or fac-[Re(CO)3(phen)CF3SO3] precursor with carboxylic acid [39–41]; (ii) reaction offac-[Re(CO)3(phen)(OH)] complex with ketene or lactide [42]; and (iii) reaction of an aqua [Re(OH2)3(CO)3]+complex with a carboxylate-phenantroline ligand [43]. Our approach toward the synthesis of complexes1,2, and3was carried out according to Scheme1.
Molecules 2017, 22, 809 3 of 17
and nucleus [25], and compounds D1–3 stain the perinuclear region of MDA-MB-231 cells [24]. It has been observed that the cellular uptake of D1–3 compounds increases as the alkyl chain length of the ligand increases [24]. Moreover, for several compounds photocytotoxic and/or cytotoxic activity has been observed [26–37].
Herein we report the synthesis and characterization, including X-ray structure analysis, of three new fac-[Re(CO)3(1,10-phenantroline)L] complexes, hereafter called 1–3, with different ancillary ligands: L = heptanoic acid (1), hept-6-ynoic acid (2), and 4-(1-ferrocenyl)-butanoic acid (3), respectively.
Complexes 1 and 2 are luminescent, whereas complex 3, comprising of a quenching ferrocenyl moiety, does not [38]. Accumulation of 1–3 in mitochondria is observed for HeLa cells via confocal microscopy.
Upon prolonged laser irradiation, 2 displays photocytotoxic activity. Comparative analysis of the data collected for the three compounds and results obtained for the adducts of 1 and 3 with model proteins enables us to propose a mechanism explaining the molecular basis of the mitochondrial accumulation of 1–3.
2. Results and Discussion
2.1. Synthesis of Complexes 1–3
A literature survey shows that fac-[Re(CO)3(phen)L], where phen = 1,10-phenanthroline and L = carboxylate ligand, complexes can be prepared by: (i) reaction of fac-[Re(CO)3(phen)X] (with X = Cl or Br) precursor with a silver salt of respective carboxylic acid or fac-[Re(CO)3(phen)CF3SO3] precursor with carboxylic acid [39–41]; (ii) reaction of fac-[Re(CO)3(phen)(OH)] complex with ketene or lactide [42];
and (iii) reaction of an aqua [Re(OH2)3(CO)3]+ complex with a carboxylate-phenantroline ligand [43]. Our approach toward the synthesis of complexes 1, 2, and 3 was carried out according to Scheme 1.
Scheme 1. Synthesis of complexes 1–3.
We found that the fac-[Re(CO)3(phen)Cl] complex [44] readily reacts with carboxylic acids in THF in the presence of trimethylamine and silver trifluoromethanesulfonate at 70 °C to afford products 1, 2 and 3 in a 95%, 65%, and 48% yield, respectively. The mechanism most probably involves a reaction of the carboxylic anion L− and fac-[Re(CO)3(phen)]+ cation, generated in situ, yielding the target complex. This approach represents a simple one-pot procedure for obtaining carboxylato-Re(CO)3(N-N) complexes. Compounds 1 and 2 are yellow air-stable solids, whereas complex 3 is an orange air-stable solid. The products were characterized by 1H NMR, 13C NMR, IR and UV-Vis absorption spectroscopy, mass spectrometry (MS), and elemental analysis. All analytical data confirmed the proposed structures. The IR spectra of complexes 1–3 in potassium bromide display three very strong ν(C≡O) bands at 2027–1866 cm−1, strong ν(C=O) bands at 1622–1606 cm−1 and solely in the case of alkyne complex 2, a weak ν(C≡C) band at 2119 cm−1. The 1H NMR spectra of the three products are presented in Figures S1–S3 (SI). In the 1H-NMR spectrum of complex 2, a characteristic alkyne signal at δ = 2.56 ppm is observed.
2.2. Single-Crystal X-Ray Structural Analysis of Complexes 1–3
The molecular structures of 1–3 were determined by single-crystal X-ray analysis. Crystals of 1 and 3 that were suitable for X-ray diffraction analysis were obtained from dimethyl sulfoxide-water
Scheme 1.Synthesis of complexes1–3.
We found that thefac-[Re(CO)3(phen)Cl] complex [44] readily reacts with carboxylic acids in THF in the presence of trimethylamine and silver trifluoromethanesulfonate at 70 ◦C to afford products 1, 2 and 3 in a 95%, 65%, and 48% yield, respectively. The mechanism most probably involves a reaction of the carboxylic anion L− andfac-[Re(CO)3(phen)]+ cation, generated in situ, yielding the target complex. This approach represents a simple one-pot procedure for obtaining carboxylato-Re(CO)3(N-N) complexes. Compounds1and2 are yellow air-stable solids, whereas complex3is an orange air-stable solid. The products were characterized by1H-NMR,13C-NMR, IR and UV-Vis absorption spectroscopy, mass spectrometry (MS), and elemental analysis. All analytical data confirmed the proposed structures. The IR spectra of complexes1–3in potassium bromide display three very strongν(C≡O)bands at 2027–1866 cm−1, strongν(C=O)bands at 1622–1606 cm−1and solely in the case of alkyne complex2, a weakν(C≡C)band at 2119 cm−1. The1H-NMR spectra of the three products are presented in Figures S1–S3 (SI). In the1H-NMR spectrum of complex2, a characteristic alkyne signal atδ= 2.56 ppm is observed.
2.2. Single-Crystal X-ray Structural Analysis of Complexes1–3
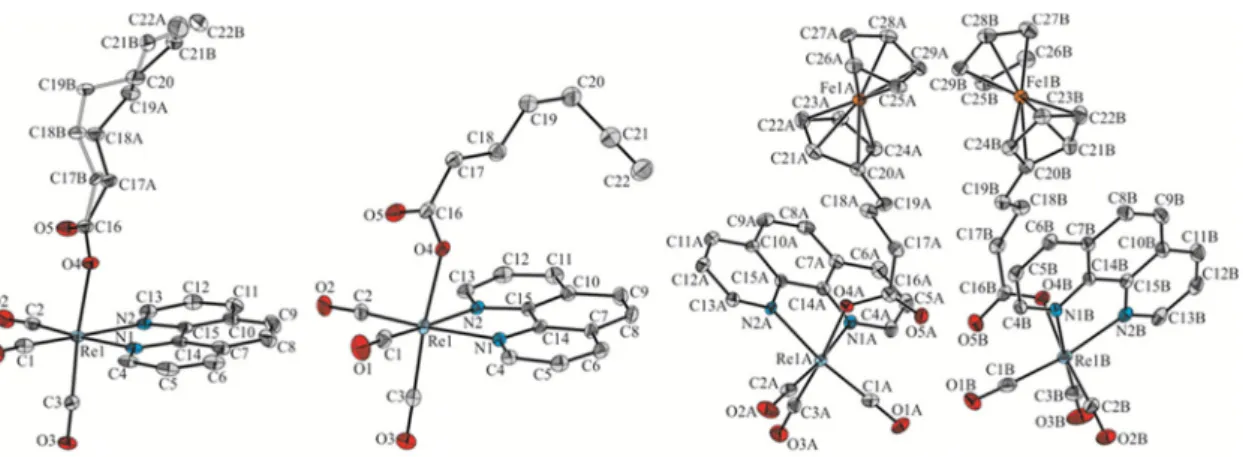
The molecular structures of1–3were determined by single-crystal X-ray analysis. Crystals of1 and3that were suitable for X-ray diffraction analysis were obtained from dimethyl sulfoxide-water mixture, whereas crystals of2were obtained by slow diffusion ofn-pentane into a dichloromethane solution of2. It turned out that the investigated compounds crystallize in the P21/n (1and2) or P21(3) space group of the monoclinic crystal system with one (1and2) or two molecules (3) of the given compound in the asymmetric unit, respectively. The Oak Ridge thermal ellipsoid plot (ORTEP) drawing of1,2, and3is shown with atom numbering in Figure2. Details of crystallographic data and refinement parameters are summarized in Table S1. Geometrical parameters of1–3are presented in Table1and in Tables S2–S10 of Supplementary Materials.
Molecules 2017, 22, 809 4 of 17
mixture, whereas crystals of 2 were obtained by slow diffusion of n-pentane into a dichloromethane solution of 2. It turned out that the investigated compounds crystallize in the P21/n (1 and 2) or P21 (3) space group of the monoclinic crystal system with one (1 and 2) or two molecules (3) of the given compound in the asymmetric unit, respectively. The Oak Ridge thermal ellipsoid plot (ORTEP) drawing of 1, 2, and 3 is shown with atom numbering in Figure 2. Details of crystallographic data and refinement parameters are summarized in Table S1. Geometrical parameters of 1–3 are presented in Table 1 and in Tables S2–S10 of Supplementary Materials.
Figure 2. Oak Ridge thermal ellipsoid plot (ORTEP) diagram of 1 (left), 2 (middle) and 3 (right).
Hydrogen atoms omitted for clarity. Displacement ellipsoids drawn at a 50% probability level.
Table 1. Selected bond distances (Å) and angles (°) of 1–3 (Cpsub = substituted Cp ring).
1 2 3A 3B
Bond distances
C1-O1 1.154(2) 1.151(5) 1.164(4) 1.174(5) C2-O2 1.155(2) 1.152(4) 1.160(4) 1.167(5) C3-O3 1.164(2) 1.165(4) 1.157(4) 1.152(4) Re1-C1 1.922(2) 1.924(4) 1.903(4) 1.901(4) Re1-C2 1.923(2) 1.926(3) 1.917(3) 1.911(4) Re1-C3 1.900(2) 1.903(3) 1.910(3) 1.919(4) Re1-N1 2.176(2) 2.173(3) 2.177(3) 2.181(3) Re1-N2 2.184(2) 2.185(3) 2.175(3) 2.180(3) Re1-O4 2.142(2) 2.146(2) 2.125(2) 2.129(2) Fe-mid point (Cpsub) - - 1.654(2) 1.649(2)
Fe-mid point (Cp) - - 1.651(2) 1.651(2)
bond angles
O4-C16-O5 125.33(16) 125.0(3) 125.7(3) 125.5(3) O4-Re1-N1 81.42(5) 80.83(9) 82.33(9) 79.74(10) O4-Re1-C1 95.58(7) 94.89(13) 96.39(12) 98.50(13) O4-Re1-C3 174.96(6) 174.70(12) 174.35(12) 173.61(12)
All analyzed complexes exhibit typical distorted octahedral geometry with a fac-{Re(CO)3} arrangement and the axially oriented carboxylic ligand [42,45]. The hydrocarbon chain of the ligand in 1 is disordered over two positions with the site occupancy factors of 0.679(4) and 0.321(4). The whole ligand is strongly deflected relative to the phenantroline unit (Figure 2 (left)). In the case of 2 and 3, the carboxylic ligands are directed towards the plane of the phenantroline ring system (Figure 2 (middle) and (right)). The above-mentioned differences in the spatial arrangement result from the packing effects of individual molecules in the crystal lattice. The length of the axial Re–O bond in 1 and 2 is 2.143(1) and 2.146(2) Å respectively, and is comparable to the value that is observed in similar rhenium complexes [42,45]. In the case of 3, the Re–O bond length is slightly shorter and its value is 2.125(2) and 2.129(2) Å for the two molecules in the asymmetric unit (molecule A and B hereafter),
Figure 2. Oak Ridge thermal ellipsoid plot (ORTEP) diagram of1(left),2(middle) and3(right).
Hydrogen atoms omitted for clarity. Displacement ellipsoids drawn at a 50% probability level.
Table 1.Selected bond distances (Å) and angles (◦) of1–3(Cpsub= substituted Cp ring).
1 2 3A 3B
Bond distances
C1-O1 1.154(2) 1.151(5) 1.164(4) 1.174(5)
C2-O2 1.155(2) 1.152(4) 1.160(4) 1.167(5)
C3-O3 1.164(2) 1.165(4) 1.157(4) 1.152(4)
Re1-C1 1.922(2) 1.924(4) 1.903(4) 1.901(4)
Re1-C2 1.923(2) 1.926(3) 1.917(3) 1.911(4)
Re1-C3 1.900(2) 1.903(3) 1.910(3) 1.919(4)
Re1-N1 2.176(2) 2.173(3) 2.177(3) 2.181(3)
Re1-N2 2.184(2) 2.185(3) 2.175(3) 2.180(3)
Re1-O4 2.142(2) 2.146(2) 2.125(2) 2.129(2)
Fe-mid point (Cpsub) - - 1.654(2) 1.649(2)
Fe-mid point (Cp) - - 1.651(2) 1.651(2)
bond angles
O4-C16-O5 125.33(16) 125.0(3) 125.7(3) 125.5(3) O4-Re1-N1 81.42(5) 80.83(9) 82.33(9) 79.74(10) O4-Re1-C1 95.58(7) 94.89(13) 96.39(12) 98.50(13) O4-Re1-C3 174.96(6) 174.70(12) 174.35(12) 173.61(12)
All analyzed complexes exhibit typical distorted octahedral geometry with a fac-{Re(CO)3} arrangement and the axially oriented carboxylic ligand [42,45]. The hydrocarbon chain of the ligand in 1is disordered over two positions with the site occupancy factors of 0.679(4) and 0.321(4). The whole ligand is strongly deflected relative to the phenantroline unit (Figure2(left)). In the case of2and 3, the carboxylic ligands are directed towards the plane of the phenantroline ring system (Figure2 (middle) and (right)). The above-mentioned differences in the spatial arrangement result from the
packing effects of individual molecules in the crystal lattice. The length of the axial Re–O bond in1 and2is 2.143(1) and 2.146(2) Å respectively, and is comparable to the value that is observed in similar rhenium complexes [42,45]. In the case of3, the Re–O bond length is slightly shorter and its value is 2.125(2) and 2.129(2) Å for the two molecules in the asymmetric unit (molecule A and B hereafter), respectively. X-ray diffraction confirmed theO-coordination mode of hept-6-ynoic acid ligand in2.
The C(21)-C(22) terminal triple bond length is 1.174(6) Å. The iron atom in ferrocenyl groups of3 is symmetrically displaced between the cyclopentadienyl ligands. For example, in molecule3A the Fe-Mp distances (Mp corresponds to the mid-point of the respective cyclopentadienyl ring) are 1.654(2) and 1.651(2) Å for the substituted and unsubstituted cyclopentadienyl ring, respectively. Similar results are found in molecule B. Ferrocenyl groups present in the asymmetric unit of3deviate from the eclipsed conformation byϕ= 6◦and 10◦for the molecules A and B, respectively.
2.3. Photophysical Characterization
Electronic absorption spectra of complexes 1–3 are dominated by the features of the fac[Re(CO)3(phen)] core. In particular, as it is shown in Figure 3and Table 2, an intense ligand centered (1LC)π-π* transition of the phenanthroline ligand, with a maximum at 262 nm, is observed.
The low-energy part of the spectra is dominated by a moderately strong broad metal-to-ligand charge-transfer (1MLCT) d(Re)-π*(phen) electronic transition centered at 375 nm [44,46]. The relatively very weak metal-centered d-d absorption of the ferrocenyl entity of3, with the molar absorption coefficientεin the order of 102M−1·cm−1[47], is obscured by the MLCT band. Due to the presence of the ferrocenyl moiety, compound3is not luminescent [38]. It becomes emissive after ferrocenyl ligand dissociation.
Molecules 2017, 22, 809 5 of 17
respectively. X-ray diffraction confirmed the O-coordination mode of hept-6-ynoic acid ligand in 2.
The C(21)-C(22) terminal triple bond length is 1.174(6) Å. The iron atom in ferrocenyl groups of 3 is symmetrically displaced between the cyclopentadienyl ligands. For example, in molecule 3A the Fe-Mp distances (Mp corresponds to the mid-point of the respective cyclopentadienyl ring) are 1.654(2) and 1.651(2) Å for the substituted and unsubstituted cyclopentadienyl ring, respectively.
Similar results are found in molecule B. Ferrocenyl groups present in the asymmetric unit of 3 deviate from the eclipsed conformation by ϕ = 6° and 10° for the molecules A and B, respectively.
2.3. Photophysical Characterization
Electronic absorption spectra of complexes 1–3 are dominated by the features of the fac-[Re(CO)3(phen)] core. In particular, as it is shown in Figure 3 and Table 2, an intense ligand centered (1LC) π-π* transition of the phenanthroline ligand, with a maximum at 262 nm, is observed.
The low-energy part of the spectra is dominated by a moderately strong broad metal-to-ligand charge-transfer (1MLCT) d(Re)-π*(phen) electronic transition centered at 375 nm [44,46]. The relatively very weak metal-centered d-d absorption of the ferrocenyl entity of 3, with the molar absorption coefficient ε in the order of 102 M−1·cm−1 [47], is obscured by the MLCT band. Due to the presence of the ferrocenyl moiety, compound 3 is not luminescent [38]. It becomes emissive after ferrocenyl ligand dissociation.
Figure 3. Absorption and luminescence spectra of 1 in ethanol at ambient temperature.
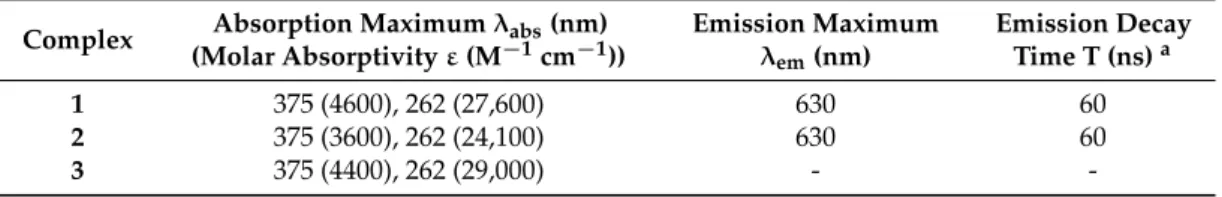
Table 2. Photophysical data for complexes 1–3 at ambient temperature in ethanol.
Complex Absorption Maximum λabs(nm) (Molar Absorptivity ε (M−1 cm−1))
Emission Maximum λem (nm)
Emission Decay Time Τ (ns) a
1 375 (4600), 262 (27,600) 630 60
2 375 (3600), 262 (24,100) 630 60
3 375 (4400), 262 (29,000) - -
a measured for degassed solutions.
Complexes 1 and 2 display orange luminescence characteristics for the fac-[Re(CO)3(phen)]
core [15,44]. The emission spectra measured in ethanol at ambient temperatures are broad with the maxima at 630 nm (Figure 3). The luminescence decay times τ found for both compounds amount to 60 ns. The relatively short values of τ are related to efficient vibrational quenching [1] of the emissive
3MLCT excited states of these molecules and correspond to low luminescence quantum yields of about 1%. Importantly, the obtained decay times measured for air-saturated solutions are almost equal to the τ values determined for degassed samples. This indicates a negligible influence of the molecular oxygenon emission quenching and enables us to use compounds 1 and 2 for confocal microscopy studies.
Figure 3.Absorption and luminescence spectra of1in ethanol at ambient temperature.
Table 2.Photophysical data for complexes1–3at ambient temperature in ethanol.
Complex Absorption Maximumλabs(nm) (Molar Absorptivityε(M−1cm−1))
Emission Maximum λem(nm)
Emission Decay Time T (ns)a
1 375 (4600), 262 (27,600) 630 60
2 375 (3600), 262 (24,100) 630 60
3 375 (4400), 262 (29,000) - -
ameasured for degassed solutions.
Complexes 1 and 2 display orange luminescence characteristics for the fac[Re(CO)3(phen)]
core [15,44]. The emission spectra measured in ethanol at ambient temperatures are broad with the maxima at 630 nm (Figure3). The luminescence decay timesτfound for both compounds amount to 60 ns. The relatively short values ofτare related to efficient vibrational quenching [1] of the emissive
3MLCT excited states of these molecules and correspond to low luminescence quantum yields of about 1%. Importantly, the obtained decay times measured for air-saturated solutions are almost equal to theτvalues determined for degassed samples. This indicates a negligible influence of the molecular oxygen on emission quenching and enables us to use compounds1and2 for confocal microscopy studies.
For completeness, it is mentioned that the MLCT character of the lowest excited states is also predicted by density-functional (DFT) calculations performed for1(Figure4). Thus, HOMO of1is composed mainly from a rhenium 5d orbital perturbed with contributions from the CO and axial L ligands. LUMO represents aπ* orbital of the phen ligand.
Molecules 2017, 22, 809 6 of 17
For completeness, it is mentioned that the MLCT character of the lowest excited states is also predicted by density-functional (DFT) calculations performed for 1 (Figure 4). Thus, HOMO of 1 is composed mainly from a rhenium 5d orbital perturbed with contributions from the CO and axial L ligands. LUMO represents a π* orbital of the phen ligand.
Figure 4. Frontier orbitals of 1 resulting from density-functional (DFT) calculations.
2.4. Confocal Microscopy Studies
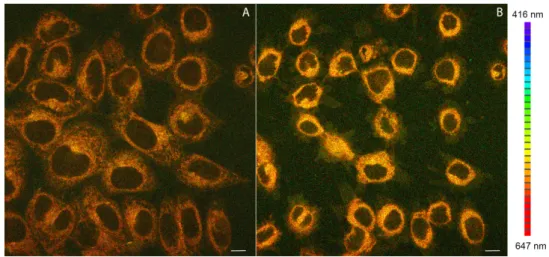
Complexes 1–3 were tested as luminescent probes for in vitro confocal microscopy bioimaging in HeLa cancer cells. All compounds under study were found in the interiors of the cells following 15 min incubation in a medium containing 200 nM of a given compound. Emission spectra recorded for the incubated cells were compatible with the luminescence spectra of 1 and 2 recorded in solution (Figure 5). In Figure 5 A an exemplary confocal image of HeLa cells stained with 2 is reproduced.
Analogous confocal images taken for compound 1 are shown in Figure S4A in Supplementary Materials.
Figure 5. (A) Confocal luminescence image of living HeLa cells stained with 2; (B)View of the photocytotoxic effect of 2 on HeLa cells after prolonged laser irradiation at 405 nm. Emission wavelengths are represented using a false color scale (right), with colors corresponding to spectral bands (416–647 nm total range). Scale bar 10 µm.
The luminescent probe is dominantly accumulated in mitochondria, which is confirmed by the characteristic granular staining pattern. In addition, diffuse (weak) emission stems also from cytoplasm and plasma membranes. The mitochondrial accumulation is further confirmed by a co- localization experiment using 2 and a mitochondria-specific fluorescent probe MitoTracker Green® (Figure 6).
Figure 4.Frontier orbitals of1resulting from density-functional (DFT) calculations.
2.4. Confocal Microscopy Studies
Complexes1–3were tested as luminescent probes for in vitro confocal microscopy bioimaging in HeLa cancer cells. All compounds under study were found in the interiors of the cells following 15 min incubation in a medium containing 200 nM of a given compound. Emission spectra recorded for the incubated cells were compatible with the luminescence spectra of1and2recorded in solution (Figure5).
In Figure5A an exemplary confocal image of HeLa cells stained with2is reproduced. Analogous confocal images taken for compound1are shown in Figure S4A in Supplementary Materials.
Molecules 2017, 22, 809 6 of 17
For completeness, it is mentioned that the MLCT character of the lowest excited states is also predicted by density-functional (DFT) calculations performed for 1 (Figure 4). Thus, HOMO of 1 is composed mainly from a rhenium 5d orbital perturbed with contributions from the CO and axial L ligands. LUMO represents a π* orbital of the phen ligand.
Figure 4. Frontier orbitals of 1 resulting from density-functional (DFT) calculations.
2.4. Confocal Microscopy Studies
Complexes 1–3 were tested as luminescent probes for in vitro confocal microscopy bioimaging in HeLa cancer cells. All compounds under study were found in the interiors of the cells following 15 min incubation in a medium containing 200 nM of a given compound. Emission spectra recorded for the incubated cells were compatible with the luminescence spectra of 1 and 2 recorded in solution (Figure 5). In Figure 5 A an exemplary confocal image of HeLa cells stained with 2 is reproduced.
Analogous confocal images taken for compound 1 are shown in Figure S4A in Supplementary Materials.
Figure 5. (A) Confocal luminescence image of living HeLa cells stained with 2; (B) View of the photocytotoxic effect of 2 on HeLa cells after prolonged laser irradiation at 405 nm. Emission wavelengths are represented using a false color scale (right), with colors corresponding to spectral bands (416–647 nm total range). Scale bar 10 µm.
The luminescent probe is dominantly accumulated in mitochondria, which is confirmed by the characteristic granular staining pattern. In addition, diffuse (weak) emission stems also from cytoplasm and plasma membranes. The mitochondrial accumulation is further confirmed by a co- localization experiment using 2 and a mitochondria-specific fluorescent probe MitoTracker Green® (Figure 6).
Figure 5. (A) Confocal luminescence image of living HeLa cells stained with2; (B) View of the photocytotoxic effect of 2 on HeLa cells after prolonged laser irradiation at 405 nm. Emission wavelengths are represented using a false color scale (right), with colors corresponding to spectral bands (416–647 nm total range). Scale bar 10µm.
The luminescent probe is dominantly accumulated in mitochondria, which is confirmed by the characteristic granular staining pattern. In addition, diffuse (weak) emission stems also from cytoplasm
and plasma membranes. The mitochondrial accumulation is further confirmed by a co-localization experiment using2and a mitochondria-specific fluorescent probe MitoTracker Green®(Figure6).
Molecules 2017, 22, 809 7 of 17
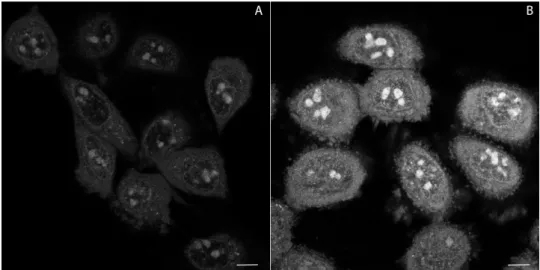
Figure 6. Mitochondria-targeting properties of 2. (A) Co-localization images of HeLa cells stained with 2 (red) and (B) mitochondria-specific MitoTracker Green® (green); (C) Merged image of (A) and (B). Scale bar—10 µm.
The co-localization of 2 and MitoTracker Green® was quantified in HeLa cells by using the Manders (MCC) and Pearson correlation coefficient (PCC) [48]. The respective correlation coefficients were 0.83 ± 0.11 (MCC) and 0.73 ± 0.08 (PCC), both confirming the dominant localization of 2 in the mitochondria of HeLa cells. As expected, the staining pattern of compound 1 is the same as found for compound 2. However, accumulation of neutral complexes in mitochondria is rather surprising, since the negative mitochondrial potential favors an uptake of positively charged species [20–23]. These considerations let us speculate that the mechanism of action for 1 and 2 involves a complex dissociation in the cell interior to form positively charged species having affinity to the mitochondrial membrane. This might be related to lability of the ancillary carboxylate ligands L. To verify this hypothesis, the non-emissive complex 3, comprising a ferrocenyl substituted carboxylate ligand, can be used. For this compound, a similar granular staining pattern was observed (Figure S4B). This implies that the Re complex undergoes ligand dissociation yielding a phosphorescent cation comprising the fac-[Re(CO)3(phen)+] core. Probably, complexes 1 and 2 show the same mechanism of mitochondria staining.
To examine the role of the mitochondrial electric potential, living HeLa cells were preincubated with the mitochondrial uncoupler carbonyl cyanide-p-trifluoromethoxyphenylhydrazone (FCCP) [49], prior to staining with the luminophore 2. FCCP acts as a proton transporter in mitochondria, dissipating the proton gradient across the mitochondrial membrane [49]. Depolarization of mitochondria treated with FCCP resulted in ca. 30% loss of the compound 2 luminescence intensity, compared to the control. However, the cellular localization of 2 in the presence and in the absence of FCCP remains the same (Figure S5). Such a behavior can only be rationalized by a diffusion of the positively charged Re-species from the depolarized mitochondria out to the surrounding cellular compartments.
Nevertheless, a large amount of the compound accumulated in mitochondria is not responsive to the dissipation of mitochondrial potential. It can be surmised that they are bound to mitochondria by non-electrostatic forces. Accumulation of 2 did not induce loss of HeLa cell viability (Figure 5A).
However, prolonged laser irradiation (405 nm, 150 µW, 3.75 J total dose) results in cell shrinkage and plasma membrane blebbing (Figure 5B).
Thus, loss of plasma membrane integrity in the presence of 2 was investigated by using the propidium iodide (PI) exclusion test and wide-field image cytometry [50]. Accordingly, following illumination with 340–380 nm (35 µW) light for 360 s (12.6 J total dose), 14 ± 5% of HeLa cells lost their viability within 2 h, as compared to 5 ± 3% in the non-illuminated control. These results demonstrate that impairment of cell viability by accumulation of 2 is potentiated by phototoxic effects. This notion is compatible with production by 2 of superoxide radicals and other reactive oxygen species (ROS), detected with a dihydroethidium (DHE) staining assay after laser irradiation (Figure 7). This assay relies on DHE oxidation by cellular ROS. Oxidized DHE molecules become red fluorescent upon DNA and double stranded RNA intercalation, and as such can be detected with confocal microscopy.
Figure 6.Mitochondria-targeting properties of2. (A) Co-localization images of HeLa cells stained with 2(red) and (B) mitochondria-specific MitoTracker Green®(green); (C) Merged image of (A) and (B).
Scale bar—10µm.
The co-localization of2 and MitoTracker Green® was quantified in HeLa cells by using the Manders (MCC) and Pearson correlation coefficient (PCC) [48]. The respective correlation coefficients were 0.83±0.11 (MCC) and 0.73±0.08 (PCC), both confirming the dominant localization of2in the mitochondria of HeLa cells. As expected, the staining pattern of compound1is the same as found for compound2. However, accumulation of neutral complexes in mitochondria is rather surprising, since the negative mitochondrial potential favors an uptake of positively charged species [20–23].
These considerations let us speculate that the mechanism of action for1and2involves a complex dissociation in the cell interior to form positively charged species having affinity to the mitochondrial membrane. This might be related to lability of the ancillary carboxylate ligands L. To verify this hypothesis, the non-emissive complex3, comprising a ferrocenyl substituted carboxylate ligand, can be used. For this compound, a similar granular staining pattern was observed (Figure S4B).
This implies that the Re complex undergoes ligand dissociation yielding a phosphorescent cation comprising thefac-[Re(CO)3(phen)+] core. Probably, complexes1and2show the same mechanism of mitochondria staining.
To examine the role of the mitochondrial electric potential, living HeLa cells were preincubated with the mitochondrial uncoupler carbonyl cyanide-p-trifluoromethoxyphenylhydrazone (FCCP) [49], prior to staining with the luminophore2. FCCP acts as a proton transporter in mitochondria, dissipating the proton gradient across the mitochondrial membrane [49]. Depolarization of mitochondria treated with FCCP resulted in ca. 30% loss of the compound2luminescence intensity, compared to the control.
However, the cellular localization of2in the presence and in the absence of FCCP remains the same (Figure S5). Such a behavior can only be rationalized by a diffusion of the positively charged Re-species from the depolarized mitochondria out to the surrounding cellular compartments. Nevertheless, a large amount of the compound accumulated in mitochondria is not responsive to the dissipation of mitochondrial potential. It can be surmised that they are bound to mitochondria by non-electrostatic forces. Accumulation of2did not induce loss of HeLa cell viability (Figure5A). However, prolonged laser irradiation (405 nm, 150µW, 3.75 J total dose) results in cell shrinkage and plasma membrane blebbing (Figure5B).
Thus, loss of plasma membrane integrity in the presence of2 was investigated by using the propidium iodide (PI) exclusion test and wide-field image cytometry [50]. Accordingly, following illumination with 340–380 nm (35µW) light for 360 s (12.6 J total dose), 14±5% of HeLa cells lost their viability within 2 h, as compared to 5±3% in the non-illuminated control. These results demonstrate that impairment of cell viability by accumulation of2is potentiated by phototoxic effects. This notion
is compatible with production by2of superoxide radicals and other reactive oxygen species (ROS), detected with a dihydroethidium (DHE) staining assay after laser irradiation (Figure7). This assay relies on DHE oxidation by cellular ROS. Oxidized DHE molecules become red fluorescent upon DNA and double stranded RNA intercalation, and as such can be detected with confocal microscopy.
Molecules 2017, 22, 809 8 of 17
Figure 7. Production of reactive oxygen species (ROS) monitored with accumulation of ethidium (product of dihydroethidium (DHE) oxidation) after laser irradiation in the absence (A) and the presence (B) of compound 2, in HeLa cells. Emission wavelengths are represented using a false colour.
Scale bar—10 µm.
Accordingly, Figure 7B shows about 2.04 ± 0.19 times more intense fluorescence in treated cells in comparison to the control population (Figure 7A). Confocal microscopy studies revealed some properties of assayed molecules in living cells. In order to investigate these proprieties in more detail, we directed our attention towards proteins as potential binding-targets for compounds 1–3.
2.5. Binding to Model Proteins
In order to evaluate if the synthetized compounds coordinate to biological macromolecules in particular proteins, and to check if the degradation of compound 3 is the result of these interactions, we have studied the formation of potential adducts that could form upon reaction of compounds 1 or 3 with model proteins hen egg white lysozyme (HEWL) and bovine pancreatic ribonuclease (RNase A), which have been extensively used in the past in metalation studies [51–53]. First, the stability of the compounds in the presence of the two proteins was evaluated by registering UV-Vis absorption spectra of the compounds, separately, as function of time (Figures S6–S8). Data indicate that in mixed ethanol/aqueous and DMSO/aqueous solutions the compounds remain stable, with only minor precipitation occurring after 24 h. Then, fluorescence spectra of the two compounds alone and in the presence of HEWL were collected in mixed ethanol/aqueous solutions, upon irradiation at 375 nm, which selectively excites assayed compounds (Figure S9). Interestingly, comparison of the spectra collected upon excitation at 375 nm reveals that ferrocenyl derivative 3 becomes emissive in the presence of HEWL (Figure S9). To verify that this emission is due to the formation of an adduct of 3 with the protein, electrospray ionization mass spectrometry (ESI-MS) spectra of the preformed HEWL-compound 3 adduct were measured and the variations of the HEWL fluorescence in the presence of compounds 1 and 3 were analyzed. To further confirm the binding of compound 3 to the protein, surface plasmon resonance (SPR) measurements were also collected.
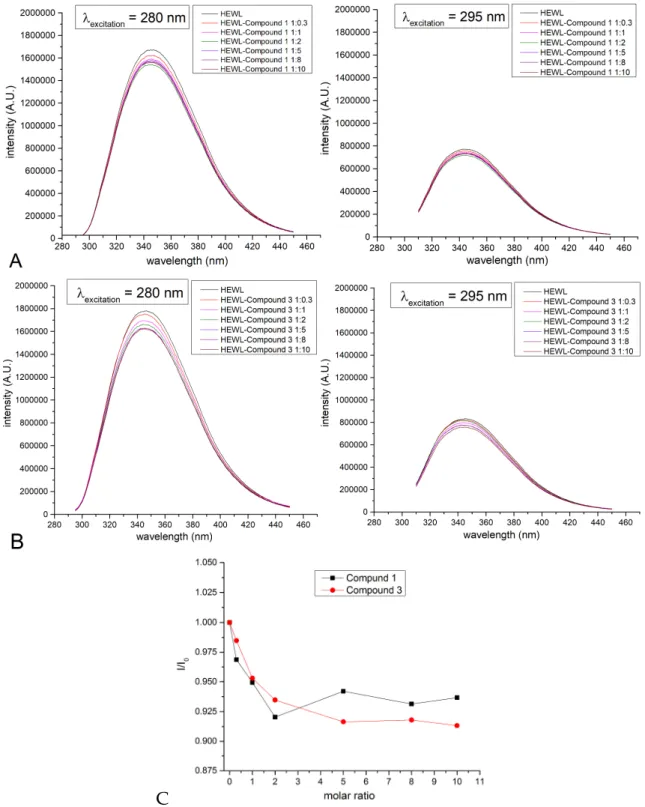
In particular, fluorescence spectra of HEWL in the presence of different amounts of the two compounds, separately, upon excitation at 280 and 295 nm, were registered using samples prepared by mixing the protein with the two compounds separately at different protein to compound ratios, and then dialyzing to remove the excess of the assayed compound (Figure 8). Although limited, the observed quenching of fluorescence intensities at increased concentrations of the compounds corroborate the formation of “Re-protein” adducts.
Figure 7. Production of reactive oxygen species (ROS) monitored with accumulation of ethidium (product of dihydroethidium (DHE) oxidation) after laser irradiation in the absence (A) and the presence (B) of compound2, in HeLa cells. Emission wavelengths are represented using a false colour.
Scale bar—10µm.
Accordingly, Figure7B shows about 2.04±0.19 times more intense fluorescence in treated cells in comparison to the control population (Figure7A). Confocal microscopy studies revealed some properties of assayed molecules in living cells. In order to investigate these proprieties in more detail, we directed our attention towards proteins as potential binding-targets for compounds1–3.
2.5. Binding to Model Proteins
In order to evaluate if the synthetized compounds coordinate to biological macromolecules in particular proteins, and to check if the degradation of compound3is the result of these interactions, we have studied the formation of potential adducts that could form upon reaction of compounds1or3 with model proteins hen egg white lysozyme (HEWL) and bovine pancreatic ribonuclease (RNase A), which have been extensively used in the past in metalation studies [51–53]. First, the stability of the compounds in the presence of the two proteins was evaluated by registering UV-Vis absorption spectra of the compounds, separately, as function of time (Figures S6–S8). Data indicate that in mixed ethanol/aqueous and DMSO/aqueous solutions the compounds remain stable, with only minor precipitation occurring after 24 h. Then, fluorescence spectra of the two compounds alone and in the presence of HEWL were collected in mixed ethanol/aqueous solutions, upon irradiation at 375 nm, which selectively excites assayed compounds (Figure S9). Interestingly, comparison of the spectra collected upon excitation at 375 nm reveals that ferrocenyl derivative3becomes emissive in the presence of HEWL (Figure S9). To verify that this emission is due to the formation of an adduct of3with the protein, electrospray ionization mass spectrometry (ESI-MS) spectra of the preformed HEWL-compound3 adduct were measured and the variations of the HEWL fluorescence in the presence of compounds1and3were analyzed. To further confirm the binding of compound3to the protein, surface plasmon resonance (SPR) measurements were also collected.
In particular, fluorescence spectra of HEWL in the presence of different amounts of the two compounds, separately, upon excitation at 280 and 295 nm, were registered using samples prepared by mixing the protein with the two compounds separately at different protein to compound ratios,
and then dialyzing to remove the excess of the assayed compound (Figure8). Although limited, the observed quenching of fluorescence intensities at increased concentrations of the compounds corroborate the formation of “Re-protein” adducts.Molecules 2017, 22, 809 9 of 17
C
Figure 8. Fluorescence spectra of hen egg white lysozyme (HEWL) adducts with compounds 1 and 3 (0.05 mg/mL in 10% ethanol), prepared by mixing the protein with increasing concentrations of assayed compounds. (A) spectra of HEWL and 1; (B) spectra of HEWL and 3; (C) I/Io as a function of protein to compound ratio. Spectra were collected upon excitation at 280 nm (left panel) and 295 nm (right panel).
Further indications of the binding of compound 3 to HEWL were obtained by SPR data, reported in Figure S10, and performed on immobilized HEWL protein employing compound 3 as analyzed.
Although limited by poor water solubility of the compound that fails to reach saturated binding conditions and to precisely estimate the dissociation constant, these experiments indicate a value of KD at least in the high micromolar range.
Figure 8.Fluorescence spectra of hen egg white lysozyme (HEWL) adducts with compounds1and 3(0.05 mg/mL in 10% ethanol), prepared by mixing the protein with increasing concentrations of assayed compounds. (A) spectra of HEWL and1; (B) spectra of HEWL and3; (C)I/Io as a function of protein to compound ratio. Spectra were collected upon excitation at 280 nm (left panel) and 295 nm (right panel).
Further indications of the binding of compound3to HEWL were obtained by SPR data, reported in Figure S10, and performed on immobilized HEWL protein employing compound3as analyzed.
Although limited by poor water solubility of the compound that fails to reach saturated binding conditions and to precisely estimate the dissociation constant, these experiments indicate a value of KDat least in the high micromolar range.
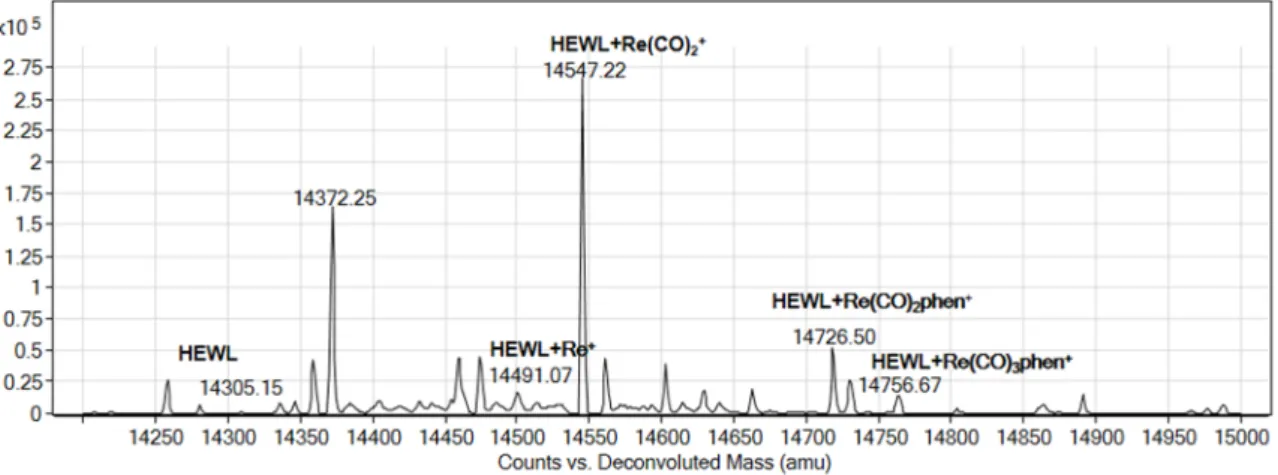
The ESI-MS spectrum of the adduct formed in the reaction of HEWL and compound3in a 1:10 protein to compound molar ratio is reported in Figure 9. The spectrum features new peaks at a molecular weight higher than that of the protein.
Molecules 2017, 22, 809 10 of 17
The ESI-MS spectrum of the adduct formed in the reaction of HEWL and compound 3 in a 1:10 protein to compound molar ratio is reported in Figure 9. The spectrum features new peaks at a molecular weight higher than that of the protein.
Figure 9. Deconvoluted electrospray ionization mass spectrometry (ESI-MS) spectra of HEWL (1 × 10⁻⁴ M) incubated for 24 h at room temperature in the presence of compound 3. Experimental conditions:
protein to metal ratio 1:10, 20 mM ammonium acetate buffer, pH 6.8.
These peaks were assigned to adducts of HEWL with [Re(CO)3(phen)]+, [Re(CO)2(phen)]+ and [Re(CO)2]+ fragments, respectively, and suggest post-dissociative binding of 3 to HEWL molecule.
3. Experimental Section
3.1. General Information
All preparations were carried out using standard Schlenk techniques. Chromatographic separations were carried out using aluminium oxide (EcoChromTM MP Biomedicals, Santa Ana, CA, USA). THF was distilled over Na/benzophenone prior to use. Other solvents were of reagent grade and were used without prior purification. The NMR spectra were recorded on a Bruker AV600 Kryo (600 MHz) spectrometer (Bruker, Bremen, Germany). Chemical shifts are reported in δ (ppm) using residual DMSO (1H δ 2.50 ppm) as references. Mass spectra were recorded using LSIMS methods on a Finnigan MAT 95 mass spectrometer (Thermo Finnigan MAT GmbH, Bremen, Germany). IR spectra were recorded on a FTIR Nexus Nicolet apparatus (Nicolet, Madison, WI, USA). Microanalyses were determined by the Analytical Services of the Polish Academy of the Sciences (Łódź, Poland).
3.2. Chemistry
Synthesis of Complexes 1–3
General procedure for the synthesis of fac-[Re(CO)3(1,10-phenantroline)L] L = heptanoic acid, hept-6-ynoic acid and 4-(1-ferrocenyl)-butanoic acid 1, 2, 3 complexes:
Trimethylamine (46 mg, 0.045 mmol, 63 μL) and silver trifluoromethanesulfonate (116 mg, 0.45 mmol) were added to a stirred mixture of the acid (0.3 mmol) and fac-[Re(CO)3(1,10-phenantroline)Cl]
(220 mg, 0.45 mmol)in THF (60 mL). The reaction mixture was stirred under argon atmosphere at 70 °C for 18 h (for 1 and 3) or 72 h (for 2). The solvent was evaporated to dryness to afford a solid which was subjected to column chromatography on deactivated Al2O3 (Al2O3/H2O 30 g: 1.25 g) with dichloromethane as eluent. Crystallization from dichloromethane/n-hexane gave pure products.
1 yellow solid, 95% (165 mg). 1H-NMR (600 MHz, DMSO-d6): δ = 9.43 (dd, JH,H = 5.4 Hz, 1.2 Hz, 2H, phen), 8.96 (dd, JH,H = 8.4 Hz, 1.2 Hz, 2H, phen), 8.31 (s, 2H, phen), 8.09 (dd, JH,H = 8.4 Hz, 5.4 Hz, 2H, phen), 1.45 (t, JH,H = 7.2 Hz, 2H, CH2), 0.82 (sext, JH,H = 7.2 Hz, 2H, CH2), 0.66 (t, JH,H = 7.2 Hz, 3H, CH3), 0.59–0.50 (m, 4H, CH2), 0.31 (quint, JH,H = 7.2 Hz, 2H, CH2). 13C{1H} NMR (150 MHz, DMSO-d6):
Figure 9. Deconvoluted electrospray ionization mass spectrometry (ESI-MS) spectra of HEWL (1×10⁻⁴M) incubated for 24 h at room temperature in the presence of compound3. Experimental conditions: protein to metal ratio 1:10, 20 mM ammonium acetate buffer, pH 6.8.
These peaks were assigned to adducts of HEWL with [Re(CO)3(phen)]+, [Re(CO)2(phen)]+and [Re(CO)2]+fragments, respectively, and suggest post-dissociative binding of3to HEWL molecule.
3. Experimental Section
3.1. General Information
All preparations were carried out using standard Schlenk techniques. Chromatographic separations were carried out using aluminium oxide (EcoChromTMMP Biomedicals, Santa Ana, CA, USA). THF was distilled over Na/benzophenone prior to use. Other solvents were of reagent grade and were used without prior purification. The NMR spectra were recorded on a Bruker AV600 Kryo (600 MHz) spectrometer (Bruker, Bremen, Germany). Chemical shifts are reported inδ(ppm) using residual DMSO (1Hδ2.50 ppm) as references. Mass spectra were recorded using LSIMS methods on a Finnigan MAT 95 mass spectrometer (Thermo Finnigan MAT GmbH, Bremen, Germany). IR spectra were recorded on a FTIR Nexus Nicolet apparatus (Nicolet, Madison, WI, USA). Microanalyses were determined by the Analytical Services of the Polish Academy of the Sciences (Łód´z, Poland).
3.2. Chemistry
Synthesis of Complexes1–3
General procedure for the synthesis of fac-[Re(CO)3(1,10-phenantroline)L] L = heptanoic acid, hept-6-ynoic acid and 4-(1-ferrocenyl)-butanoic acid1,2,3complexes:
Trimethylamine (46 mg, 0.045 mmol, 63 µL) and silver trifluoromethanesulfonate (116 mg, 0.45 mmol) were added to a stirred mixture of the acid (0.3 mmol) and fac-[Re(CO)3
(1,10-phenantroline)Cl] (220 mg, 0.45 mmol) in THF (60 mL). The reaction mixture was stirred under argon atmosphere at 70◦C for 18 h (for1and3) or 72 h (for2). The solvent was evaporated to dryness
to afford a solid which was subjected to column chromatography on deactivated Al2O3(Al2O3/H2O 30 g: 1.25 g) with dichloromethane as eluent. Crystallization from dichloromethane/n-hexane gave pure products.
1yellow solid, 95% (165 mg).1H-NMR (600 MHz, DMSO-d6):δ= 9.43 (dd,JH,H= 5.4 Hz, 1.2 Hz, 2H, phen), 8.96 (dd,JH,H= 8.4 Hz, 1.2 Hz, 2H, phen), 8.31 (s, 2H, phen), 8.09 (dd,JH,H= 8.4 Hz, 5.4 Hz, 2H, phen), 1.45 (t,JH,H= 7.2 Hz, 2H, CH2), 0.82 (sext,JH,H= 7.2 Hz, 2H, CH2), 0.66 (t,JH,H= 7.2 Hz, 3H, CH3), 0.59–0.50 (m, 4H, CH2), 0.31 (quint, JH,H= 7.2 Hz, 2H, CH2). 13C{1H} NMR (150 MHz, DMSO-d6):δ= 198.5, 194.7, 176.3, 154.0, 146.0, 139.4, 130.4, 127.7, 126.3, 35.9, 30.9, 27.8, 25.6, 21.8, 13.9.
LSI MS:m/z= 581 (M + H+). FTIR (KBrν[cm−1]): 2955 (C-H), 2930 (C-H), 2854 (C-H), 2027 (Re-C≡O), 1917 (Re-C≡O), 1869 (Re-C≡O), 1622 (C=O) cm−1. Anal. Calcd. for C22H21N2O5Re: C, 45.59%; H, 3.65%; N, 4.83%. Found: C, 45.74%; H, 3.75%; N, 5.02%.
2yellow solid, 65% (112 mg).1H-NMR (600 MHz, DMSO-d6):δ= 9.43 (dd,JH,H= 5.1Hz, 1.2 Hz, 2H, phen), 8.95 (dd,JH,H= 7.8 Hz, 1.2 Hz, 2H, phen), 8.03 (s, 2H, phen), 8.09 (dd,JH,H= 8.4 Hz, 5.1 Hz, 2H, phen), 2.56 (t,JH,H= 2.4 Hz, 1H, C≡CH), 1.49–1.45 (m, 4H, CH2), 0.66 (quint,JH,H= 7.2 Hz, 2H, CH2), 0.50 (quint,JH,H= 7.2 Hz, 2H, CH2).13C{1H} NMR (150 MHz, DMSO-d6):δ= 198.5, 194.7, 176.1, 154.1, 154.0, 146.0, 139.5, 130.4, 127.8, 126.3, 84.1, 71.0, 35.4, 27.0, 24.8, 17.2. LSI MS:m/z= 576 (M + H+). FTIR (KBrν[cm−1]): 2955 (C-H), 2927 (C-H), 2854 (C-H), 2119 (C≡C), 2024 (Re-C≡O), 1910 (Re-C≡O), 1866 (Re-C≡O), 1606 (C=O) cm−1. Anal. Calcd. for C22H17N2O5Re: C, 45.91%; H, 2.98%; N, 4.87%. Found:
C, 45.93%; H, 3.00%; N, 5.15%.
3orange solid, 48% (50 mg). 1H-NMR (600 MHz, DMSO-d6): δ = 9.45 (dd,JH,H = 5.1 Hz, 1.2 Hz, 2H, phen), 8.96 (dd,JH,H= 8.1 Hz, 1.2 Hz, 2H, phen), 8.30 (s, 2H, phen), 8.10 (dd,JH,H= 8.1 Hz, 5.1 Hz, 2H, phen), 3.92 (s, 5H, C5H5), 3.87 (pt,JH,H= 1.8 Hz, 2H, C5H4), 3.53 (pt,JH,H= 1.8 Hz, 2H, C5H4), 1.49 (t,JH,H= 7.2 Hz, 2H, CH2), 1.41 (t,JH,H= 7.8 Hz, 2H, CH2), 0.87 (quint,JH,H= 7.2 Hz, 2H, CH2). 13C{1H} NMR (150 MHz, DMSO-d6): δ= 198.5, 194.6, 176.3, 154.0, 146.0, 139.5, 130.4, 127.8, 126.3, 88.4, 68.1, 67.4, 66.5, 35.6, 27.6, 26.7. LSI MS:m/z= 722 (M+). FTIR (KBrν[cm−1]): 3085(C-H), 2955(C-H), 2933(C-H), 2015(Re-C≡O), 1910(Re-C≡O), 1879(Re-C≡O), 1616(C=O) cm−1. Anal. Calcd.
for C29H23N2O5ReFe: C, 48.27%; H, 3.21%; N, 3.88%. Found: C, 48.27%; H, 3.32%; N, 4.02%.
3.3. Quantum Chemical Computations
The molecular geometry of1was optimized using the hybrid gradient corrected correlation functional B3LYP [54]. For C, H, N, and O the Ahlrichs split-valence basis set SVP [55] was applied and for valence orbitals of Re the quadruple-dzeta quality atomic basis set QZVP [56] was applied, respectively. The inner-core electrons of Re were substituted with a relativistic effective core potential [57]. Five lowest-energy electronic transitions were calculated for the DFT optimized ground-state geometry using the time-dependent density functional theory (TD-DFT) and applying the same basis sets as for the geometry optimization. All computations were carried out using the Gaussian 09 computer program package [58].
3.4. X-ray Crystallography
Good quality single-crystals of 1–3 were selected for the X-ray diffraction experiments at T= 100(2) K. They were mounted with paratone-N oil at the MiTeGen micro-mounts. Diffraction data were collected on the Agilent Technologies SuperNova Dual Source diffractometer with MoKα radiation (λ= 0.71073 Å) using CrysAlis RED software (CrysAlis CCD and CrysAlis RED, Oxford Diffraction, Oxford Diffraction Ltd.: Yarnton, UK, 2008). The analytical numerical absorption correction using a multifaceted crystal model based on expressions derived by R.C. Clark & J.S. Reid [59] (1and2) and numerical absorption correction based on gaussian integration over a multifaceted crystal model (3) implemented in SCALE3 ABSPACK scaling algorithm, were applied [60]. The structural determination procedure was carried out using the SHELX package [61]. The structures were solved with direct methods and then successive least-square refinement was carried out based on the full-matrix
least-squares method onF2using the XLMP program [61]. All H-atoms were positioned geometrically, with C–H equal to 0.93, 0.96 and 0.97 Å for the aromatic/methylidyne, methyl and methylene H-atoms, respectively, and constrained to ride on their parent atoms with Uiso(H) = xUeq(C), where x = 1.2 for the aromatic, methylidyne and methylene H-atoms, and x = 1.5 for the methyl H-atoms. The figures for this publication were prepared usingORTEP-3program [62].
3.5. Luminescence Measurements
UV-Vis absorption spectra were recorded with a Varian Cary 300 double beam spectrometer.
Luminescence spectra were measured for air-saturated and degassed diluted (c≈5×10⁻⁵M) solutions in ethanol with a Horiba Jobin Yvon Fluorolog 3 steady-state fluorescence spectrometer. For decay time measurements, a PicoQuant LDH-P-C-375 pulsed diode laser (λexc= 372 nm, pulse width 100 ps) was applied as the excitation source. The emission signal was detected with a cooled photomultiplier attached to a FAST ComTec, München, Germany, multichannel scalar card with a time resolution of 250 ps. Photoluminescence quantum yieldsφPLwere determined with a Hamamatsu C9920-02 system equipped with a Spectralon®integrating sphere.
3.6. Biology
3.6.1. Biological Imaging
Human HeLa 21.4 cells were cultured for 48 h after seeding in Petri dishes with a glass bottom (MaTek), reaching approximately 50% confluency. The cells were grown in Dulbeco’s minimal essential medium (DMEM) with 5% FCS, at 5% CO2and 37◦C. The same medium was used to perform all microscopy experiments. Directly before imaging, the cells were incubated with 200 nM of1,2or3 added to the imaging medium. Stock solutions of these compounds were freshly prepared in DMSO (200µM). Additionally, mitochondria of live cells were labelled (where indicated) with MitoTracker® Green (Thermofisher, Poland) by incubation with 100 nM of the dye for 20 min. Alternatively, cells were incubated with 20µM of dihydroethidium (DHE) for 15 min, to detect production of reactive oxygen species (ROS). Where indicated, mitochondrial electric potential was dispersed [63] by incubation with 5µM carbonyl cyanide-p-trifluoromethoxyphenylhydrazone (FCCP) (30 min) prior to loading with2. Loss of plasma membrane integrity (indicator of cell viability) was monitored using staining of cell nuclei with propidium iodide (PI), as described before [50]. The imaging was performed by using LSM 780 confocal system (Zeiss), equipped AxioObserver Z1 inverted microscope, 63×oil immersion objective (NA 1.4), 405 diode laser (30 mW), 488 nm Ar laser (25 mW) a multi-anode PMT (32 elements). Luminescence spectrum was registered from single confocal sections (pinhole set to 1 Airy unit), in 410 nm–685 nm range, with 8.5 nm spectral precision, using 405 nm (1.8%) excitation.
Where indicated, detector elements were combined into detection bands corresponding to 600–700 nm (1,2,3, excitation 405 nm) and 500–550 nm (MitoTracker®Green, excitation 488 nm). The luminescence and transmitted light images were collected with 8.4µs pixel dwell time and pixel size of 0.176µm.
Alternatively, the imaging was performed using Leica SP8 confocal system, equipped with a DMI6000 inverted microscope, 63×oil immersion objective (NA 1.4), 405 nm pulsed (40 MHz) diode laser (5 mW nominal power), 488 nm Ar laser (30 mW), hybrid (HyD) and conventional (PMT) detectors.
Luminescence (1,2,3) was excited using the 405 laser (5%) and registered (PMT) from single confocal sections (pinhole set to 1 Airy unit) in 600–700 nm range. Fluorescence of ethidium (product of DHE oxidation by ROS) was excited with 488 nm light and detected in 550–585 nm range with HyD (integration mode). The luminescence and transmitted light images were collected with the speed of 100 lines/s and pixel size of 0.18µm. Loss of cell viability in the presence of 2 (200 nM) was monitored in time with image cytometry. Image registration was performed with Leica DMI6000 inverted wide-field microscope, equipped 40×dry objective (NA 0.75), 100 W metal halide arc lamp and a 1.4 Mp CCD camera (Sony ICX 285 chip, Leica, Wetzlar, Germany). The HeLa cells were cultured (~50% confluency) and imaged in standard 24-well plates. Transmitted light and fluorescence
(580–630 nm range, PI) images were registered for 18 h, with 1 h frame rate. Each well corresponded to 9 (3×3 tile) fields of view probed, which translated to at least 220 monitored cells. To quantify phototoxic effects of2, the HeLa cells were irradiated with 35µW of UV light (340–380 nm) for 360 s before onset of the imaging. The time (LT50) corresponding to 50% of imaged cells losing their plasma membrane integrity (manifested by PI staining of nuclei) was quantified for the populations of control (1720) and UV-irradiated (1930) cells, stained with2.
3.6.2. Reaction with Model Proteins
Interactions between compounds1and3and model proteins hen egg white lysozyme (HEWL) and bovine pancreatic ribonuclease (RNase A) were studied by collecting (1) UV-Vis absorption spectra of the two compounds in mixed DMSO/aqueous and ethanol/aqueous solutions in the presence of the two proteins, separately, for 24 h; (2) Intrinsic fluorescence spectra of HEWL samples prepared by incubating the protein in the presence of the compounds at different concentrations for 24 h at room temperature and then dialyzing to remove the unbound compound. Spectra were registered upon excitation at 280, 295 and 375 nm; (3) electrospray ionization mass spectra (ESI MS) of HEWL in the absence and in the presence of the two compounds, separately, upon 24 h of incubation at room temperature; (4) surface plasmon resonance measurements of the formation of HEWL-compound3system. UV-Vis absorption spectra were recorded with a Varian Cary 5000 Uv-vis-NIR spectrophotometer under the following experimental conditions: 100% ethanol, 50%
ethanol and 50% PBS pH 7.4, 10% ethanol and 90% PBS pH 7.4 in the presence and in the absence of the two proteins. Other spectra were recorded using DMSO instead of ethanol. A Horiba Scientific Fluoromax-4 spectrofluorometer was used to measure fluorescence spectra. Experimental details:
excitation wavelengths = 280, 295 and 375 nm; protein concentration = 0.05 mg/mL (0.0035 mM).
Spectra were collected in 10% ethanol at 20◦C by comparing the protein emission spectrum with that of the metal complex under the same experimental conditions. Different protein to metal ratio were analyzed (HEWL:complex 1:0.5, 1:1, 1:2, 1:3, 1:5, 1:8, 1:10).
ESI MS measurements were carried out using an LCQ DECA XP Ion Trap mass spectrometer (ThermoElectron, Milan, Italy) equipped with an OPTON ESI source (operating at 4.2-kV needle voltage and 320◦C) in positive mode. Multicharge spectra were deconvoluted using the BioMass program implemented in the Bioworks 3.1 package provided by the manufacturer. In these experiments, proteins were incubated in the presence of the two compounds for 24 h at room temperature in 1:10 protein to metal ratio, 20 mM ammonium acetate pH 6.8.
Surface Plasmon Resonance (SPR) experiments were performed at 25 ◦C on a Biacore 3000 instrument (GE Healthcare, Buckinghamshire, UK). HEWL was immobilized at 1095 RU, on a CM5 Biacore sensor chip in 10 mM sodium acetate pH 5.5, by using the EDC/NHS chemistry, with a flow rate of 5µL×min−1and an injection time of 7 min. Binding assays were carried out by injecting 90µL of analyte, at 20µL×min−1. Experiments were carried out at Ph = 7.4 using HBS and 8% EtOH (v/v). Solvent correction was performed. Stock solutions of compound3at 3.0 mM in EtOH were freshly prepared.
3.6.3. Deposited Data
Cif files of the structure determinations were deposited at the Cambridge Crystallographic Data Centre (CCDC numbers 1524287-1524289). These data can be obtained free of charge viawww.ccdc.
cam.ac.uk/structures.
4. Conclusions
We have synthetized and fully characterized three new neutral fac-[Re(CO)3(phen)L]
compounds (1–3) with phen = 1,10-phenanthroline and L = O2C(CH2)5CH3, O2C(CH2)4C≡CH, and O2C(CH2)3((C5H5)Fe(C5H4)). Compounds1and2display orange luminescence characteristics for thefac[Re(CO)3(phen)]+core, whereas3is not emissive due to the presence of the ferrocenyl moiety