W HO MAKES THE BEST OF IT ?
Alternative feeding strategies of European perch (Perca fluviatilis) and their consequences
I n a u g u r a l - D i s s e r t a t i o n zur
Erlangung des Doktorgrades
der Mathematisch-Naturwissenschaftlichen Fakultät der Universität zu Köln
vorgelegt von Lisa Heermann aus Heidelberg
Köln
2008
Berichterstatter: PD. Dr. habil Jost Borcherding
Prof. Dr. Hartmut Arndt
Tag der mündlichen Prüfung: 19.11.2008
'Naturwissenschaftler sammeln zunächst nur Einzelheiten.
Wenn sie genug Einzelheiten haben, machen sie Tatsachen daraus.
Wenn sie genug Tatsachen haben, bringen sie sie in ein System.
Wenn sie genug Systeme haben,
lassen sie das Ganze sein und fangen wieder von vorne an'
Erwin Chargaff (Biochemiker, 1905-2002)
3
D ANKSAGUNG
Mein ganz besonderer Dank gilt PD Dr. habil. Jost Borcherding für die Überlassung des Themas, für die Möglichkeit zur Promotion und die vielen lichtbringenden Diskussionen. Weiterhin danke ich Jost Borcherding für das mir entgegengebrachte Vertrauen in meine Arbeit, die sehr gute Zusammenarbeit und die immerwährende Unterstützung meines beruflichen Werdegangs inklusive des einen oder anderen Schlenkers.
Prof. Dr. Hartmut Arndt möchte ich für die hilfreichen Diskussionen und die Unterstützung während meiner Arbeit danken. Außerdem danke ich Hartmut Arndt für die Begutachtung dieser Promotion.
Prof. Dr. Gerard Van der Velde von der Universität Nijmegen danke ich für die Möglichkeit die Stable Isotope Analysen in seinem Labor durchführen zu können und für die Diskussion der daraus resultierenden Ergebnisse. Jelle Eygenstein gilt mein Dank für die Hilfe bei der Durchführung der Stable Isotope Analysen.
Mein Dank geht an Prof. Dr. Carin Magnhagen und Prof. Dr. Lars-Ove Eriksson von der Schwedischen Universität für Agrarwissenschaften in Umeå für die Kooperation und die fachliche Unterstützung bei den Lipidanalysen, sowie für die Diskussion der Ergebnisse.
Ich danke Fred Bartlett und Andrew O’Sullivan für die Korrektur eines Großteils des englischen Textes dieser Arbeit.
Ganz herzlich möchte ich mich bei allen Grietherbuschern bedanken, die die wissenschaftliche WG so nett gestaltet haben mit den vielen Terrassen-Kaffee- Pausen, der ein oder anderen Wir-schaffen-das-Aufmunterung und den erfrischenden Badeereignisse im Speldroper Baggersee.
Mein Dank geht außerdem an alle, die mir bei den Probennahmen und beim Abfischen geholfen haben, ihr habt es erst möglich gemacht!
Iris und Christoph Schiavo danke ich für verquatschte Minuten in der Sonne und den mit Kleinigkeiten verschönerten Empfang in Grietherbusch.
Besonders danke ich meinem Lebensgefährten Andreas Feser für die Begleitung durch die Promotion, das Abfangen der kleinen Krisen und ganz einfach fürs bei mir sein!
Ulrike König möchte ich für die symbiotischen Jahre danken.
Anna Stiller danke ich für die Erstellung des Covers und fürs da sein.
Ohne meine Familie wäre diese Arbeit nicht zustande gekommen, vielen Dank!
5
C ONTENTS
Introduction 8
I. Making the best of it: how the necessity to use alternative food resources
induces cannibalism 20
II. Temperature and size-dependent energy storage and winter mortality
in fish 44
III. Competition, predation, cannibalism: the development of
young-of-the-year perch populations in ponds with bream or roach 76 IV. Two size classes of 0+ year perch: is phenotypic plasticity based on food
resources? 98
V. Development of abundance and size structure of young-of-the-year
perch populations using three methods 112
Abstract 142
Kurzzusammenfassung 146
7
I NTRODUCTION
I NTRODUCTION
Individual specialisation has frequently been ignored mostly because it was considered to occur rarely or to have minor impact on ecological processes (Patterson 1983; Taper & Case 1985). Thus, niche theory was often used to describe the ecology of a whole species, rather than taking into account the fact that individuals of the same species might forage on different resources (e.g. Feinsinger et al. 1981; Linton et al. 1981). The optimal diet theory (Pulliam 1974; Werner &
Hall 1974) explains why individuals do not use the whole range of profitable food resources even if these are available. To maximise fitness, individuals select a particular diet which is determined by the energy content of alternative prey, encounter rates, and how effective the forager is at detecting, capturing, handling and digesting the prey. Following this hypothesis it seems to be quite obvious that in conjunction with different phenotypes, individual specialisation frequently occurs (Svanbäck & Bolnick 2005). One of the first to refer to individual specialisation to explain the forces that create and maintain phenotypic variation within natural populations was Van Valen (1965) with his niche variation hypothesis. Van Valen stated that niche width broadens in the absence of interspecific competition.
Expanded niche width can either be explained by all individuals using a broader food spectrum, or by increased specialisation. Then each individual has a narrow individual niche width, but the resource overlap between conspecifics remains small.
Thus intraspecific competition is minimised.
Recently the latter explanation of broadened niche widths was confirmed for several
species by Bolnick et al. (2007), who found that more generalised populations also
tend to be more ecologically heterogeneous. Svanbäck and Bolnick (2007) showed
that resource competition promotes niche variation within populations and presented
experimental evidence confirming that competition drives ecological diversification
within natural populations. Three-spined sticklebacks (Gasterosteus aculeatus)
started to add alternative prey types to their diet when the population density in
enclosures was increased and hence, the competition for available resources was
high. Since phenotypically different individuals added different alternative prey, the
specialisation of the population also increased. Resource competition can modify the
degree of individual specialization in several ways, explained with a model of
Svanbäck and Bolnick (2005). They assume that individuals have a first-choice prey,
second-choice prey, etc. Depending on the phenotype (influencing for example
handling times, attack rate) individuals start adding the next ranked resource at
9
different times. If all individuals have identically ranked preferences for all resources, the specialisation is high when the population density - and hence intraspecific competition - is low. With increasing densities the specialisation also increases, although all fish have the same lower-ranked resources. But due to the fact that some phenotypes switch later than others, the diet variability increases. If individuals share some of their top-ranked resources but have different rankings for less preferred resources, the same pattern of the specialisation development as in the first scenario is observed. First specialisation is low, but it then increases with increasing population density. However, at medium densities the specialisation is much higher than in scenario one. If individuals have different first-choice preferences and their lower ranked resources also differ, the specialisation is highest at low densities. With increasing densities the specialisation might decrease slightly, due to casual overlap of diet when some phenotypes have switched to the next ranked resource. True for all three scenarios is the fact that, at high population densities individuals become generalists and the specialisation is low or not existing.
One form of specialisation of perch (Perca fluviatilis) was shown to be early piscivory. Usually perch is known to perform two ontogenetic niche shifts during its development, first preying on zooplankton, later changing to macroinvertebrates and finally becoming piscivorous at a length of about 150 mm (Thorpe 1977; Persson &
Greenberg 1990; Byström et al. 1998), a size which perch usually reach after 2 to 3 years. These niche shifts are accompanied by a habitat shift from the pelagic, where perch feed on zooplankton, to the littoral where perch become benthivorous (e.g.
Persson 1993). However, several studies have shown that perch can also switch to piscivory during their first months of life (Borcherding et al. 2000; Beeck et al. 2002;
Borcherding 2006). Brabrand (1995) even found early piscivory at a length of 10.5 mm. The consumption of the alternative high-energy food resource fish leads to increased growth rates of about 1.2 mm day -1 (Borcherding et al. 2000); hence piscivorous fish soon exceed their planktivorous siblings in length. Beeck et al.
(2002) presented a study in which young-of-the-year (YOY) perch developed into a
slow-growing and a fast-growing size-cohort. Stomach content analyses revealed that
the small, slow-growing size-cohort fed predominantly on zooplankton, whereas the
large, fast-growing cohort was piscivorous, preying on bream larvae during early
summer (Beeck et al. 2002). Thus, the typical observed switch from zooplanktivory
I NTRODUCTION
to benthivory and then from benthivory to piscivory was displaced by an alternative diet shift from zooplanktivory directly to piscivory.
Based among other things on these findings, Borcherding et al. (in prep.) developed a model to answer the question of why only a part of the perch population is able to prey on bream larvae and to grow extremely fast. They showed that perch shift habitats with a certain length which was marginally variable over the years. With the switch to the littoral, specialisation increased as perch started - each in its own individual fashion - to add new prey items to its diet, including bream larvae. If perch hatched several days before bream, the whole age cohort of YOY perch was able to prey on bream and the size differences between individuals stayed small. Marginal differences of perch length were also observed if bream hatched much earlier than perch and no predation occurred, due to the fact that bream were already too large for gape-size limited perch. But in between the total match and the mismatch situation, only the largest perch were able to feed on bream when arriving in the littoral, leading to increased size differences and the development of a bimodal size distribution. Additionally the amount of bream available was a key factor. Small perch could only reach large sizes when the mean consumption exceeded about 3.5 bream per perch per day. Large perch mostly benefited from predation on bream at consumption rates of a maximum of one bream per perch per day and did not increase further in size with a further increase of the mean consumption rate. Hence, size differences between small-sized and large-sized perch are most distinct at a consumption rate of two bream per perch per day (Borcherding et al. in prep.). If via early piscivory size differences become large enough, intraguild cannibalism will soon occur (Urbatzka et al. 2008).
Intraguild cannibalism has been shown in a few studies on perch to contribute to the development of two size-cohorts (e.g. Brabrand 1995; Urbatzka et al. 2008).
However most of the studies on cannibalism focused on interguild cannibalism (e.g.
Claessen et al. 2000; Persson & De Roos 2006). Cannibals were often shown to share
a resource with their victims, which means that not only predator-prey interactions,
but also intraspecific competition (Claessen et al. 2000; 2002) may affect interactions
with their prey. Cannibals derive direct energetic benefit from cannibalism by
feeding on their conspecifics, while at the same time reducing competition for shared
resources (Claessen et al. 2000; 2002; Byström 2006). Recent studies have focused
on the combined effects of intraspecific competition and cannibalism, showing that
11
large individuals, so-called “giants”, can develop under certain conditions (Persson et al. 2000; 2004; Byström 2006). If animals start to feed on their YOY siblings early in the year, when these are still relatively small, these cannibals are able to control the number of their smaller siblings and thus diminish intraspecific competition for the shared resource. However, the lower energetic value of small fish means that the cannibals do not develop into giants. If they become cannibalistic later in the year, when their YOY siblings have reached larger sizes, they derive greater energetic benefit from their cannibalism. In this situation, however, cannibals are not able to control their siblings and reduce the intraspecific competition for the shared resource.
Thus, they take the risk of being outcompeted by their smaller siblings, but are able to reach high growth rates due to the high energy uptake when feeding on large siblings. Hence, only a few individuals become giants (Claessen et al. 2000).
Empirical evidence for these suggestions was found in Arctic char (Salvelinus alpinus) populations, where within a strong recruit cohort, some individuals avoided competition when they started to cannibalise. These individuals accelerated their growth and developed into giants (Byström 2006).
The development of so-called giants brings several advantages for the large fish. In studies on early piscivory of perch and the development of the bimodality within the YOY age cohort Beeck et al. (2002) documented that male perch of the larger size- cohort were already mature after the first winter. Thus they probably contribute considerably to the gene pool of the next perch generation. Other advantages for the larger perch compared to the small perch resulting from the establishment of a stable bimodality might be higher energy reserves in autumn and less winter mortality.
Energy reserves of fishes are positively correlated to size (Brett & Groves 1979;
Thompson et al. 1991; Schultz & Conover 1997; Sogard & Olla 2000; Huss et al., in press). Thus, the smaller the fish the sooner its energy reserves will become depleted, resulting in size-related mortality rates, which is also described in many other studies on winter mortality (Post & Evans 1989; Post et al. 1998; Lappalainen et al. 2000;
Biro et al. 2004; Byström et al. 2006).
This study should bring insights into the mechanism, i.e. the specialisation on
alternative food resources leading to intra-guild cannibalism and the establishment of
a bimodal size distribution of the YOY perch population (Huston & DeAngelis
1987). With high levels of competition for the preferred food resource, some perch
might specialise on alternative food resources to avoid competition. These
I NTRODUCTION
individuals might be favoured in terms of growth if they specialise on a higher- energy resource than their conspecifics. This growth acceleration might then enable cannibalism, producing a few large individuals (giants). To test these hypotheses, four experimental ponds were stocked with either adult perch or a combination of adult perch and bream (Abramis brama). The offspring and the abundance of food resources were monitored to examine the mechanisms behind the development of early piscivory and intra-guild cannibalism.
The establishment of a bimodal size distribution due to early piscivory and cannibalism might bring several advantages for the large size-cohort, especially with the first winter acting as a bottleneck for the recruitment success of YOY perch.
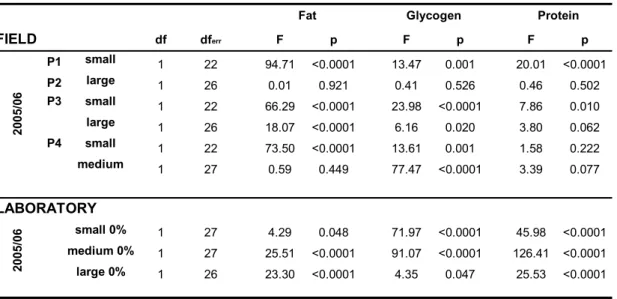
Size-dependent relationships of energy storage and depletion may affect the survival of perch during winter, suggesting that lower depletion rates of the energy reserves in larger individuals lead to higher mortality rates and lower recruitment of smaller individuals to the adult population. This study focused on size-dependent mortality rates and on the effects of temperature on winter mortality in fish. Over two winters the energy reserves and mortality of two size classes of YOY perch were studied in pond experiments. The first experiments were performed in 2005/06, when the temperature was relatively low and comparable with the average winter temperature of the last few decades. The second set of field experiments were carried out during the winter of 2006/07, when the temperature exceeded average temperatures. To support the field data, additional laboratory experiments were conducted, in which YOY perch were starved or fed different amounts of food. Thus data on mortality rates, the usage of energy stores (glycogen, fat, protein) and the influence of food supply during winter could be obtained.
Furthermore this study should clarify whether the same mechanism that causes the development of two size-cohorts, via early specialisation of perch on bream larvae and cannibalism, also applies when other prey fish are available instead of bream.
Therefore, in experimental ponds the growth and development of YOY perch was monitored in the presence and absence of bream and roach respectively. First suggestions about the influence of early piscivory and cannibalism on the population dynamics are given.
The specialisation on alternative food resources was shown on the one hand to be
dependent on the phenotype of the fish, since the ability to catch and handle food
items related to the phenotype of the predator causes fish to specialise on different
13
resources. On the other hand the use of different prey types might lead to morphological adaptations to the food resource preyed on. Hence, the two size- cohorts developing in cannibalistic systems might not only differ in size but also in morphological traits. Field data (Beeck et al. 2002) were analysed to get hints on distinct phonotypical differences between the two size-cohorts. However, although stomach content analyses revealed that the large cohort was at least temporarily piscivorous while the small cohort fed on zooplankton, it was not possible to rule out the possibility that other food resources were used as well (Beeck et al., 2002).
Therefore in a second step, mesocosm experiments were performed in which YOY year perch were fed with either zooplankton or with fish for 40 days. This part of the study was designed to help reveal the extent of morphological variation due to the consumption of different food resources.
All field studies on the development of a population crucially depend on the success of catching representative fish samples to draw a reliable picture of the population.
The capture success of each fishing method depends on factors such as activity of the
fish, abundance or the habitat the method is used in. Especially in cases of
bimodality with different behaviour of the two size-cohorts (feeding, activity, habitat
use) extreme differences in the length-frequency distribution of perch sampled using
different methods were expected. In the shallow experimental ponds in a parallel
sampling design the capture success of electrofishing and gillnetting with multi-mesh
gillnets was examined. To obtain additional information on the sampling of YOY
perch in larger and deeper waters, three different gravel pit lakes were studied,
employing both methods. For development of perch larvae in the pelagic zone after
hatching, bongo-net fishing was used in spring as a third standard method. The
methodological comparison should help to draw conclusions on how to improve fish
stock assessment.
I NTRODUCTION
References
Beeck, P., Tauber, S., Kiel, S., and Borcherding, J. 2002. 0+ perch predation on 0+
bream: a case study on a eutrophic gravel pit lake. Freshwat Biol 47: 2359-2369.
Biro, P. A., Morton, A. E., Post, J. R., and Parkinson, E. A. 2004. Over-winter lipid depletion and mortality of age-0 rainbow trout (Oncorhynchus mykiss). Can J Fish Aquat Sci 61: 1513-1519.
Bolnick, D. I., Svänback, R., Araujo, M. S., and Persson, L. 2007. Comparative support for the niche variation hypothesis that more generalized populations also are more heterogeneous. Proc Nat Acad Sci USA 104: 10075-10079.
Borcherding, J., Beeck, P., DeAngelis, D.L., Scharf, W. Phenology affects size- dependent life history strategies that causes divergence in population structure. in preparation
Borcherding, J. 2006. Prey or predator: piscivorous 0+ perch (Perca fluviatilis) in the trade-off between food and shelter. Env Biol Fish 77: 87-96.
Borcherding, J., Maw, S. K., and Tauber, S. 2000. Growth of 0+ perch (Perca fluviatilis) predating on 0+ bream (Abramis brama). Ecol Freshwat Fish 9: 236-241.
Brabrand, A. 1995. Intra-cohort cannibalism among larval stages of perch (Perca fluviatilis). Ecol Freshwat Fish 4: 70-76.
Brett, J. R. and Groves, T. D. D. 1979. Physiological energetics. In Fish Physiology, Vol. 8. (eds. W. S. Hoar, R. D. Randall, and J. R. Brett), pp. 279-352. New York:
Academic Press.
Byström, P. 2006. Recruitment pulses induce cannibalistic giants in Arctic char. J Anim Ecol 75: 434-444.
Byström, P., Andersson, J., Kiessling, A., and Eriksson, L.-O. 2006. Size and temperature dependent foraging capacities and metabolism: consequences for winter starvation mortality in fish. Oikos 115: 43-52.
Byström, P., Persson, L., and Wahlström, E. 1998. Competing predators and prey:
Juvenile bottlenecks in whole-lake experiments. Ecology 79: 2153-2167.
15
Claessen, D., De Roos, A. M., and Persson, L. 2000. Dwarfs and giants: Cannibalism and competition in size-structured populations. Am Nat 155: 219-237.
Claessen, D., Van Oss, C., De Roos, A. M., and Persson, L. 2002. The impact of size-dependent predation on population dynamics and individual life history.
Ecology 83: 1660-1675.
Feinsinger, P., Spears, E. E., and Poole, R. W. 1981. A simple measure of niche breadth. Ecology 62: 27-32.
Huss, M., Bystrom, P., Strand, A., Eriksson, L. O., and Persson, L. Influence of growth history on the accumulation of energy reserves and winter-mortality in young fish. Can J Fish Aquat Sci in press
Huston, M. A. and DeAngelis, D. L. 1987. Size bimodality in monospecific populations - A critical-review of potential mechanisms. Am Nat 129: 678-707.
Lappalainen, J., Erm, V., Kjellman, J., and Lehtonen, H. 2000. Size-dependent winter mortality of age-0 pikeperch (Stizostedion lucioperca) in Pernu Bay, the Baltic Sea. Can J Fish Aquat Sci 57: 451-458.
Linton, L. R., Davies, R. W., and Wrona, F. J. 1981. Resource utilization indexes - an assessment. J Anim Ecol 50: 283-292.
Patterson, B. D. 1983. Grasshopper mandibles and the niche variation hypothesis.
Evolution 37: 375-388.
Persson, L. 1993. Predator-mediated competition in prey refuges: the importance of habitat dependent prey resources. Oikos 68: 12-22.
Persson, L., Byström, P., and Wahlström, E. 2000. Cannibalism and competition in Eurasian perch: population dynamics of an ontogenetic omnivore. Ecology 81: 1058- 1071.
Persson, L., Claessen, D., De Roos, A. M., Byström, P., Sjörgren, S., Svanbäck, R., Wahlström, E., and Westman, E. 2004. Cannibalism in a size-structured population:
Energy extraction and control. Ecol Monogr 74: 135-157.
Persson, L. and De Roos, A. M. 2006. Food-dependent individual growth and
population dynamics in fishes. J Fish Biol 69: 1-20.
I NTRODUCTION
Persson, L. and Greenberg, L. A. 1990. Optimal foraging and habitat shift in perch (Perca fluviatilis) in a resource gradient. Ecology 71: 1699-1713.
Post, D. M., Kitchell, J. F., and Hodgson, J. R. 1998. Interactions among adult demography, spawning date, growth rate, predation, overwinter mortality, and the recruitment of largemouth bass in a northern lake. Can J Fish Aquat Sci 55: 2588- 2600.
Post, J. R. and Evans, D. O. 1989. Size-dependent overwinter mortality of young-of- the-year yellow perch (Perca flavescens): laboratory, in situ enclosure, and field experiments. Can J Fish Aquat Sci 46: 1958-1968.
Pulliam, H. R. 1974. Theory of optimal diets. Am Nat 108: 59-74.
Schultz, E. T. and Conover, D. O. 1997. Latitudinal differences in somatic energy storage: adaptive responses to seasonality in an estuarine fish (Atherinidae: Menidia menidia). Oecologia 109: 516-529.
Sogard, S. M. and Olla, B. L. 2000. Endurance of simulated winter conditions by age-0 walleye pollock: effects of body size, water temperature and energy stores. J Fish Biol 56: 1-21.
Svanbäck, R. and Bolnick, D. I. 2005. Intraspecific competition affects the strength of individual specialization: an optimal diet theory method. Evol Ecol Res 7: 993- 1012.
Svanbäck, R. and Bolnick, D. I. 2007. Intraspecific competition drives increased resource use diversity within a natural population. Proc R Soc Lond B 274: 839-844.
Taper, M. L. and Case, T. J. 1985. Quantitative genetic models for the coevolution of character displacement. Ecology 66: 355-371.
Thompson, J. M., Bergersen, E. P., Carlson, C. A., and Kaeding, L. R. 1991. Role of size, condition and lipid content in the overwinter survival of age-0 Colorado squawfish. Trans Am Fish Soc 120: 346-353.
Thorpe, J. E. 1977. Daily ration of adult perch, Perca fluviatilis l During summer in Loch-Leven, Scotland. J Fish Biol 11: 55-68.
17
Urbatzka, R., Beeck, P., Van der Velde, G., and Borcherding, J. 2008. Alternative use of food resources causes intra-cohort variation in the size distribution of young- of-the-year perch (Perca fluviatilis). Ecol Freshwat Fish 17: 475-480.
Van Valen, L. 1965. Morphological variation and width of ecological niche. Am Nat 99: 377-389.
Werner, E. E. and Hall, D. J. 1974. Optimal foraging and the size selection of prey
by the bluegill sunfish (Lepomis macrochirus). Ecology 55: 1042-1052.
C HAPTER I
Making the best of it: how the necessity to use alternative food resources induces cannibalism
Lisa Heermann 1 , Werner Scharf 1 , Gerard van der Velde 2,3 and Jost Borcherding 1
1
University of Cologne Zoological Institute, General Ecology and Limnology, Research Station Grietherbusch, 46459 Rees-Grietherbusch, Germany
2
Radboud University Nijmegen, Institute for Wetland and Water Research, Department of Animal Ecology and Ecophysiology, Toernooiveld 1, 6525 ED, The Netherlands
3
National Natural History Museum Naturalis, P.O. Box 9517, 2300 RA Leiden, The Netherlands
C HAPTER I
Abstract
Cannibalism in fish has various effects at population as well as at individual level.
Cannibals derive direct energetic benefit from cannibalism by feeding on their smaller conspecifics, while at the same time reducing competition for the shared resource. Avoiding intra-cohort competition can force fish to use alternative feeding strategies and hence leads to greater specialisation within the population, which may subsequently stimulate cannibalism. The present study examined specialisation and intra-guild cannibalism by young-of-the-year (YOY) perch (Perca fluviatilis) after hatching in four experimental ponds. As zooplankton levels decreased, YOY perch started to specialise, suggesting that increased intraspecific competition forced fish to try alternative feeding strategies. Larger YOY perch then fed on energetically richer resources (bream larvae and tadpoles) and hence outgrew their smaller conspecifics, becoming large enough to enable cannibalism. Thus, the widening of initial size differences by feeding on bream and tadpoles served as a stepping stone towards cannibalism. This differentiation into two size classes and two different feeding strategies was shown to be a stable pattern within the YOY perch population, as indicated by stable isotope analyses.
21
Introduction
Cannibalism occurs in a wide range of animals (Polis 1981) and has also been shown to occur in many fish species, such as pikeperch (Sander lucioperca) (Lappalainen et al. 2006) and Artic char (Salvelinus alpinus) (Byström 2006). Most of the studies focused on interguild cannibalism (Claessen et al. 2000; Persson & De Roos 2006), although intraguild cannibalism has been documented as well (Brabrand 1995;
Urbatzka et al. 2008). Cannibalism has various effects at the population as well as individual levels. Cannibalistic populations might exist where a non-cannibalistic population would go extinct (see "life boat mechanism": Vandenbosch et al. 1988) and the existing population size distribution might be affected by cannibals (Claessen et al. 2000; 2002). Cannibals were often shown to share a resource with their victims, which means that not only predator-prey interactions, but also intraspecific competition (Claessen et al. 2000; 2002) may affect interactions with their prey.
Cannibals derive direct energetic benefit from cannibalism by feeding on their conspecifics while at the same time reducing competition for shared resources (Claessen et al. 2000; 2002; Byström 2006). Recent studies have focused on the combined effects of intraspecific competition and cannibalism, showing that large individuals, so-called “giants”, can develop under certain conditions (Persson et al.
2000; 2004; Byström 2006).
If animals start to feed on their young-of-the-year (YOY) siblings early in the year, when these are still relatively small, these cannibals are able to control the number of their smaller siblings and thus diminish intraspecific competition for the shared resource. However, the lower energetic value of small fish means that the cannibals do not develop into giants. 'If they become cannibalistic later in the year, when their YOY siblings have reached larger sizes, they derive greater energetic benefit from their cannibalism. In this situation, however, cannibals are not able to control their siblings and reduce the intraspecific competition for the shared resource. Thus, they take the risk of being outcompeted by their smaller siblings, but are able to reach high growth rates due to the high energy uptake when feeding on large siblings.
Hence, only a few individuals become giants (Claessen et al. 2000). Empirical
evidence for these suggestions was found in Arctic char populations, where within a
strong recruit cohort, some individuals escaped competition when they started to
C HAPTER I
cannibalise. These individuals accelerated their growth and developed into giants (Byström 2006).
Intra-cohort competition might not only enhance cannibalism but might also lead to greater specialisation within the population (Bolnick 2001), since individual diet specialisation has been shown to reduce intraspecific competition (Svanbäck &
Persson 2004; Svanbäck & Bolnick 2007). Niche differentiation is related to a number of factors, such as ontogenetic niche shifts (Werner & Gilliam 1984), polymorphisms (Skúlason & Smith 1995) and individual-level variation (Bolnick et al. 2003).
In this study we focused on specialisation and intra-guild cannibalism by young-of- the-year (YOY) perch (Perca fluviatilis). If high competition for the preferred resource leads to individual diet specialisation, some individuals might be favoured in terms of growth due to the fact that they specialise on a more energetic resource.
This growth acceleration might then enable cannibalism, producing a few large individuals (giants). To test these hypotheses, four experimental ponds were stocked with either adult perch or a combination of adult perch and bream (Abramis brama).
The offspring and the abundance of food resources were monitored to examine the mechanisms behind the development of early piscivory and intra-guild cannibalism.
23
Materials & Methods
Experimental set-up
Field experiments were conducted in four ponds laid out in a single line, indicated in the paper as P1, P2, P3 and P4, and connected via overflows (0.4 – 0.7 ha) at a fish farm in Lohmar, Germany (50°49’34.00’’N 7°12’59.42). To prevent fish from passing from one pond to the next, the overflows were blocked by nets. The ponds have a maximum depth of 2 m. The water is oligotrophic to mesotrophic with a submerged helophyte and nymphaeid macrophyte vegetation (Urbatzka et al. 2008).
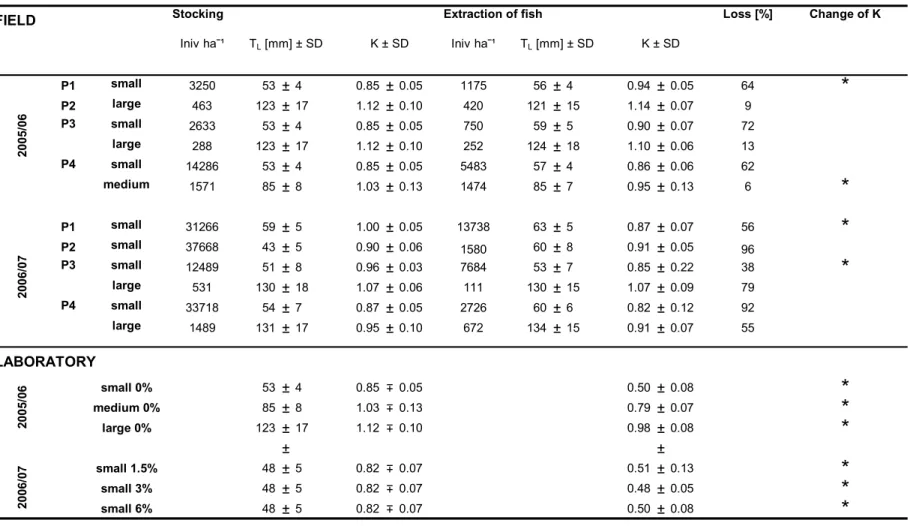
Since these ponds have a relatively flat and shallow bottom, no clear differentiation exists between a littoral and a pelagic zone. The ponds were fishless before they were stocked with adult perch and bream in April 2006. All ponds were stocked with 12 to 17 kg perch ha -1 (25 to 36 individuals per pond). P3 and P4 were additionally stocked with adult bream (75 kg ha -1 / 23 individuals in P3 and 82 kg ha -1 / 32 individuals in P4). Before stocking, the length of each fish was documented. Total length (TL) of perch ranged from 19 to 33 cm and that of bream from 45 to 64 cm. In P1, a population of topmouth gudgeon (Pseudorasbora parva), an invasive exotic fish species, established, in addition to the perch, probably by introduction via a creek.
Sampling
Zooplankton and macroinvertebrates were sampled every two and four weeks,
respectively. Within one hour during the daytime, six samples of zooplankton were
taken at different representative spots in the pond, using a Schindler-Patallas trap
(mesh size 100 µm) and preserved in ethanol 96%. Under the stereomicroscope,
individuals were counted and identified to genus level. Ten randomly chosen
individuals per sample were measured to the nearest 0.01 mm. Published length-mass
equations (for further details see Heermann & Borcherding 2006) were used to
calculate the biomass (mg wet weight l -1 ). Macroinvertebrates in the sediment were
sampled with a Birge–Eckmann grab at three representative spots in the pond and
sieved through a net of 1 mm mesh size. Macroinvertebrates living in the vegetation
(submersed and emerged vegetation) were sampled with a dip net (mesh size 1 mm)
at three spots distributed over the pond. To this end, the dip net was repeatedly
moved along a 0.5 x 0.3 x 1 m section through representative parts of the vegetation
near the shore (Heermann et al., unpublished data). Samples taken from the
C HAPTER I
vegetation and the pond sediment were preserved in ethanol 96%; numbers were counted and ten randomly chosen individuals per sample were measured to the nearest 0.1 mm. We determined the biomass from published length-mass equations as described above and expressed it as g wet weight m -2 for the sediment samples and as catch per unit of effort (CPUE) [g section -1 ] for the samples from the vegetation.
After the perch had hatched (at the beginning of May), the offspring was monitored first weekly, then biweekly from mid-June on using electro-fishing and gillnetting with multi-mesh-sized gillnets (for further details see Scharf et al., in press). In mid- October 2006, all fish were extracted from the ponds, all ponds being emptied completely to measure the total wet weight biomass of fish per pond. All fish were weighed before three to four subsamples (about 200 to 700 fish per sample) were taken to measure the fish (to the nearest 0.5 mm), in order to obtain a length- frequency distribution (LFD). Length-weight regressions of these data and the total wet weight biomass of fish per pond were used to calculate the number of individuals per pond.
During the season, fish were deep-frozen immediately after catching for stomach content analyses. Length (TL) (to the nearest 0.5 mm) and wet weight (to the nearest 0.01 g) were recorded and the stomach content of 8 to 40 perch was analysed. To this end, perch were dissected under a stereomicroscope and the stomach was weighed full and empty using a high-precision balance to the nearest 0.01 mg. Stomach contents were identified to genus level, and the food spectrum of each perch was expressed as the weight percentage composition of food items identified to genus level. The diet items were counted per genus, and ten individuals per genus were measured. Published length-mass equations were again used to calculate the wet weight of the content. To detect early length-dependent differences in the use of food resources by perch, their stomach content was analysed separately for small and large perch at each sampling date. Perch smaller than the calculated mid-value (mean of the smallest and the largest individual) were assigned to the small size-cohort, while the others were assigned to the large size-cohort. Finally, the index of stomach fullness (Hyslop 1980) for each fish was calculated to describe the wet weight of the prey as a percentage of the perch’s wet weight. The LFD of the perch population in each pond was used to calculate the 5% and 95% percentiles of the perchs’ size distribution at each sampling date.
25
Stable isotope analysis
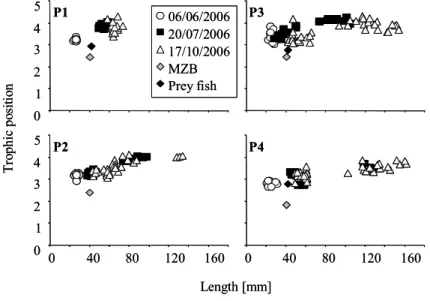
Additional fish, macroinvertebrate and zooplankton samples were taken and immediately deep-frozen for stable isotope analyses. Perch were sampled on 6 th June, 20 th July and 17 th October, while bream larvae were sampled only in pond 4 on 6 th June. Topmouth gudgeon larvae in P1 were sampled on 6 th June. Macroinvertebrates were sampled on 22 nd June, 30 th July and 13 th September in all ponds. Zooplankton samples with sufficient material for stable isotope analysis were taken on 6 th June and 28 th June in P1, on 6 th June and 20 th July in P2, on 28 th August in P3 and on 20 th July in P4.
Plankton samples were cleared of algae and non-zooplanktic organisms before pooling the six zooplankton samples from one pond. The six macroinvertebrate samples from one pond were treated in the same manner. Fish smaller than 40 mm were used whole, while fish from 41 to 80 mm were decapitated and gutted and the fins were removed, and only the muscle tissue was used from fish larger than 81 mm.
When fish were very small, 2 to 3 fish from one sampling date had to be pooled to obtain enough material. Prey fish, bream larvae and topmouth gudgeon larvae were separately pooled in the same way. After drying at 70°C for 48 h, the fish, zooplankton and macroinvertebrates were ground to a fine powder using a mortar and pestle and liquid nitrogen. The stable carbon and nitrogen isotopes composition was assessed with a Carlo Erba NA 1500 elemental analyser and a Thermo Finnigan DeltaPlus mass spectrometer. Carbon and nitrogen isotopic ratios are expressed in delta notations (δ 13 C and δ 15 N), defined as the parts per thousand (‰) deviation from a reference material:
δ 13 C or δ 15 N = ((R sample /R standard ) – 1) × 1000 where R = 13 C/ 12 C or 15 N/ 14 N.
IEAE-N-2, ammonium sulphate and IAEA-CH-6, sucrose served as reference materials. The standard deviation of replicates of the reference material was 0.6% for δ 15 N and 1.4% for δ 13 C.
The trophic position of each perch and of the food resources was estimated according
to the method developed by Vander Zanden & Rasmussen (1999), which involves
first calculating a general baseline curve for the primary consumers. This then allows
the measured δ 15 N to be corrected and the trophic position to be calculated. In this
study we focused on the zooplankton data representing the primary consumers, since
the zooplankton included no predatory species.
C HAPTER I
Data analysis
The degree of specialisation of the perch population was calculated with DietA1 (Guimarães et al. 2006), which is based on niche pairwise overlap between individuals (Schoener 1968). An index of 1 reflects no inter-individual overlap within the population, while an index of 0 indicates that all individuals use the same resource (for further details see Bolnick et al. 2002). The index of specialisation (E) was then regressed with the mean biomass of zooplankton, the mean index of stomach fullness (ISF) and the size difference (5% percentile-95% percentile). One- way ANOVA was used to test for significant distinctions in the size difference of perch (based on the 5% and 95% percentiles) for each pond. We also used one-way ANOVA to test for differences in the index of specialisation (E) between the perch populations in the ponds. All analyses were performed with SPSS 15.0 (SPSS Corp.).
27
Results
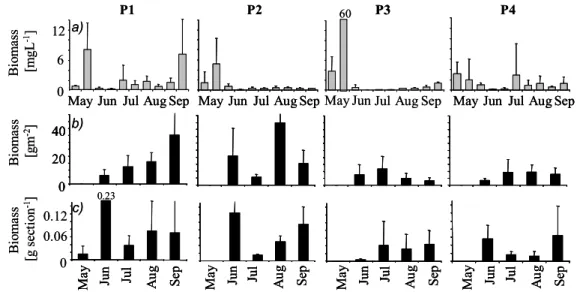
At the beginning of June, zooplankton biomass greatly decreased in all ponds, to an average level (± SD) of about 0.64 ± 0.33 mg wet weight l -1 , and remained at low levels from then on in nearly all cases (Fig.1). It was not until a few weeks later, in mid-July, that the biomass of macroinvertebrates living in the vegetation also decreased, to an average (± S.D.) of 0.03 ± 0.01 g wet weight section -1 (Fig. 1), except for P3, where the biomass had been low ever since the beginning of the season. After this decrease in most ponds, the macroinvertebrate biomass remained at a low level. Macroinvertebrates in the sediment did not show a clear general pattern in their biomass changes over time (Fig.1).
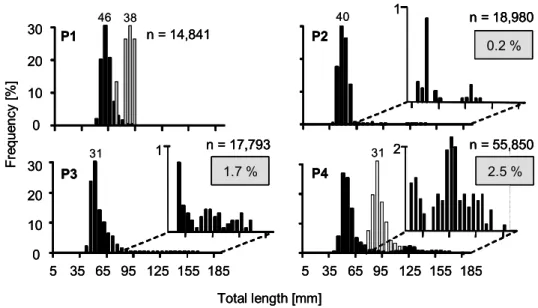
Figure 2 shows the LFD of YOY perch, YOY bream and topmouth gudgeon in the fish extracted from the ponds in mid-October. YOY perch in P3 and P4 had developed a bimodal size distribution. In P3, 1.7 % of the YOY perch individuals (25% of the YOY perch biomass in the pond) formed the large size-cohort (> 100 mm TL), growing to sizes of up to 165 mm. In P4, 2.5 % of the YOY perch individuals (28% of the YOY perch biomass) reached sizes of up to 185 mm TL. In P2, few perch (0.2% of the YOY perch individuals, 5% of the YOY perch biomass) grew to larger sizes, up to 140 mm TL. In P1, the YOY perch population remained unimodal, with lengths of YOY perch ranging from 50 to 90 mm TL (Fig. 2).
igure 1: (a) Mean biomass of zooplankton [mg wet weight l
-1± SD] and macrozoobenthos (MZB) (b)
B io m ass [mg L
-1]
P2 60 P3 P4
Bi om as s [g m
-2]
0
Bi om as s
-1[g s ec tio n ] 0.06 0
20 40 40
0 20 40
0.12
May Ju n Ju l Au g Se p
b)
c)
May Ju n Ju l Au g Se p
May Ju n Ju l Au g Se p
May Ju n Ju l Au g Se p
P1
0 6 12 a)
May Jun Jul Aug Sep May Jun Jul Aug Sep May Jun Jul Aug Sep May Jun Jul Aug Sep
0.23
B io m ass [mg L
-1]
P2 60 P3 P3 P4
Bi om as s [g m
-2]
0
Bi om as s
-1[g s ec tio n ] 0.06 0
20 40 40
0 20 40
0.12
May Ju n Ju l Au g Se p
May Ju n Ju l Au g Se p
b)
c)
May Ju n Ju l Au g Se p
May Ju n Ju l Au g Se p
May Ju n Ju l Au g Se p
May Ju n Ju l Au g Se p
May Ju n Ju l Au g Se p
May Ju n Ju l Au g Se p
P1
0 6 12 a)
May Jun Jul Aug Sep
May Jun Jul Aug Sep May Jun Jul Aug Sep May Jun Jul Aug Sep May Jun Jul Aug Sep May Jun Jul Aug Sep May Jun Jul Aug Sep
0.23
F
sampled from the bottom [g wet weight m
-2± SD] and (c) caught in the vegetation [g wet weight
section
-1± SD] at the beginning and in the middle of each month in all ponds.
C HAPTER I
P3 P4
Total length [mm]
5 35 65 95 125 155 185 1 2
0 10 20 30
1 n = 14,841
5 35 65 95 125 155 185
F re qu ency [ % ]
0 10 20 30
P2
n = 18,980 0.2 %
n = 17,793 1.7 %
n = 55,850 2.5 % P1
46 38 40
31 31
P3 P4
Total length [mm]
5 35 65 95 125 155 185 1 2
0 10 20 30
1 n = 14,841
5 35 65 95 125 155 185
F re qu ency [ % ]
0 10 20 30
P2
n = 18,980 0.2 %
n = 17,793 1.7 %
n = 55,850 2.5 % P1
P3 P4
Total length [mm]
5 35 65 95 125 155 185 1 2
0 10 20 30
1 n = 14,841
5 35 65 95 125 155 185
F re qu ency [ % ]
0 10 20 30
P2
n = 18,980 0.2 % n = 18,980
0.2 %
n = 17,793 1.7 % n = 17,793
1.7 %
n = 55,850 2.5 % n = 55,850
2.5 % P1
46 38 40
31 31
![Figure 4: Stomach content [%] of two size classes of YOY perch throughout the season. Where data are missing not enough perch were available for analyses.](https://thumb-eu.123doks.com/thumbv2/1library_info/3639762.1502642/30.892.119.721.231.780/figure-stomach-content-classes-season-missing-available-analyses.webp)
![Figure 7: (A) Index of specialisation [E] plotted against the mean zooplankton biomass [mg wet weight l -1 ] and (B) mean index of stomach fullness of YOY perch at all sampling dates](https://thumb-eu.123doks.com/thumbv2/1library_info/3639762.1502642/32.892.170.659.878.1058/figure-specialisation-plotted-zooplankton-biomass-stomach-fullness-sampling.webp)
![Figure 8: Size differences between the 5% and 95% percentiles of the length-frequency distribution of the YOY perch population plotted against the index of specialisation [E] for all sampling dates](https://thumb-eu.123doks.com/thumbv2/1library_info/3639762.1502642/33.892.276.681.322.500/figure-differences-percentiles-frequency-distribution-population-specialisation-sampling.webp)
![Figure 1: Mean daily air temperature [°C] ( ) and minimal and maximal air temperature [°C]](https://thumb-eu.123doks.com/thumbv2/1library_info/3639762.1502642/48.892.110.731.473.824/figure-mean-daily-air-temperature-minimal-maximal-temperature.webp)
![Figure 2: Fat, glycogen and protein [g] of perch of different body lengths before the experiment ( ) and after having been fed with Cyclops spp](https://thumb-eu.123doks.com/thumbv2/1library_info/3639762.1502642/55.892.172.789.99.479/figure-glycogen-protein-different-lengths-experiment-having-cyclops.webp)
