Review article:
TOLUENE DIISOCYANATE (TDI) AIRWAY EFFECTS AND DOSE- RESPONSES IN DIFFERENT ANIMAL MODELS
Thomas Schuppa*, Michael A. Collinsb
a BASF Polyurethanes GmbH, Product Safety, Ecology and Toxicology, Elastogranstrasse 60, 49448 Lemfoerde, Germany
b International Isocyanate Institute, Inc., Bridgewater House, Whitworth Street, Manchester M1 6LT, UK
* corresponding author: schupp.diepholz@gmx.de
ABSTRACT
Many inhalation exposure studies have been performed with toluene diisocyanate (TDI) in different animal species. Many were targeted at respiratory irritation and/or sensitisation. As there is still no broadly accepted guideline for the performance of respiratory sensitisation tests, protocols used and endpoints investigated are numerous. In this review we collected da- ta from those respiratory sensitisation and/or irritation studies that provided threshold or dose- response information. Against this aim, and as TDI is a model substance for a respiratory sen- sitiser, a great number of mechanistic studies are not cited in this paper, although they were checked for relevant information. The literature data available allow the conclusion that both respiratory irritation and sensitisation may be interdependent, and both irritation and sensitisa- tion by TDI is a threshold phenomenon. Across species, the majority of NOAECs for respira- tory sensitisation are in the range of 0.005 to 0.03 ppm, whereas the LOAEC is about 0.02 to 0.4 ppm.
Keywords: Toluene diisocyanate, respiratory sensitisation, animal models, asthma
INTRODUCTION
New onset asthma caused at the work- place (Occupational asthma, OA) has be- come a significant global concern. In the EU respiratory sensitizers are controlled by legislation and specifically included for warning by the hazard statement ”H334 May cause allergy or asthma symptoms or breathing difficulties if inhaled” according to regulation 1272/2008/EC, and by risk phrase “R42 May cause sensitisation by in- halation” according to directive 67/548/EC.
Although many predictive models have been evaluated, there is as yet no interna- tionally recognized animal method for iden- tification of respiratory sensitisation. In practice the majority of respiratory sensitis- ers have been identified through occupa-
tional studies and worker experience. For example, in the case of diisocyanates, tolu- ene diisocyanate (TDI) was first reported as an asthmagen by Fuchs and Valade (1951).
Now there is widespread experience and recognition that diisocyanates, as a chemi- cal class, can be respiratory sensitisers in man.
There is an increasing understanding that respiratory sensitisation must be a threshold phenomenon, that is to say there is a no-effect level for both the induction and elicitation stages (Arts et al., 2006).
The factors affecting the thresholds are multiple (Kimber, 1996), and include the potency of the chemical itself, the route of exposure, the extent, duration and frequen- cy of exposure as well as other factors in-
cluding genetic susceptibility and other un- derlying disease conditions.
The purpose of this review is to exam- ine the existing dataset for the diisocyanate TDI, to identify where the data show a threshold or dose-response for either induc- tion or elicitation of respiratory hypersensi- tivity.
It should be noted that commercially used TDI is mostly an isomer mixture of 80:20 2,4-TDI:2,6-TDI. In the following text, “TDI” can mean both, the pure 2,4- isomer or the 80:20 mixture. In commercial use, the 65:35 isomer mixture as well as the pure 2,4-TDI are used in much lower amounts. As can be deduced from some of the publications cited, both isomers seem to be equipotent in terms of irritation and sen- sitisation.
MATERIALS AND METHODS We searched TOXLINE with phrases
“(Toluene diisocyanate OR TDI) AND (respiratory OR lung) AND (guinea pig OR mouse OR rat OR rabbit OR hamster)” up to and including June 2012. It is not the purpose of this paper to enter into the dis- cussion of the most appropriate animal model. Here, experiences with TDI in dif- ferent animal models with the focus on dose-response and/or threshold are summa- rized. The emphasis is on in-vivo studies, where at a minimum the challenge step was performed by inhalation. Other studies are cited only if they provide valuable input to the dose-response and threshold discussion.
The data will be assessed for possible ap- plication to human risk assessment.
Some publications provided data that would allow calculation of a benchmark dose, but did not mention NOAECs or LOAECs. In these cases, we analyzed the data by applying the Benchmark Dose Software version 2.2 (US EPA, 2011). For the goodness of fit, we chose a value P ≥ 0.1. In the computation, the program was set to generate the 10 % effect level above background (BMD10) and its lower 95 % confidence limit (BMDL10). When more than one dose-response model generated an
acceptable fit to the experimental data, but BMD values differed by more than a factor of 3, model output with low Akaike’s In- formation Criterium (AIC) was preferred (US EPA, 2011).
Technical aspects of sensitisation proto- cols
Protein conjugates
Sensitising agents are classified as be- ing either low or high molecular weight. In fact the distinction is more realistically be- tween very high and lower molecular weight, in that the high molecular weight sensitisers include animal protein, flour, wood dust, pollen etc. Low molecular weight allergens are usually chemicals with molecular weights below the 1500 kDa lev- el. For TDI it is assumed that protein forms modified endogenously by binding of TDI molecules are involved in the response, and not TDI alone. It has often been found that obtaining a response to the parent molecule (TDI) may be difficult, whereas using a modified TDI-albumin protein will be ef- fective. In several reports of animal models the abbreviation TDI-GSA or TDI-conju- gate may be used, where GSA stands for guinea-pig serum albumin (or other letter- species abbreviations as appropriate).
Further, for small molecules that show some water solubility and/or tissue reactivi- ty, it is likely that the target tissue – bron- chiole – is not readily reached in the obli- gate nose-breathing rodents. Aerosols of protein-conjugates are much less likely scrubbed out in the nose.
Some investigators maintain that the use of conjugates for challenge is inappropriate as it represents an artificial challenge pro- cess that cannot happen normally and so circumvents natural in vivo processes.
Dose routes and exposure regimens
It has long been suggested that induc- tion by dermal contact is effective for res- piratory sensitisation including TDI using laboratory animals (Karol et al., 1981; Rat- tray et al., 1994). This allows the researcher to avoid technically difficult and costly in-
halation exposures. It is fundamental that the challenge procedure should be a respira- tory one. This may be relatively easy for volatile substances, but for non-volatile liq- uids, solids and high molecular weight al- lergens, this can be remarkably difficult.
The intratracheal route has been used re- cently in mouse respiratory sensitisation studies which eliminates the need for res- piratory exposures (Driscoll et al., 2000).
However, the technique has the disad- vantage of delivering a large bolus of test material at one time and usually within a solvent. This potentially overloads any lo- cal systems in the upper lung. While this may be useful for hazard identification pur- poses, this technique is so out of step with occupational exposure that its use in risk assessment to humans must be questiona- ble, at least in terms of dose-response and thresholds.
Numbers of responders
It is clear that even within the genetical- ly homogenous test animal groups, individ- uals may react differently to a stimulus.
This is apparent even in hazard evaluation of skin and respiratory sensitisation, where results depend on number of responders in a group as well as the intensity of a response.
Consequently some data include the num- ber of responders and give displays of the individual response levels in the groups.
With such datasets group means and stand- ard errors are less helpful than numbers re- sponding in a group.
Irritation
In sensitisation studies of skin, distin- guishing between signs of irritation and signs of sensitisation have remained prob- lematical. Both can result in similar lesions.
Even the local lymph node assay (LLN), which is an assessment of induction meas- uring cell division in a lymph node, has dif- ficulty discriminating between irritation and sensitisation (McGarry, 2007). The newer techniques of cytokine profiling and gene regulation arrays demonstrate better ability to discriminate, although this is by no means settled. Indeed, many chemicals may
have both irritant and sensitising activity, including TDI. A respiratory irritant may cause cough and rhinitis and these signs may also be encountered in the sensitisation response. In addition respiratory irritants reduce breathing rates in rodents, effective- ly lowering the dose.
For this report, a sensitisation protocol is one in which there is a challenge to the lung with TDI. The exception is the LLN assay which is an induction only protocol.
Studies in which the responsiveness of the lung to other stimuli – that is pharmacolog- ical or irritation – are taken as irritation studies.
Animal models – induction and elicitation The various animal models for as- sessing respiratory sensitisation have been reviewed by several authors (Kimber et al., 1996; Pauluhn and Mohr, 2005; Johnson and Luster, 2006; Arts and Kuper, 2007;
Pauluhn, 1996; Hoymann and Krug, 2001;
Regal, 2004; Boverhoff et al., 2008.).
Without reproducing the detailed accounts of these reviews, it can be noted that some tests assess either IgE or cytokine respons- es, that is to say induction. In this context the use of the mouse LLN assay for skin sensitisation is an induction test which has been positive when tested against most low molecular weight respiratory sensitisers. In the induction phase, the skin is repeatedly exposed against slightly or clearly irritating doses of the agent. Some researchers inves- tigated the non-specific hyperreactivity of the respiratory tract immediately after the induction phase. In tests for non-specific hyperresponsiveness, agonists of broncho- constriction like acetylcholine (ACh) or methacholine (MCh) or other, irritating substances are applied below their irritation threshold and the physiological response (bronchoconstriction, change in breathing patterns) is monitored. This non-specific challenge may also be tested after a recov- ery period - typically about 2 weeks - to avoid carry over from primary irritation.
Non-specific airway hyperresponsiveness (AHR) is one of the hallmarks of occupa- tional asthma.
Tests of elicitation, that is the response of the animal to challenge with the chemi- cal, are performed after a recovery period to avoid carry-over from irritant response.
Elicitation protocols have used guinea-pigs, rats or mice, with induction often by the dermal route, but occasionally by inhala- tion. Challenges may be either single or multiple. After challenge, the physiological response may be measured (breathing rate, tidal volume....or a combination of several of them, the enhanced pause (Penh)), and depending on the agent, pathophysiology and species, early (<= 1 h) or late (~ 16- 24 h) responses or both may be observed.
Another means to investigate pathological changes is the broncho-alveolar lavage (BAL) technique, where in the fluid gained (BALF) the total number and/or concentra- tion of polymorphnuclear neutrophils (PMNs), eosinophilic neutrophils (Eos), lymphocytes (Lymph), alveolar macro- phages (AM), protein and lactate dehydro- genase (LDH) may be elevated. Further- more in the LLN assay for dermal sensitisa- tion, the lung associated lymph nodes (LALN) may be investigated.
For the relevance of these different parama- ters for the evaluation of respiratory sensiti- sation and irritation, the reader is referred to the literature cited above.
RESULTS Guinea pig
a) Published data for guinea pig with dose-response regimes
Karol et al. (1980) used TDI as positive control for the investigation of p-toluene- isocyanate induced hyperreactivity in the guinea pig. A 3 h exposure to 0.25 ppm TDI for 5 consecutive days was irritating as demonstrated by reduced respiratory rate during exposure. A challenge concentration of 0.02 ppm for 30 min on days 11, 12, 22 and 23 was slightly irritating, causing a small reduction in respiratory rate. Howev- er, after challenge there was a slight in- crease of respiratory rate suggesting a pos- sible threshold for an elicitation response,
but there were insufficient data to show a dose-response.
Karol (1983) induced guinea pigs by 3 h/d exposure against 0.12 to 10 ppm TDI for 5 days. On day 22, challenge with TDI- GSA-adduct resulted in pulmonary hyper- sensitivity and increased levels of specific antibodies were present in animals induced with 0.36 ppm or higher. Whereas 0.12 ppm (TDI) for 3 h/5 d was regarded as min- imally irritating, 0.02 ppm for 15 weeks was described as non-irritating. Exposure against 0.02 ppm for 6 h/d over 70 days al- so did not result in increased antibody titre and pulmonary hypersensitivity. In this pa- per it was shown, that not all animals with increased IgG levels also showed a physio- logic response.
Botham et al. (1988) exposed groups of 10 guinea pigs against 0, 1, 3 or 4 ppm TDI for 3 h/d over 5 days. There was an increase in the group mean respiratory response to TDI-GSA challenge at about 23 or 30 days, but the changes were rather similar, indicat- ing that the response was already maximal at the 1 ppm concentration.
Six guinea pigs per dose were exposed against 0, 0.02, 0.2, 0.6 or 1.0 ppm TDI for 3 h/d for 5 consecutive days (Huang et al., 1993a). After 3 weeks, respiratory rate was measured after 15 min exposure against an aerosol containing 1 % TDI-GSA. At 0.02 ppm induction dose respiratory rate was indistinguishable from control. Specific antibodies were also undetectable in ani- mals exposed to 0.02 ppm TDI. At 0.2 ppm induction dose, 3 guinea pigs showed a weak increase in respiratory rate and one a moderate response.
In another experiment, Huang et al.
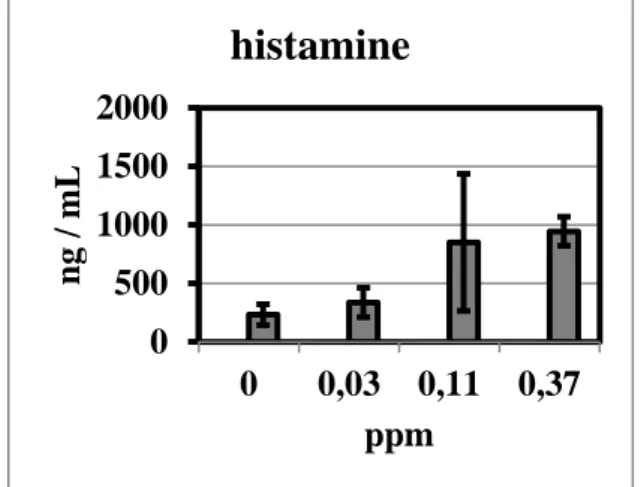
(1993b) exposed groups of 7 guinea pigs against 0, 0.03, 0.11 or 0.37 ppm TDI for 3 h/d for 5 days. On day 21, the animals were challenged with 0.37 ppm TDI for 30 min, and 30 min after end of challenge exposure, blood was collected and analysed for histamine content and mast cell degran- ulation index (MCDI). Neither histamine content nor MCDI were significantly ele- vated at 0.03 ppm induction dose. At
0.11 ppm, however, both parameters were significantly elevated.
In a parallel experiment, the induction dose for all groups was 0.37 ppm, and the challenge doses 0, 0.03, 0.11 or 0.37 ppm.
In this series, histamine content in blood and MCDI were significantly elevated at 0.11 ppm challenge dose and above, but not at 0.03 ppm.
Huang et al. (1993b) did not explicitely mention dose-response and thresholds;
therefore, we applied the Benchmark Dose Software to the data presented by the au- thors. As the histamine content in blood seemed to be most sensitive of those end- points investigated, the corresponding data from Huang et al. (1993b) are given in Fig- ure 1. When evaluated with the Benchmark Dose Software, the BMDL10 against elevat- ed histamine level is 0.028 ppm, similar to the NOAEC of the experiment. The data are consistent with a steep dose-response be- tween 0.03 and 0.11 ppm at which point the response is maximal.
Figure 1: Histamine content in guinea pig blood (mean + SD) 30 min after challenge with 0.37 ppm for 30 min, depending on induction dose
Six guinea pigs per dose were induced by inhalation of 0, 0.02, 0.2, 0.6 or 1.0 ppm TDI for 3 h/d on five consecutive days (Aoyama et al, 1994)., The animals were challenged with 0.02 ppm TDI for 15 min 21 days after the last exposure. The respira- tory rate was checked in whole-body ple- thysmographs during challenge and 60 min thereafter. After 0.02 ppm induction dose,
none of the six exposed animals showed a significant increased respiratory rate against control, whereas at 0.2, 0.6 and 1.0 ppm 6/6, 4/6 and 5/6 animals reacted; a positive reaction was a respiratory rate at or above control mean plus 3 standard deviations.
From 0.2 ppm and above there was no dose-response in absolute respiratory rate.
Ban et al. (1997) applied a variety of exposure regimes to groups of 5 guinea pigs. Group a received 3 ppm for 1 h.
Group b received 1 ppm for 2 h, group c was exposed against 1 ppm for 2 h on two consecutive days, group d and e received 0.066 or 0.11 ppm for 48 h and group f re- ceived 1 ppm for 3 h on five consecutive days. LALNs were analyzed at 0, 24 h, 48 h or 5 d after cessation of exposure. The total cell number and the percentage of dendritic cells was significantly increased in all groups without group d and e.
Amongst other dosing regimens, Pauluhn (1997) induced 8 guinea pigs per group intradermally (0.3 % TDI) on day 0, and via inhalation for 3 h to 0.5, 1.5, 3.5, 6.2 or 6.9 ppm TDI on days 0-4. On day 21 the animals were challenged with 0.067 ppm TDI for 30 min. Respiratory rate and flow derived parameters were analysed individually pre- and post-challenge; how- ever, a clear dose-response was not observ- able and the lowest dose led to pulmonary responses in some animals.
Pauluhn and Mohr (1998) induced 8 guinea pigs per group intradermally on day 0 and via inhalation against 0.5, 1.5, 3.9, 6.3 or 7.0 ppm TDI for 3 h/d over 5 days (amongst other exposure regimes). In this design, 0.5 ppm was mildly irritating and was used as the challenge concentration for 30 min on day 22. On day 28, the guinea pigs were challenged with 50 mg/m³ TDI- GSA-conjugate for 15 min. The TDI-GSA elicited an increased respiratory response in more animals than neat TDI. However, a convincing dose-response dependent on the inhalation induction concentration was not observed. The severity of respiratory re- sponse showed some correlation with the influx of eosinophils.
0 500 1000 1500 2000
0 0,03 0,11 0,37
ng / mL
ppm
histamine
Shiotsuka et al. (2000) induced guinea pigs with 1.35 ppm either 2,4- or 2,6-TDI for 3 h/d on five consecutive days. In week four and five, the animals were challenged with 0.018 to 0.046 ppm TDI for 60 min, followed by a 16 h monitoring of the res- piratory rate. In week six, the animals were challenged with aerosolized TDI-GSA con- jugate, and the respiratory rate was moni- tored. Maximum response to any challenge was in 50 % of the group. As there were exposure groups where the isomer was switched from induction to challenge, this study demonstrated the full cross-reactivity of 2,4- and 2,6-TDI.
b) Irritation protocols with guinea pig When exposed to 0.029 ppm TDI for 5 h per day for 20 days consecutively, the tracheal smooth muscle of guinea pigs ex- cised 20 h after cessation of exposure was hyperresponsive to carbachol, but not to beta-adrenergic agonists (McKay and Brooks, 1984).
Wong et al (1985) exposed 8 guinea pigs against 1.4 ppm TDI for 3 h/d on 4 consecutive days, and 24 guinea pigs against 0.02 ppm for 6 h/d 4 d/w for 14 w.
Ventilatory performance was tested before, during and after the exposure period by adding 10 % CO2 to the air. In the 1.4 ppm group, the CO2 challenge created an in- crease in the pressure change in the whole body plethysmograph – which is propor- tional to the tidal volume - , and histopatho- logically in 7/8 of the GP interstitial in- flammation as well as mild goblet cell hy- perplasia was observable. No changes against control were observed in the 0.02 ppm TDI group.
Exposure to 2 ppm TDI for 1 h caused a significant increase in non-specific airway hyperresponsiveness to ACh injection, bronchial epithelial injury and influx of eo- sinophils and PMNs in the airway mucosa of guinea pigs (Gordon et al., 1985). Ani- mals exposed to 1 ppm TDI for 1 h showed a similar increase in PMN-influx, but no statistically significant increase in airway hyperresponsiveness, although two animals
were much more responsive than the re- maining six of that group.
Miller et al. (1986) investigated the morphology and histology of the lower res- piratory tract of guinea pigs after inhalation of 0.030 or 0.26 ppm TDI for 5 h/d, 5 d/w for 2 w or 3.1 ppm TDI for 4 h/d for 5 d.
The two low exposure concentrations pro- duced a few slight alterations but no in- flammation, while the latter was evident after exposure to 3.1 ppm TDI.
Gagnaire et al. (1988) exposed guinea pigs against 1.2 ppm TDI for 4 h (A), 1.078 ppm (B) and 0.126 ppm (C) for 4 h on two consecutive days, 0.118 ppm for 48 h (D), 0.045 ppm (E) and 0.023 ppm (F) for 7 d continuously. All groups except C reacted with bronchial constriction to intravenously administered ACh 20 h after cessation of exposure. These results suggest some ele- ment of concentration * time (C * T) may be important, where T is the time interval of continuous exposure. The exposure regimen of 0.5 ppm * h (C * T = 0.126 ppm * 4 h) was without effect, and while it was not the lowest exposure concentration, the C * T product was the lowest used. For compari- son, exposure scenario F, with the lowest concentration (0.023 ppm) has a C * T product of 3.86 ppm * h.
Raulff et al. (1995) exposed guinea pigs for 2 h/d for 5 consecutive days against 0, 0.01, 0.02 or 0.03 ppm TDI. 1 h after the last exposure, animals were sacrified and BALF was investigated. Protein, macro- phages, lymphocytes, neutrophiles, throm- boxane B2 and prostaglandin D2 were un- affected; leucotrienes were increased with increasing dose, whereas eosinophils were significantly increased although inversely proportional to the dose.
Groups of 20 guinea pigs received 3 ppm TDI for one hour (Gagnaire et al., 1996). Half of a dose group was checked for ACh triggered airway hyperreactivity, and the other half was subjected to bron- chio-alveolar lavage at 0.5 h (a), 4 h (b), 24 h (c), 48 h (d) and 1 w (e) after expo- sure. Group f was exposed against 0.08 ppm for 48 h, and group g received 0.046 ppm for 1 w; 24 h after exposure,
groups f and g were analysed regarding non-specific hyperreactivity and BALF pa- rameters. Bronchial hyperresponsiveness to ACh was evident as early as 30 min after exposure, remained on nearly the same lev- el up to 48 h after exposure and declined to baseline values after 7 days. PMNs in BALF were significantly increased 4 h after exposure, peaked at 24 h, were still signifi- cant at 48 h and declined to baseline levels 7 d after exposure. Groups f and g also showed a clear non-specific bronchial hy- perresponsiveness 24 h after exposure;
PMNs in BALF, however, were not elevat- ed.
In a follow-up experiment, guinea pigs were exposed against 3 ppm TDI for 1 h or 0.03 ppm TDI for 8 weeks (Gagnaire et al., 1997). Bronchial hyperresponsiveness to ACh was increased in both groups 1 h after exposure. Pre-treatment with capsaicin eliminated the TDI-induced hyperrespon- siveness to ACh. Tachykinins released by sensory nerve fibres seem to play an im- portant role in TDI induced bronchial non- specific hyperreactivity, although the de- tailed mechanism remains obscure.
Huang et al. (1997) investigated isolated guinea pig trachea in tissue baths contain- ing different concentrations of MCh. When the lumen of the tracheas was perfused with air containing TDI, 0.02 or 0.07 ppm for 30 min resulted in an increased contractibil- ity upon MCh exposure, whereas 0.005 ppm were without effect. On epithe- lium-denuded trachea, 0.07 ppm TDI were without effect against control. Depletion of tachykinins by capsaicin-pretreatment did not prevent induction of hyperreactivity by exposure to 0.07 ppm TDI in the presence of intact epithelia.
Guinea pigs were exposed against 0, 0.0025, 0.005, 0.010 and 0.020 ppm TDI, MDI or HDI for 6 h/d, 5 d/w over 4 weeks (Marek et al, 1999). Directly after cessation of exposure, or after an 8 week recovery period, the trachea was prepared and its constriction in a physiological bath contain- ing ACh was measured. Animals exposed
to 0.01 and 0.02 ppm had a hyperreactive trachea. Animals sacrified after an 8 week recovery period did not have hyperreactive trachea.
c) Summary and conclusion guinea pig
In the following Tables 1a and 1b, some of the guinea pig studies are summarized. A selection was made with respect to concise, but sufficiently complete dose-response in- formation. For exposure regimes more or less representative of workplace exposure, about 0.02 ppm seems to be the threshold for induction and elicitation of specific air- way hyperresponsiveness as well as for immunological parameters such as LALN cells, histamine titre and mast cell degranu- lation index. A NOEC for non-specific hy- perresponsiveness to ACh or MCh directly after exposure to TDI is 0.005 ppm TDI.
Comparing data from Huang et al (1993b), Aoyama et al (1994) and Shiotsuka et al (2000) – all having the same induction re- gime and very similar elicitation protocols – indicates that high induction doses result in low elicitation LOAECs / NOAECs and vice versa. A similar relationship is de- scribed and discussed for skin sensitisers by Hostynek and Maibach (2004).
Mouse
a) Mouse studies with dose-response and/or threshold information against respiratory sensitisation C57BL/6 mice exposed to 0.02 ppm TDI for 4 h/d, 5 d/w for 6 weeks (Matheson et al., 2005). After 14 days without treat- ment, challenge against 0.02 ppm TDI for 1 h, they showed an allergic response evi- denced by airway inflammation, eosinophil- ia, increased PMNs and lymphocytes and goblet cell metaplasia. A further 24 h after TDI challenge, airway hyperresponsiveness was evident upon MCh challenge. Induc- tion with 0.5 ppm TDI once for 2 h did not trigger such responses after challenge.
Table 1a: Results of guinea pig studies: sensitisation
Reference Induction Challenge and endpoint investigated
NOAEC LOAEC
Karol et al., 1980
0.25 ppm, 3 h/d on 5 consecutive days
0.02 ppm for 30 min on days 11, 12, 22 and 23; respiratory rate
- 0.25 ppm
Karol, 1983 0.12 to 10 ppm; 3 h/d, 5 d (a); 0.02 ppm for 6 h/d, 5 d/w, 12 w (b)
1 % TDI-GSA-aerosol days 21 and 22, respiratory rate and antibody-titre
0.12 ppm (a);
0.02 ppm (b)
0.36 ppm (a);
Botham et al., 1988
0, 1, 3 or 4 ppm, 3 h/d, 5 d
TDI-GSA, days 23 and 30;
respiratory rate
- 1 ppm
Huang et al., 1993a
0, 0.02, 0.2, 0.6 or 1.0 ppm, 3 h/d, 5 d
Day 21, 1 % TDI-GSA aero- sol; respiratory rate
0.020 ppm 0.2 ppm Huang et al.,
1993b
0.03, 0.11 or 0.37 ppm , 3 h/d, 5d (a); 0.37 ppm, 3 h/d, 5d (b)
Day 21: 0.37 ppm, 30 min (a), or 0.03, 0.11 or 0.37 ppm (b). Histamine titre and mast cell degranulation index in whole blood
0.03 ppm (a, b) 0.11 ppm (a, b)
Aoyama et al., 1994
0.02, 0.2, 0.6, 1.0 ppm, 3 h/d, 5 d
Day 21, 0.02 ppm TDI for 15 min; respiratory rate during challenge and following 60 min
0.02 ppm 0.2 ppm
Ban et al., 1997
1 ppm, 1 h or 2 h;
1 ppm, 2 h/d, 2 d; 0.066 or 0.11 ppm for 48 h; 1 ppm, 3 h/d, 5 d
Cell number and percentage of dendritic cells in LALN at different time points after exposure
0.11 ppm, 48 h 1 ppm, 1 h
Pauluhn and Mohr, 1998
intradermal on day 0 and via inhalation to 0.5, 1.5, 3.9, 6.3 or 7.0 ppm TDI for 3 h/d over 5 days
0.067 ppm TDI, day 21; res- piratory rate before, during and following challenge
- 0.5 ppm
Shiotsuka et al., 2000
1.35 ppm, 3 h/d, 5 d Weeks 4, 5 (TDI) and 6 (TDI- GSA); respiratory rate over 16 h
- 0.018-
0.046 ppm TDI (elicitation)
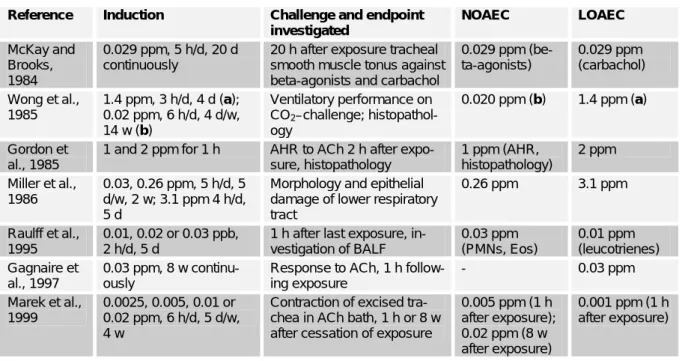
Table 1b: Selected results of guinea pig studies: irritation Reference Induction Challenge and endpoint
investigated
NOAEC LOAEC
McKay and Brooks, 1984
0.029 ppm, 5 h/d, 20 d continuously
20 h after exposure tracheal smooth muscle tonus against beta-agonists and carbachol
0.029 ppm (be- ta-agonists)
0.029 ppm (carbachol) Wong et al.,
1985
1.4 ppm, 3 h/d, 4 d (a);
0.02 ppm, 6 h/d, 4 d/w, 14 w (b)
Ventilatory performance on CO2–challenge; histopathol- ogy
0.020 ppm (b) 1.4 ppm (a)
Gordon et al., 1985
1 and 2 ppm for 1 h AHR to ACh 2 h after expo- sure, histopathology
1 ppm (AHR, histopathology)
2 ppm Miller et al.,
1986
0.03, 0.26 ppm, 5 h/d, 5 d/w, 2 w; 3.1 ppm 4 h/d, 5 d
Morphology and epithelial damage of lower respiratory tract
0.26 ppm 3.1 ppm
Raulff et al., 1995
0.01, 0.02 or 0.03 ppb, 2 h/d, 5 d
1 h after last exposure, in- vestigation of BALF
0.03 ppm (PMNs, Eos)
0.01 ppm (leucotrienes) Gagnaire et
al., 1997
0.03 ppm, 8 w continu- ously
Response to ACh, 1 h follow- ing exposure
- 0.03 ppm
Marek et al., 1999
0.0025, 0.005, 0.01 or 0.02 ppm, 6 h/d, 5 d/w, 4 w
Contraction of excised tra- chea in ACh bath, 1 h or 8 w after cessation of exposure
0.005 ppm (1 h after exposure);
0.02 ppm (8 w after exposure)
0.001 ppm (1 h after exposure)
Ban et al. (2006) induced and chal- lenged BALB/c mice by different inhala- tion, intratracheal and/or dermal regimes.
The mildest inhalation-only protocol, which was induction with 3 ppm TDI for 4 h for days 1-3 and challenge with 0.3 ppm for 4 h/d at days 9 and 14, caused a clear inflammatory response in the lung and goblet cell hyperplasia. This exposure and response is considered to be markedly above the LOAEC.
Arts et al. (2008) investigated into a respiratory lymph node assay, a pendant to the murine LLN assay for dermal sensitiz- ers. Exposures to TDI were at 7.4 mg/m³ for 45, 90, 180 or 360 min/d to BALB/c mice on three consecutive days. Three days after the last exposure mandibular (and au- ricular) lymph nodes were excised and DNA proliferation was quantified by in- corporation of ³H-thymidine. For TDI in- halation the interpolated ED3-value was about 300 mg*min/m³, equating to 0.63 mg/m³ or 90 ppb for an 8 h exposure.
This concentration * time regime is irritat- ing (see below). Histopathological altera- tions were confined to the upper respirato- ry tract.
b) Mouse studies with dose-response and/or threshold information against respiratory irritation The mouse is also used as a model for respiratory irritation. The protocols applied and endpoints covered, extend into sensiti- sation protocols and from a mechanistic point of view, as well as for interpretation of the sensitisation dose-response data, we thought it to be useful to include these studies.
Sangha and Alarie (1979) investigated the respiratory irritation of mice by TDI exposure. Mice were exposed for 3 h per day for 5 consecutive days and reduction of respiratory rate was measured directly after exposure. Concentrations of 0.023 ppm and higher resulted in a dose- dependent decrease of the respiratory rate, which became more prominent after re- peated exposure. Concentrations of 0.007 and 0.018 ppm did not produce a reduction
in respiratory rate, neither after the first nor after repeated exposures. The authors con- cluded that at concentration of 0.023 ppm TDI and above, administered over 3 h, re- sulted in damage that did not fully recover overnight. A 15 d exposure free period, however, was sufficient to set the response of previously exposed mice (up to 1.2 ppm for 5 h on three consecutive days) back to that of naïve mice. Increase of exposure time from 10 to 180 min resulted in higher reductions in respiratory rate. A further increase to 240 min did not create further reductions. From a plot for (% decrease in respiratory rate) against (log [TDI]) given in that paper it can be concluded, that the threshold for irritation is in the range of 0.01 to 0.02 ppm TDI for an exposure time of at least 180 min.
In a chronic inhalation study, 90 CD-1 mice per gender and dose were exposed to 0, 0.05 or 0.15 ppm TDI for 6 h/d, 5 d/w for up to 2 years (Owen, 1986). Over the whole term of the study, incidences for ne- crotic rhinitis were 0/90, 4/90 and 22/90 for males, and 0/90, 8/90 and 29/89 for females. When we analysed the data for rhinitis with the Benchmark Dose Software female mice were more susceptible than males against this endpoint, and for the different dose-response models the BMD10
ranges from 0.044 to 0.055 ppm, the BMDL10 from 0.032 to 0.035 ppm.
Zheng et al. (2004) exposed BALB/c mice against 0, 0.34, 0.86 or 1.38 ppm TDI for 4 h/d over 5 days. 20 h after the 1st , 3rd and 5th exposure BALF was analyzed for total cell count, macrophages, lympho- cytes, neutrophils and eosinophils. Satellite groups were used to investigate histopatho- logical changes as goblet cell metaplasia, eosinophilic infiltration and epithelial damage in trachea and bronchi. These his- topathological changes were graded cate- gorically as 0 = no change, 1 = very slight, 2 = slight, 3 = moderate to severe and 4 = severe. The onset and severity of histo- pathological changes correlated well with the earliest statistically significant increase and content of neutrophils and eosinophils in BALF. To generate dose-response in-
formation, we applied the Benchmark Dose Software to the data of Zheng et al.
(2004), using continuous models with BMR = Meancontrol + 1 STDcontrol.
The best fit was achieved with a poly- nom 2nd degree for neutrophils with BMD
= 0.096 ppm and BMDL = 0.07 ppm. For eosinophils, we got BMD = 0.132 ppm and BMDL = 0.092 ppm.
The influence of multiple challenges on endpoints was investigated by Vanoirbeek et al (2009). Interestingly, repeated chal- lenges can dampen the early respiratory response after intranasal challenge and the non-specific hyperresponsiveness against MCh 22 h thereafter. This finding is im- portant for the discussion of appropriate challenge protocols.
Lindberg et al. (2011) exposed mice against 0.15, 0.2 or 0.32 ppm TDI for 1 h/d over 5 d. The lowest dose was clearly irri- tating as detected by changes in respira- tion. The breathing frequency did not de- crease with repetition of exposure.
c) Summary of mouse data and con- clusion
Some mouse data are summarized in Table 2. With respect to dose-response, the mouse-database is smaller than that for guinea pigs. As well as for the guinea pig,
responses driven by irritation seem to be triggered at lower concentrations than re- sponses modulated by the adaptive im- mune system. For irritation, the threshold is around 0.02 ppm, and the data available indicated that prevention of irritation would perhaps prevent sensitisation by TDI. That would fit to the view presented by Matheson et al. (2002) and Johnson and Luster (2006), that inflammation is likely an early stage or a prerequisite for the de- velopment of TDI-induced asthma.
Rat
Pauluhn (2012) induced Brown- Norway rats dermally on day 0 and 7 with 1 % TDI in acetone-olive oil or vehicle alone (control). On days 20, 35 and 50 the animals were exposed to 70 mg/m³ for 30 min. This dose was chosen to achieve a minimal irritation of the lung. On day 65 the animals were challenged with either 1.5, 6, 20 or 70 mg/m³ TDI for 30 minutes.
One day after the challenge, BALF and LALN and histopathology were investigat- ed. For these protocol conditions 6 mg/m³ for 30 min was the NOAEC for elicitation in sensitized rats.
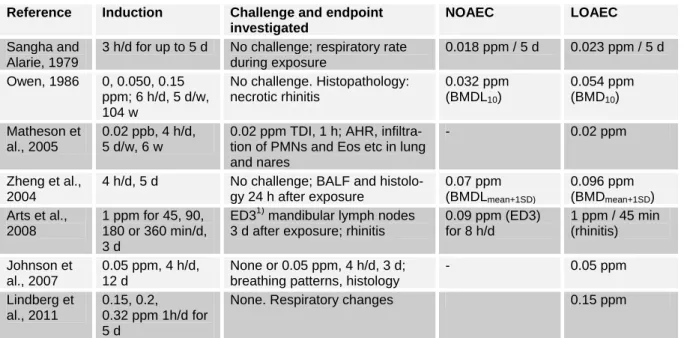
Table 2: Results of selected mouse studies showing irritation and sensitisation Reference Induction Challenge and endpoint
investigated
NOAEC LOAEC
Sangha and Alarie, 1979
3 h/d for up to 5 d No challenge; respiratory rate during exposure
0.018 ppm / 5 d 0.023 ppm / 5 d Owen, 1986 0, 0.050, 0.15
ppm; 6 h/d, 5 d/w, 104 w
No challenge. Histopathology:
necrotic rhinitis
0.032 ppm (BMDL10)
0.054 ppm (BMD10) Matheson et
al., 2005
0.02 ppb, 4 h/d, 5 d/w, 6 w
0.02 ppm TDI, 1 h; AHR, infiltra- tion of PMNs and Eos etc in lung and nares
- 0.02 ppm
Zheng et al., 2004
4 h/d, 5 d No challenge; BALF and histolo- gy 24 h after exposure
0.07 ppm (BMDLmean+1SD)
0.096 ppm (BMDmean+1SD) Arts et al.,
2008
1 ppm for 45, 90, 180 or 360 min/d, 3 d
ED31) mandibular lymph nodes 3 d after exposure; rhinitis
0.09 ppm (ED3) for 8 h/d
1 ppm / 45 min (rhinitis) Johnson et
al., 2007
0.05 ppm, 4 h/d, 12 d
None or 0.05 ppm, 4 h/d, 3 d;
breathing patterns, histology
- 0.05 ppm
Lindberg et al., 2011
0.15, 0.2, 0.32 ppm 1h/d for 5 d
None. Respiratory changes 0.15 ppm
1) lymph node stimulation 3-fold above control
Besides this single study, for the rat we did not find TDI inhalation sensitisation studies. The studies cited here are all irrita- tion protocols with repeated dose regimes.
Only a two-generation study, where rhini- tis was observed and evaluated, delivers some sensitisation dose-response infor- mation.
A 104 week cancer study where rats were exposed to 0.05 and 0.15 ppm TDI for 6 h/d, 5 d/w for 104 w, reported nasal irritation at the lowest dose (Owen, 1984).
As for the mouse, females were more sus- ceptible to TDI-induced rhinitis than males. We analysed the data with the Benchmark Dose Software and the BMD10
ranged from 0.016 to 0.028 ppm and the BMDL10 stretched over a range of 0.007 to 0.023 ppm. The logProbit model delivered a BMDL10 of 0.002 ppm, which was much lower than the corresponding BMD10 of 0.019 ppm and, therefore, has to be regard- ed with caution.
Male SD-rats were exposed to 0, 0.082, 0.184, 0.305, 0.664 or 1.087 ppm TDI for 4 h (Hesbert et al., 1991). BALF was col- lected 20 h after the end of exposure, and analyzed for neutrophils and macrophages as markers for inflammation. The number of neutrophils was increased in a dose- dependent manner, with the lowest dose being undistinguishable from the control, 0.184 ppm showing elevated, although sta- tistically non-significant levels and from 0.305 ppm onwards statistically very sig- nificant increases. The number of macro- phages in the BALF showed neither a dose-response nor was it significantly al- tered against the control. When the Benchmark Dose Software is applied to the data, setting the benchmark risk at the mean + one standard deviation of the con- trol, acceptable data fits can be generated with the Hill Model only (BMD = 0.2 ppm; BMDL = 0.16 ppm).
Bonnet et al. (1994) exposed SD-rats for 4 h or 7 d continuously to TDI. At the end of exposure, tracheae were excised and the mucociliary beat frequency and number of active regions investigated. The 7 d con- tinuous exposure was more critical than the
4 h exposure. In terms of reduced count of active regions and in terms of beating fre- quency, 0.020 ppm was the NOAEC for 7 d continuous exposure, whereas 0.05 ppm was the LOAEC. After a 7 d re- covery time, trachea of animals exposed to 0.05 ppm for 7 d showed normal activity, whereas animals exposed to 0.1 ppm still showed decreased activity.
In a two-generation study CD rats were exposed to 0, 0.02, 0.08 or 0.3 ppm TDI for 6 h/d and 5 d/w (Tyl et al., 1999). Ten animals per dose were subjected to histo- pathological investigation of the respirato- ry tract. The lowest dose, 0.02 ppm, still caused minimal to mild rhinitis in 3 F0 males and females, respectively. In the F1 generation, 7 of 10 males and 4 of 10 fe- males had minimal to moderate rhinitis.
The histopathological alterations were con- fined to the upper respiratory tract. We an- alysed the rhinitis as dichotomos data with the Benchmark Dose Software for the F0 generation. Data from males and females were combined, and we made no grading in terms of severity of the rhinitis. At con- centrations of 0, 0.02, 0.08 and 0.3 ppm, 1/20, 6/20 14/20 and 18/20 animals devel- oped rhinitis. Those models providing an acceptable fit to the data delivered values for the BMD10 around 0.007–0.01 ppb and for the BMDL10 of 0.003 to 0.007 ppm.
The logProbit model delivered a BMDL10
of 0.001 ppm, which is much lower than the BMD10 of that model, 0.007 ppm and therefore, should be regarded with caution.
Benchmark dose analysis was also per- formed for the F1 generation, but fits of curves were generally very poor. Only the logLogistic model delivered a P-value above 0.1 (0.1424) with a BMD of 0.0008 ppm and a BMDL of 2 x 10⁻⁸ ppm.
As was observed with mice (Lim et al., 2007), it might be that sensitised dams pass on a factor to offspring which increased susceptibility, affecting results.
In the F1 generation, rhinitis was more prevalent and the severity at the lowest dose was slightly increased.
SD-rats received inhalation exposures to doses of 0.01, 0.1 or 1.0 ppm TDI for
8 h (Pons et al., 2000). 18–24 h after expo- sure, rats were sacrified. At the highest concentration tested, there were no histo- logical lesions observable in the lung (loss of cilia, epithelial shedding). At 1.0 ppm, expression of CYP 2B1, but not 3A1 was depressed. Neither CYP 1A1 and 2E1 nor different GST iso-enzymes were induced.
Groups of 10 Wistar rats per dose were exposed to 0, 0.38 or 1.2 ppm TDI for 4 h/d over 5 d (Kouadio et al., 2005). Clin- ically hyperrhinorrhea and sneezing were observed at 0.38 ppm, and more pro- nounced at 1.2 ppm. 24 h after the last ex- posure BALF was collected and analysed.
Eosinophils, neutrophils, macrophages and lymphocytes were increased in a dose- dependent manner, the latter statistically significant only at 1.2 ppm, the others achieving statistical significance also at the low concentration. Histopathologically, a dose-dependent eosinophilic infiltration in the bronchi and goblet cell metaplasia was observed. Unfortunately, no lung function parameters were investigated. The authors referred to a publication of Zheng et al.
(2001), where laboured breathing of TDI sensitized Wistar rats could be observed in parallel to bronchial eosinophilia, neutro- philia and goblet cell metaplasia. This lat-
ter study had no dose-response protocol and the authors used intranasal instillation.
An acceptable fit of the functions pro- vided by the Benchmark Dose Software was not possible without modifications. To avoid over-parameterization of the poly- nomal model of 2nd degree (y = β0 + β1*x + β2*x²), β0 was fixed to the mean of the control group. Doing this, and taking the mean + 1 standard deviation of the control as benchmark risk, concerning PMNs in BALF the BMDL is 0.067 ppm, whereas it is 0.097 ppm against Eos.
Table 3 summarises the rat data. A typ- ical respiratory induction and challenge protocol with rats was not identified. The lowest endpoints obtained are 0.007- 0.023 ppm as BMDL10 for rhinitis after chronic exposure, 0.067 ppm as BMDL for neutrophils in BALF and 0.020 ppm as NOAEC for mucociliary beat. For the lat- ter, the exposure regime was more strin- gent, which might explain the lower value.
As an alternative explanation, the mucocil- iary beat might be affected at lower con- centrations than those resulting in signs of inflammatory changes in the lung.
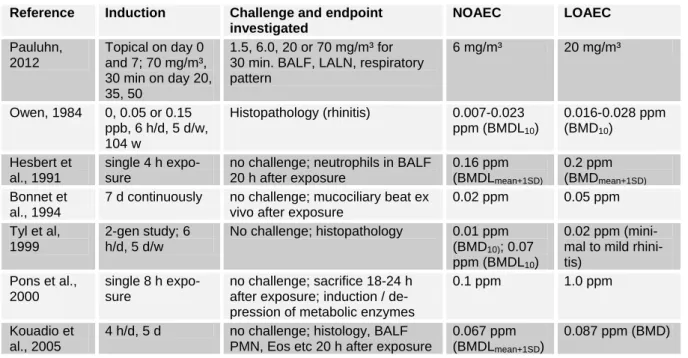
Table 3: Results of selected rat studies showing irritation and sensitisation Reference Induction Challenge and endpoint
investigated
NOAEC LOAEC
Pauluhn, 2012
Topical on day 0 and 7; 70 mg/m³, 30 min on day 20, 35, 50
1.5, 6.0, 20 or 70 mg/m³ for 30 min. BALF, LALN, respiratory pattern
6 mg/m³ 20 mg/m³
Owen, 1984 0, 0.05 or 0.15 ppb, 6 h/d, 5 d/w, 104 w
Histopathology (rhinitis) 0.007-0.023 ppm (BMDL10)
0.016-0.028 ppm (BMD10)
Hesbert et al., 1991
single 4 h expo- sure
no challenge; neutrophils in BALF 20 h after exposure
0.16 ppm (BMDLmean+1SD)
0.2 ppm (BMDmean+1SD)
Bonnet et al., 1994
7 d continuously no challenge; mucociliary beat ex vivo after exposure
0.02 ppm 0.05 ppm Tyl et al,
1999
2-gen study; 6 h/d, 5 d/w
No challenge; histopathology 0.01 ppm (BMD10); 0.07 ppm (BMDL10)
0.02 ppm (mini- mal to mild rhini- tis)
Pons et al., 2000
single 8 h expo- sure
no challenge; sacrifice 18-24 h after exposure; induction / de- pression of metabolic enzymes
0.1 ppm 1.0 ppm
Kouadio et al., 2005
4 h/d, 5 d no challenge; histology, BALF PMN, Eos etc 20 h after exposure
0.067 ppm (BMDLmean+1SD)
0.087 ppm (BMD)
For another aromatic diisocyanate, di- phenylmethane-4,4’-diisocyanate (MDI), it was shown in the Brown-Norway rat that the percentage of neutrophils in BALF is linearly associated with the AUC of the en- hanced Pause (Penh) after challenge; the Penh is a measure for ventilatory function of airways (Pauluhn, 2008). In that publica- tion it was demonstrated how the content of neutrophils in BALF from a dose-response study can be used to derive a threshold for the elicitation of an allergic response in sensitized Brown-Norway rats. Further, to induce a sensitisation in this species repeat- ed exposure of at least minimal irritating concentrations of MDI is required.
From the rat data available so far, a threshold for irritation / inflammation is in- dicated and is expected to be around 0.010 ppm. Whether this is also a threshold for sensitisation induction and / or elicitation is debatable.
Rabbit
Anaesthesised rabbits were exposed against 0, 0.005, 0.01 and 0.03 ppm TDI for 4 h. Once every hour, after a 55 min expo- sure period, the bronchial response against aerosolized ACh solution was checked for a five minute period. At 0.01 ppm and more severely at 0.03 ppm, an increase in airway resistance and bronchoconstriction was de- tectable. 0.005 ppm TDI were without ef- fect. Also, authors report from their experi- ence with workers investigated for isocya- nate induced respiratory disease, non- specific bronchial hyperreactivity is a pre- cursor of obstructive airway disease (Marek et al, 1995).
Human experience
This paper is a review of the available animal data where there is dose-response information. While experience with humans is extensive, except for specific challenge tests exposure-response data are usually not precise or well-controlled. Personal expo- sure measurements are somewhat inconven- ient, as the workers have to carry adsorp- tion filters, partly together with impingers,
connected to a pump. The TDI collected reacts wit ha derivatising agent on the filter / in the impinger solution. The sampling device has to be brought to the analytical lab, and after work-up the TDI-derivative is quantified by high performance liquid chromatography coupled with an ultravio- lett, fluorescence, electrochemical or mass- sensitive detector (UK HSE, 1999). Person- al paper-tape monitors have the advantage of direct reading, but the method of detec- tion and quantification has limitations (Dharmarajan, 1996). Therefore, assessing thresholds in humans can not readily be un- dertaken.
Also, occupational experience has demonstrated that long term exposures above 0.020 ppm may result in a significant decline in forced expiratory volume per one second (FEV1) and peak expiratory flow rate (PEFR) over time (Ott, 2002). Also, incidences of OA and decline in FEV1 ap- pear not to result at concentrations of 0.005 ppm and below and between 0.02 and 0.005 ppm TDI reports concerning respiratory effects are inconclusive ( DFG, 2003; Ott et al., 2003).
Symptoms reported in combination with TDI overexposure are airway dysfunction, ranging from irritation over non-specific hyperresponsiveness to fully developed asthma symptoms (Diller, 1985, 1998;
DFG, 2003). Breathlessness, chest tight- ness, wheezing and coughing in conjunc- tion with exposure at the workplace are typ- ical symptoms reported by affected workers (Murdoch and Lloyd, 2010).
Responses in sensitised subjects have been reported at low concentrations (1 ppb), although the overall exposure dose (C * T) appears to have an impact (Lemiere et al., 2002). However some sensitised subjects did not respond at 1 ppb or at 15 ppb illus- trating the complexity of the mechanisms involved.
Volunteers exposed for 30 min to TDI did detect neither odour nor irritation at concentrations of 0.01 and 0.02 ppm. At 0.05 ppm odour was detectable as well as slight irritation of the eyes and at
0.075 ppm irritation of the eyes was more apparent and there was some irritation of the nose (Henschler et al., 1962).
When 10 healthy volunteers and 15 asthmatics - who were never exposed to TDI before - were exposed to 0.01 ppm TDI for 60 min, only 1 of the 15 asthmatics had an asthma-like response, detected as 100 % increase in airway resistance by whole-body plethysmograhy (Baur et al., 1994). Of those asthmatics remaining, 13 consented to be exposed to 0.02 ppm which triggered an asthmatic response in one indi- vidual.
Workers with potential exposure against TDI and having health complaints at the workplace such as chest tightness, cough and/or dyspnea were exposed in a whole- body plethysmograph to 0.005 ppm TDI for 15 min, 0.010 ppm for 30 min and then fi- nally 0.02 ppm for 5 min (unless they showed an asthmatic response before the end of the exposures) (Baur et al., 1994). Of the 40 workers reporting symptoms, one reacted positively when exposed to 0.005 ppm, a further 3 individuals reacted when exposed to 0.01 ppm and another 8 individ- uals when exposed to 0.02 ppm. Notably, 28 individuals did not react to the specific TDI challenge. This shows self-reported symptoms should be treated with caution for asthma diagnosis.
DISCUSSION
Borm et al. (1990) reviewed the availa- ble literature at that time with respect to an occupational exposure limit for TDI. As limit for irritation, 0.006 to 0.007 ppm was derived. About 0.02–0.04 ppm was the limit for non-specific bronchial hyperresponsive- ness (i.e., AHR), 0.012 ppm for specific hyperresponsiveness and 0.02 ppm for gen- eral pulmonary function. The authors high- lighted uncertainties of extrapolation to humans and the fact that the animal models applied did not allow evaluation of lung decrement.
For better oversight the different animal studies were grouped according to the end-
points investigated, either of sensitisation or irritation.
There are nine studies identified with information relating to no-effect levels and thresholds for induction or elicitation of respiratory sensitisation by TDI (Table 4a).
While it is acknowledged that NOAEC and LOAEC will be dependent on the concen- trations selected for the protocol and proto- cols and endpoints assessed vary widely, a general overview may be taken. Specifical- ly, in the guinea-pig, four studies give a NOAEC of 0.02 or 0.03 ppm, and in these studies the LOAEC ranged from 0.11 to 0.36 ppm. Slightly higher NOAECs were seen where induction protocols were used (e.g. local lymph node studies), as opposed to elicitation protocols (Ban et al., 1997;
Arts et al., 2008). For those induction pro- tocols, the LOAEC were correspondingly high at 1.0 ppm. Of specific note are two studies which did not identify a NOAEC but found a LOAEC of 0.02 ppm (Karol et al., 1980; Matheson et al., 2005). In the study by Karol et al. in guinea-pigs, while the exposure elicited signs of irritation, there was weak evidence of a respiratory response after exposure. In mice however the response elicited at 0.02 ppm TDI was clear (Matheson et al., 2005) and it would seem that the induction protocol in this case, being 6 weeks of exposures, may be a factor. In summary with most elicitation regimens a NOAEC for respiratory sensiti- sation is around 0.02 ppm although this may be higher when induction protocols are used. LOAECs are around 0.1 – 0.4 ppm, but an extended induction protocol may re- sult in a lower LOAEC and presumably NOAEC.
Table 4a: Indices of respiratory sensitisation with TDI
Reference NOAEC LOAEC Karol et al.,
1980
- 0.02 ppm
Karol, 1983 0.02 ppm 0.36 ppm Huang et al.,
1993a
0.02 ppm 0.2 ppm Huang et al.,
1993b
0.03 ppm 0.11 ppm Aoyama et
al., 1994
0.02 ppm 0.2 ppm Ban et al.,
1997
0.11 ppm 1 ppm, 1 h Shiotsuka et
al., 2000
- 0.018-0.046 ppm
Matheson et al., 2005
- 0.02 ppm
Arts et al., 2008
0.09 ppm, 8 h (ED3),
1 ppm / 45 min (rhinitis)
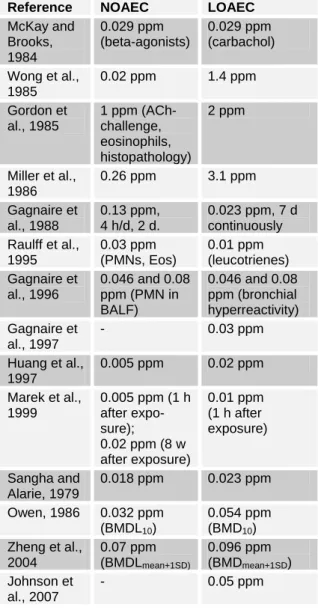
Table 4b: Indices of respiratory irritation with TDI
Reference NOAEC LOAEC McKay and
Brooks, 1984
0.029 ppm (beta-agonists)
0.029 ppm (carbachol) Wong et al.,
1985
0.02 ppm 1.4 ppm Gordon et
al., 1985
1 ppm (ACh- challenge, eosinophils, histopathology)
2 ppm
Miller et al., 1986
0.26 ppm 3.1 ppm Gagnaire et
al., 1988
0.13 ppm, 4 h/d, 2 d.
0.023 ppm, 7 d continuously Raulff et al.,
1995
0.03 ppm (PMNs, Eos)
0.01 ppm (leucotrienes) Gagnaire et
al., 1996
0.046 and 0.08 ppm (PMN in BALF)
0.046 and 0.08 ppm (bronchial hyperreactivity) Gagnaire et
al., 1997
- 0.03 ppm
Huang et al., 1997
0.005 ppm 0.02 ppm Marek et al.,
1999
0.005 ppm (1 h after expo- sure);
0.02 ppm (8 w after exposure)
0.01 ppm (1 h after exposure)
Sangha and Alarie, 1979
0.018 ppm 0.023 ppm Owen, 1986 0.032 ppm
(BMDL10)
0.054 ppm (BMD10) Zheng et al.,
2004
0.07 ppm (BMDLmean+1SD)
0.096 ppm (BMDmean+1SD) Johnson et
al., 2007
- 0.05 ppm
On the other hand, an increase in expo- sure time and exposure frequency would not necessarily result in lower NOAECs/
LOAECs, as respiratory sensitizers may induce tolerance (Vanoirbeek et al., 2009).
There are several studies with various indi- cations of respiratory irritation available (Tables 1b, 2). For the purposes of compar- ison with those of respiratory sensitisation, for which data are available in the guinea pig and mouse only, the respiratory irrita- tion NOAEC and LOAEC for these species are shown in Table 4b. Respiratory irrita- tion NOAECs range from 0.005 to 0.26 ppm, although there is a non-specific hyperresponsiveness outlier of 1.0 ppm, although there are indications of PMN in- flux and some sensitive individuals at this concentration.
The LOAECs from these studies range from 0.01 through 3.1 ppm. Clearly, these values are derived from a variety of differ- ent protocol endpoints, and exposure con- centrations were not necessarily set to in- vestigate no- or low-effect levels. Neverthe- less, it is clear that the NOAECs and
LOAECs for respiratory sensitisation in guinea pig and mouse models are broadly similar to the NOAECs and LOAECs/
BMDLs for respiratory irritation in these species.
Experience with guinea pigs, mice and rats indicate that the irritation threshold co- incides with the NOAEC / BMDL for air- way hyperreactivity. Across species, the involvement of acute inflammatory re- sponse pathways in the development of airway hyperreactivity was shown.
For another aromatic diisocyanate, di- phenylmethane-4,4’-diisocyanate, repeated exposure against at least minimal irritating concentrations was required to sensitize BrownNorway rats (Pauluhn, 2008;
Pauluhn and Poole, 2011).
This strengthens the perception that both thresholds, that for irritation and that for respiratory hyperreactivity, are in the same order of magnitude.
In general, summarizing over the differ- ent end-points investigated, and bearing in
mind the specific exposure regimes, LOAECs and NOAECs are in the same or- der of magnitude across species. Although some questions remain unresolved for the time being and certainly deserve more re- search, the current animal database is not in contradiction of the current workplace ex- posure limits for TDI. The animal data and human experience relating to the NEC for respiratory sensitisation are in concordance.
Consequently, it may be considered that for derivation of occupational workplace expo- sure limits application of additional factors is not required. For workplace safety, em- ployees should be protected against irrita- tion, and non-specific as well as specific hyperresponsiveness. The non-specific hy- perresponsiveness is detectable after single exposures, indicating this is a non-immuno- logical response. Thresholds for irritation and non-specific hyperresponsiveness are lower than those for specific airway reac- tions. Therefore, as discussed by Pauluhn (2011) thresholds identified against the irri- tation hyperresponsiveness should be pro- tective for TDI-induced respiratory disease including respiratory sensitisation.
CONCLUSION
It is not the aim of this paper to judge the relevance of the different endpoints against each other. The existing data for TDI in animal models of respiratory sensiti- sation and irritation demonstrate no-effect- levels. These NEL are at similar concentra- tions across different species. This justifies the use of thresholds for respiratory sensiti- sation in human risk assessment.
Conflict of interest: TS is employed by a company producing diisocyanates. MAC is a consultant to the diisocyanates industry.
The paper was produced during the course of employment. The opinions and conclu- sions are those of the authors and not nec- essarily those of their employers.
REFERENCES
Aoyama K, Huang J, Ueda A, Matsushita T. Provocation of respiratory allergy in guinea pigs following inhalation of free tol- uene diisocyanate. Arch Environ Contam Toxicol 1994;26:403-7.
Arts JHE, Kuper CF. Animal models to test respiratory allergy of low molecular weight chemicals: A guidance. Methods 2007;41:
61-71.
Arts JHE, Mommers C, de Heer C. Dose- response relationships and threshold levels in skin and respiratory allergy. Crit Rev Toxicol 2006;36:219-51.
Arts JHE, de Jong WH, van Triel JJ, Schijf MA, de Klerk A, van Loveren H et al. The respiratory lymph node assay as a tool to study respiratory sensitizers. Toxicol Sci 2008;106:423-34.
Ban M, Hettich D, Goutet M, Bonnet P.
TDI inhalation in guinea-pigs involves mi- gration of dendritic cells. Toxicol Lett 1997;93:185-94.
Ban M, Morel G, Langonné I, Huguet N, Pépin E, Binet S. TDI can induce respirato- ry allergy with Th2-dominated response in mice. Toxicology 2006;218:39-47.
Baur X, Marek W, Ammon J, Czuppon AB, Marczynski B, Raulf-Heimsoth M et al.
Respiratory and other hazards of isocya- nates. Int Arch Occup Environ Health 1994;66:141-52.
Bonnet P, Nunge H, Zahm JM, Gagnaire F.
Ex vivo technique for evaluating the effect of chemical vapours on mucociliary activi- ty. J Appl Toxicol 1994;14:369-74.
Borm PJ, Jorna TH, Henderson PT. Setting acceptable exposure limits for toluene diisocyanate on the basis of different air- way effects observed in animals. Reg Toxi- col Pharmacol 1990;12:53-63.
Botham PA, Hext PM, Rattray NJ, Walsh ST, Woodcock DR. Sensitisation of guinea pigs by inhalation exposure to low molecu- lar weight chemicals. Toxicol Lett 1988;41:
159-73.
Boverhoff DR, Billington R, Gollapudi BB, Hotchkiss JA, Krieger SM, Poole A et al.
Respiratory sensitisation and allergy: cur- rent research approaches and needs. Toxi- col Appl Pharmacol 2008;226:1-13.
DFG (2003). Toluene diisocyanate. In:
Greim H (ed): Occupational toxicants: criti- cal data evaluation for MAK values and classification of carcinogens, Vol. 20 (pp 291-338). Weinheim: Wiley-VCH.
Dharmarajan V. Evaluation of personal continuous paper-tape monitors for toluene- diisocyanate. Am Ind Hyg Ass J 1996;57:
68-71.
Diller WF. Das Spektrum der Diisocyanat- bedingten Broncho-Pneumopathien. Zbl Arbeitsmed 1985;85:66-9.
Diller WF. Critical review of the human toxicology of TDI. I.I.I. ref 11198. Man- chester: International Isocyanate Institute Inc., 1998.
Driscoll KE, Costa DL, Hatch G, Hender- son R, Oberdorster G, Salem H et al. In- tratracheal instillation as an exposure tech- nique for the evaluation of respiratory tract toxicity: uses and limitations. Toxicol Sci 2000;55:24-35.
Fuchs S, Valade P. Clinical and experi- mental study of some cases of poisoning by desmodur T (1-2-4 and 1-2-6 di-isocyanates of toluene). Arch Mal Prof 1951;12:191-6.
Gagnaire F, Micillino JC, Bonnet P, Simon P, de Ceaurriz J. Toluene diisocyanate- induced airway hyperresponsiveness to in- travenous ACh: a study on single and re- peated exposure in guinea-pigs. Toxicol Lett 1988;44:273-80.
Gagnaire F, Ban M, Micillino JC, Lemon- nier M, Bonnet P. Bronchial responsiveness and inflammation in guinea-pigs exposed to toluene diisocyanate: a study on single and repeated exposure. Toxicology 1996;114:
91-100.
Gagnaire F, Ban M, Cour C, Micillino JC, Bonnet P, Hettich D. Role of tachykinins and neural endopeptidase in toluene diiso- cyanate induced bronchial hyperrespon- siveness in guinea pigs. Toxicology 1997;
116:17-26.
Gordon T, Sheppard D, McDonald DM, Distefano S, Scypinski L. Airway hyperre- sponsiveness and inflammation induced by toluene diisocyanate in guinea pigs. Am Rev Respir Dis 1985;132:1106-12.
Henschler D, Assmann W, Meyer KO. Zur Toxikologie der Toluylendiisocyanate.
Arch Toxicol 1962;19:364-87.
Hesbert A, Ban M, Bonnet P, Simon P, Bottin MC, Lemonnier M et al. Interde- pendence of polymorphnuclear neutrophils and macrophages stained for N-acetyl-beta- glucosaminidase in lavage effluent from toluene diisocyanate-exposed rat lungs.
Toxicol Lett 1991;56:53-9.
Hostynek JJ, Maibach HI. Thresholds of elicitation depend on induction conditions.
Could low level exposure induce sub- clinical allergic states that are only elicited under the severe conditions of clinical di- agnosis? Food Chem Toxicol 2004;42:
1859-65.
Hoymann HG, Krug N. Testverfahren für inhalative Testung auf allergenes Potential.
Bundesgesundheitsbl Gesundheitsforsch Gesundheitsschutz 2001;44:682-9.
Huang J, Aoyama K, Ueda A. Experimental study on respiratory sensitivity to inhaled toluene diisocyanate. Arch Toxicol 1993a;
67:373-8.