• Keine Ergebnisse gefunden

Uci 00 m)

N/A
N/A
Protected

Academic year: 2021

Aktie "Uci 00 m)"

Copied!
41
0
0

Wird geladen.... (Jetzt Volltext ansehen)

Volltext

(1)

co m)

4 4

00

rA.a

Uci

0- m D .

o LE

.-

4-'

Cl)M

o) Lf)

Public Disclosure Authorized Public Disclosure Authorized Public Disclosure Authorized

(2)

MEASURING RESULTS:

A REVIEW OF MONITORING AND EVALUATION IN HNP OPERATIONS IN SOUTH ASIA AND

SOME PRACTICAL SUGGESTIONS FOR IMPLEMENTATION

August 2006

THE WORLD BANK

SOUTH ASIA HUMAN DEVELOPMENT UNIT

(3)
(4)

ACKNOWLEDGEMENTS

This report was prepared by Benjamin Loevinsohn and Aakanksha Pande (SASHD- HNP). Shreelata Rao-Seshadri reviewed all project documents and made critical inputs to the writing of this report. A number of World Bank staff who provided useful comments to this report are gratefully acknowledged and include, Susan Stout, Martha Ainsworth, Edward Bos, Markus Goldstein, Keith Mackay, Barbara Kafka, Kees Kostermans, and Peter Berman. The authors are also grateful to the SASHNP task team leaders who were interviewed and shared their insights. This report was prepared under the overall guidance of Anabela Abreu and Julian Schweitzer.

The authors also wish to thank Silvia Albert who designed and edited this report.

(5)

Measuring Results: A Review of Monitofing and Evaluation in HINP Operations in South Asia and Some Practical Suggestions for Implementation

ACRONYMS AND ABBREVIATIONS CIDA Canadian International Development Agency CMUs Country Management Units

DEC Development Economics and Chief Economist DHS Demographic and Health Survey

DOs Development Objectives EOIs Expression of Interest

HMIS Health Management Information Systems HNP Health, Nutrition and Population

ICR Implementation Completion Report IDA International Development Association IEC Information, Education and Communication IMR Infant Mortality Rate

ISR Implementation Status Report M&E Monitoring and Evaluation MDG Millennium Development Goals MICS Multiple Cluster Information Surveys NACP National AIDS Control Program NGO Non-government Organization OED Operations Evaluation Department OPCS Operation Policy and Country Services PAD Project Appraisal Document

PDOs Project Development Objectives

PHRD Policy and Human Resources Development PRSP Poverty Reduction Strategy Paper

PSR Project Status Report QERs Quality at Entry Review RFP Request for Proposal

SASHD South Asia Human Development Sector

SASHNP South Asia Health, Nutrition, Population Sector TORs Terms of Reference

TTLs Task Team Leaders

U5MR Under Five Mortality Rate

(6)

Measuring Results: A Review of Monitoring and Evaluation in HNP Operations in South Asia and Some is Practical Suggestions for Implementation

CONTENTS

EXECUTIVE SUMMARY ... i

1. INTRODUCTION ... 1

A. Background ... 1

B. Objectives ... 2

2. METHODS ... 2

3. RESULTS ... 4

A. Selection and Definition of Indicators ... 4

B. Design of Data Collection ... 6

C. Implementation of the Data Collection Plans ... 8

D. Use and Analysis of Data ... 9

E. Building M&E Capacity ... 10

F. Impact Evaluation of Innovations ... 10

G. Progress on M&E Over Time ... 11

4. RECOMMENDATIONS ... 11

5. CHECKLIST FOR M&E IN HNP OPERATIONS ... 14

A. Introduction ... 14

B. Preparation and Appraisal ... 14

C. Implementation ... 20

Annex 1 ... 26

(7)
(8)

Measuring Results: A Review of Monitoring and Evaluation in HNP Operations in South Asia and Some El Practical Suggestions for Implementation

EXECUTIVE SUMMARY

1. Background: An assessment of monitoring and evaluation (M&E) was undertaken to learn lessons, both positive and negative, from the experience of SASHNP in ongoing or recently closed projects. The objectives of the study were to: (a) improve the design and implementation of M&E of Bank HNP operations in the region; (b) understand how to increase the number of impact evaluations of important innovations;

(c) figure out means to assist our clients to improve the monitoring of the performance of their health sectors; (d) further strengthen the "results" culture among sector staff; and (e) establish a baseline against to which judge progress on improving M&E that could be repeated in 2-3 years.

2. Methods: A randomly selected sample of twelve, regionally representative HNP projects were reviewed independently by three separate observers who used a standardized questionnaire to record data. The reviewers examined, in depth, the PAD, all the aides-memoire, all the PSRs/ISRs, and the ICR (if it had been completed). For each operation, five indicators were randomly selected from the results framework (what is now Annex 3) of the PAD for more detailed review. Qualitative interviews were also undertaken with selected TTLs. The inter-observer reliability of the findings was tested using the kappa statistic which determines whether the agreement among observers is more than could be expected due to chance.

3. Selection of Indicators: The agreement among the reviewers about whether the selected indicators were appropriate for the operation was no better than would be achieved by flipping a coin. This suggests that reasonable people can legitimately disagree about what constitutes a set of sensible indicators for an operation. However, there is likely room for improvement in indicator selection. Many of the indicators are

"upstream", i.e., they deal with inputs and processes rather than outputs and outcomes.

The mean number of indicators per operation was twenty six and some projects had many more. Not surprisingly, having more indicators leads to less data actually being collected.

4. Design of Data Collection: While the PADs often described important aspects of the indicators included in the results framework, only a third of the indicators had all the following characteristics: (a) they were defined in a measurable way; (b) had a clear method for collecting data; (c) had an explicit schedule for data collection; (d) had an explicit target; and (e) indicated who was responsible for collecting the data. There could have been greater use of household and health facility surveys to collect key data. Control or comparison groups were rarely used even when they existed and could have been used at modest cost. The use of controls has declined since before 2000.

5. Implementation of Data Collection: Baseline data was collected for only 39%

of the indicators studied, and only a quarter of the projects had "satisfactory" baseline

data in the initial PSR/ISR. The collection of follow-on data was equally poor and for

only a quarter of the operations studied was the data collection plan judged to have

-mostly" been implemented. A major issue identified in the review was that the approach

(9)

to data collection was inconsistent. For example, the sampling methodology or the questions asked would vary from survey to survey, making the trend data un- interpretable. Despite the problems, there were some projects that did a reasonable job of data collection indicating that this is possible to do under operational conditions.

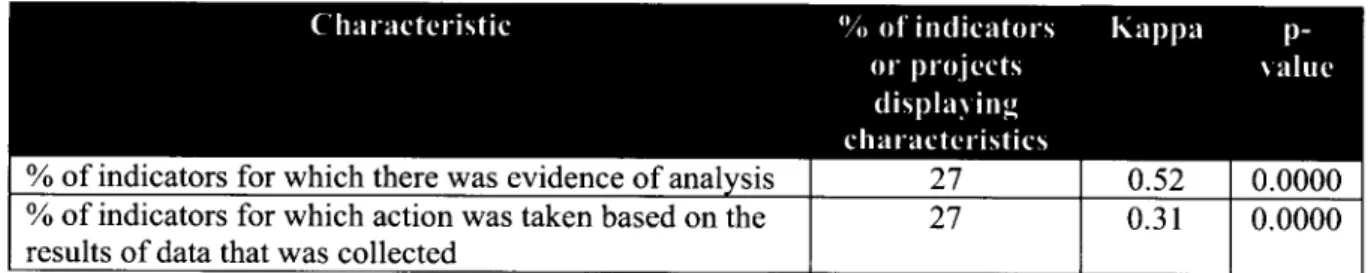
6. Use and Analysis of Data: Because data collection was not often implemented, there was little opportunity for analysis of the data. However, even when data was collected, there was evidence of actual analysis of the data only half the time. Data analysis did not always lead to action. In those instances where data was collected for an indicator, there was evidence that the information resulted in some action only one quarter of the time.

7. Building M&E Capacity: There was little agreement among the reviewers about whether projects analyzed the capacity of clients or had plans for building that capacity.

This disagreement partly reflects the fact that there were few explicit mentions of M&E capacity building, although it was sometimes implied in the PAD. There were many projects which involved development of a computerized management information system but did not explicitly lay out plans for building M&E capacity.

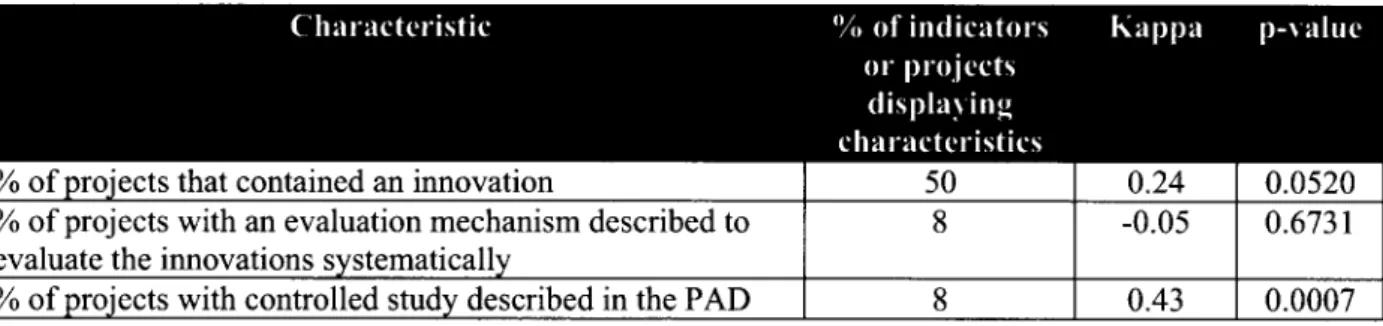
8. Impact Evaluations of Innovations: Each project had on average two innovations that were described in the PAD. Unfortunately, there was very little agreement among the reviewers about whether a project included an innovation or whether there was a clear mechanism for assessing the effectiveness of the innovation.

There were certainly opportunities for controlled studies but these were rarely taken advantage of even when there was clear phasing of implementation or when the project did not cover all the districts or sub-districts.

9. Little Evidence of Improvement Over Time: There was little evidence that M&E improved from projects approved before the end of 2000 compared to projects approved after January 2001.

10. Recommendations: Based on the results of the review, discussions with sector staff, and comments from experts in the Bank, the following recommendations are made:

(a) task teams should routinely use an M&E checklist, such as the one attached to this

report; (b) M&E should be a central part of quality enhancement reviews (QERs); (c)

more technical assistance should be provided to task teams on M&E; (d) M&E capacity

of task teams should be further strengthened through focused and practical training; (e)

all aspects of M&E including building of client capacity, conducting of rigorous

evaluations, as well as effective M&E of the Bank operations themselves, need to be

dealt with but the first two appear to be receiving insufficient attention; (f) management

need to provide clear and consistent messages to staff about the importance of M&E; (g)

task teams and managers need to regularly review M&E during implementation; and (h)

one senior staff in the sector should devote part of their time to supporting M&E

activities and help implement the above recommendations.

(10)

Measuring Results: A Review of Monitoring and Evaluation in HNP Operations in South Asia and Some Practical Suggestions for Implementation

1. INTRODUCTION A. Background

1. Strong consensus on the importance of Measuring Results: There has been an increasing demand from shareholders and stakeholders for the Bank to do a better job on measuring results (often referred to as monitoring and evaluation [M&E]). The results framework for IDA-14 is an example of the increasing external pressure on the Bank to spend more time and effort on M&E. The management of SASHD has also consistently emphasized the importance of M&E. Based on discussions and interviews, it also appears that SASHNP staff are very interested in M&E and see it as key to successful operations and more broadly in making progress towards the Millennium Development Goals (MDGs). For more than a decade the Bank, as an institution, has continuously emphasized the importance of monitoring project performance and progress towards achievement of development objectives. Hence, it appears that there is a strong consensus on the centrality of M&E to the work of the Bank.

2. Different aspects of M&E: In spite of this consensus, there is a perception that the Bank's prior efforts to strengthen M&E have had modest effect, partly because the necessary resources have not been available and it has not received sufficient attention from managers and staff. In addition, the term M&E is loosely defined and often means different things to the various stakeholders involved. To avoid confusion, this report identifies three areas of M&E:

(a) M&E of Bank operations is the planned and systematic collection of data on selected indicators to determine whether the objectives of Bank lending operations have actually been achieved. This is a fiduciary responsibility for the Bank and its staff,

(b) Building client capacity for M&E which includes Bank efforts to build the capacity of national or local governments to use information to track and improve the performance of their health systems, including progress towards the MDGs, and important outputs like immunization coverage, etc.; and (c) Impact evaluation, which is the rigorous evaluation of innovative

approaches or policies to determine whether they actually have the intended effect.

3. Origins of the Study: This study arose out of the interest of SASHNP staff and

management who wanted to learn lessons, both positive and negative, about their

experience with M&E. The study received material and moral support from the Regional

Vice-President's Office. The willingness SASHNP staff to subject their M&E activities

to critical review reflected their belief that this would improve the services provided to

clients and enhance the health of beneficiaries. The Vice-President of OPCS recently

indicated that HNP generally has done a better job than other sectors in M&E. Hence, the

(11)

fact that this study focuses on HNP is not because the sector is particularly problematic on M&E or that South Asia is doing any worse than other regions. Rather, the current study signals the desire of SASHNP to get better at what it does and reflects consistent management commitment to this issue.

B. Objectives

4. The overall intent of this review was to strengthen M&E for HNP in South Asia by accomplishing the following specific objectives:

(a) Improve the design and implementation of M&E in Bank HNP operations in the region;

(b) Substantially increase the number of impact evaluations of HNP innovations and policies carried out with Bank support;

(c) Assist our client countries to do a better job of monitoring and evaluating the performance of their health sectors;

(d) Further strengthen the "results" culture among sector staff; and

(e) Establish a baseline against to which judge progress on improving M&E that could be repeated in 2-3 years.

2. METHODS

5. Basic Design: The assessment described here followed a written protocol that was reviewed by peers before it was implemented on a pilot basis. Three observers were involved in the review and, while all had considerable knowledge of M&E, they brought different backgrounds and experiences to the effort. The observers independently reviewed projects in detail using a standardized questionnaire (see the Annex) to record key information. For a total of twelve projects, the reviewers examined the PAD, all the aides memoire, all the PSRs or ISRs, and the ICR (where completed). Five individual indicators from each project (i.e., a total of 60) were randomly selected from the Results Framework (what is now Annex 3) of the PAD and subjected to detailed review. The reviewers also wrote on the questionnaire their opinions of certain aspects of the M&E process. After the review of three projects on a pilot basis, the questionnaire was slightly changed and used for the remainder of the assessment. As an additional, qualitative, input to the assessment, key informant interviews were conducted with task team leaders using a series of guide questions.

6. Scope: Information was collected on: (a) the selection of indicators and whether

they were explicit, measurable, and related to the objectives of the operation; (b) the data

collection plans that were developed for the operation; (c) whether the data collection

plans was actually implemented as designed; (d) whether operations have actually helped

countries to build M&E capacity; and (e) whether opportunities for impact evaluation

were taken advantage of.

(12)

Measuring Results: A Review of Monitoring and Evaluation in HNP Operations in South Asia and Some Practical Suggestions for Implementation

7. Inter-Observer Agreement and Validity: Many similar reviews are undertaken in the Bank but they rarely have multiple observers or measure inter-observer agreement.

This is a serious problem because inter-observer reliability is the sine qua non of validity.

If reasonable observers, examining the same characteristic of a project, cannot agree on whether it is present or not, then it generally makes little sense to draw definitive conclusions about that particular characteristic. For example, we found that different observers did not agree on whether the under-five mortality rate should have been included as an indicator in the projects reviewed (as suggested by IDA-14). Hence, we cannot conclude whether the under-five mortality rate should have been used in more projects or not.

8. The Kappa Statistic: We measured inter-observer reliability using the kappa statistic which measures agreement between observers above what would occur by chance. (For example, two weather forecasters living in the desert will agree on the forecast, and be right, if they keep on telling their viewers that "it will be hot and sunny tomorrow." This does not make them good weather forecasters nor does it indicate that their agreement on the forecast is better than would be expected due to chance alone.) Kappa varies from +1 (perfect agreement) to -1 (perfect disagreement) with kappas between 0 and 0.2 generally regarded as showing poor agreement, 0.21-0.40 deemed to show fair agreement, 0.41-0.60 moderate agreement, and kappas above 0.6 indicating substantial agreement. P-values can also be calculated for kappa and show whether the kappa is significantly different from 0, i.e., what would be expected due to chance.

9. Sampling: Twelve regionally representative projects were included in the review.

Three projects were selected purposefully for the pilot phase and included health system and disease control types of projects. The other nine projects included in the review were randomly selected from the pool of twenty seven ongoing operations or projects that had been completed since 2003. Since projects from India constituted 60% of that pool, it was decided that Indian projects would constitute seven of the twelve projects reviewed.' These projects were stratified to obtain a balance between state health systems projects and "vertical" or centrally sponsored schemes.

10. Analysis: Data from the completed questionnaires was analyzed using STATA.

Categorical data was analyzed by constructing frequency tables of the median of all three reviewers' responses for each question so as to obtain the majority opinion. Frequency tables were used to calculate the kappa statistics. The questionnaire, the data base, and the analyses are in IRIS to facilitate a follow-up study.

To avoid any bias, projects worked on by the reviewers were excluded from the study.

3

(13)

3. RESULTS A. Selection and Definition of Indicators

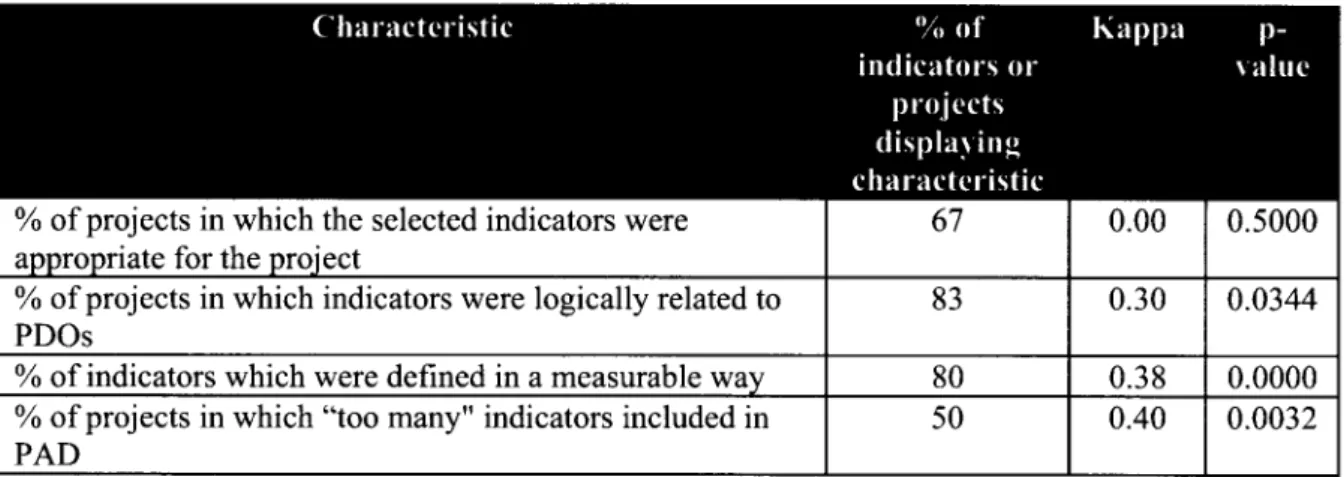
11. Uncertainty about the Selection of Indicators: Choosing the right indicators for an HNP operation appears to be a difficult task which involves a great deal of opinion. In response to the question, "overall, do you think the M&E indicators selected were appropriate for the operation as it was described in the PAD?" the reviewers level of agreement was no better than flipping a coin (i.e., the kappa was 0 and the p value was 50%, see Table 1). The lack of agreement suggests that in choosing indicators for an operation it is difficult to please everyone and that there is room for legitimate disagreement on what constitutes a set of sensible indicators. Choosing indicators may be more of an art than a science, however that does not mean that there is not room for improvement. There was better agreement on whether M&E indicators listed in the PAD logically related to the stated objectives of the operation. This suggests that the indicators may have been consistent with the stated project development objectives (DOs), but that the DOs may not have been appropriate for the project. This is consistent with a Bank- wide review recently carried out by the HNP hub.

12. Many Indicators are "Upstream": The reviewers often felt that the indicators selected were "upstream" i.e., more focused on inputs and processes rather than outputs or outcomes. For example in one project, one of the indicators in the PAD was the number of health workers trained on quality assurance methodologies. There were no indicators related to whether quality assurance mechanisms were actually implemented or whether quality of care had actually improved. This suggests that there is some disagreement on the extent to which upstream indicators should be included in the results framework.

13. TTLs Need to Keep a lot of People Happy: Discussions with TTLs also indicates that in selecting indicators, task teams face a number of challenges, including:

(a) governments do not take ownership of the process partly because they do not know

how to do it; (b) governments are usually held accountable only for inputs (with audits of

expenditures) so that monitoring outputs and outcomes is not a familiar concept; (c) there

are multiple requirements from inside the Bank; (d) ensuring consistency with the design

of the project and ensuring that the M&E is practical and can be implemented; and (e)

there is pressure from a variety of stakeholders to address global priorities such as the

MDGs.

(14)

Measuring Results: A Review of Monitoring and Evaluation in HNP Operations in South Asia and Some Practical Suggestions for Implementation

Table 1: Selection and Definition of Indicators

% of projects in which the selected indicators were 67 0.00 0.5000

appropriate for the project

% of projects in which indicators were logically related to 83 0.30 0.0344

PDOs

% of indicators which were defined in a measurable way 80 0.38 0.0000

% of projects in which "too many" indicators included in 50 0.40 0.0032

PAD -

Note: Kappas between 0 and 0.20 represent poor agreement, 0.21-0.40 fair agreement, 0.41-0.60 moderate agreement, and >0.61 substantial agreement.

14. Many Indicators are Chosen for Each Project: The mean number of M&E indicators per project identified in the Results Framework of the PAD was twenty six (the median was twenty three and the range was from five to forty seven). Half of the projects studied were believed to have too many indicators and there was fair agreement among the reviewers. For many of the projects, the list of indicators resembled a checklist of actions to be taken rather than a concise list of key objectives to be accomplished. The excessive number of indicators may again reflect the need of task teams to keep many interests happy. For some operations, the number of indicators was larger than those identified in the Results Framework, because different indicators were specified in multiple sections of the PAD. For example, in one project there were "technical and managerial indicators" specified in the main text; "social indicators" identified in one annex; information, education, and communication (IEC) indicators identified in another annex; and a table of "objectives and expected outcomes" in another annex which identified even more output and outcome indicators.

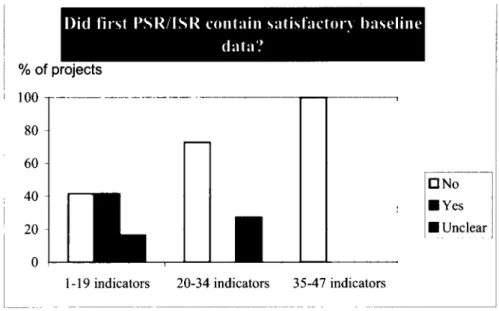
15. Having More Indicators Leads to Less Data: Not surprisingly, having more indicators for an operation appears to lead to less data actually being collected. Projects having more than the median number of indicators (i.e., twenty three or more) were less likely to have collected baseline data or follow-on data. For the indicators reviewed in detail, follow-on data was collected about half as frequently for projects with twenty four or more indicators (32% of indicators had follow-on data vs. 63% of the indicators in projects with fewer indicators). Similar findings apply for collection of baseline data as can be appreciated from Figure 1 which shows a nice gradient indicating that as the number of indicators increases the likelihood of satisfactory baseline data decreases.

5

(15)

Figure 1: Decrease in Data Collection as Number of Indicators Increases

% of projects

100 __ _

80- 60- 40 -ENYes ANo

20 3 U Unclear

0

1-19 indicators 20-34 indicators 35-47 indicators

16. Indicators are usually Defined in Measurable Way: Of the sixty randomly selected indicators reviewed in detail, 80% were "defined in such a way as to be measurable" and there was fair agreement among the reviewers. However, there were clear examples where the indicators, while addressing potentially important issues, could not have been measured. For example, in one project one of the indicators was: "licensing procedures and fee structures for service providers [will be] revised to support the ...

service package." In another project one of the key indicators was "the Government, in consultation with major stakeholders, develops recommendations and options for appropriate policies and measures for improving ... quality and safety in line with its new approach."

B. Design of Data Collection

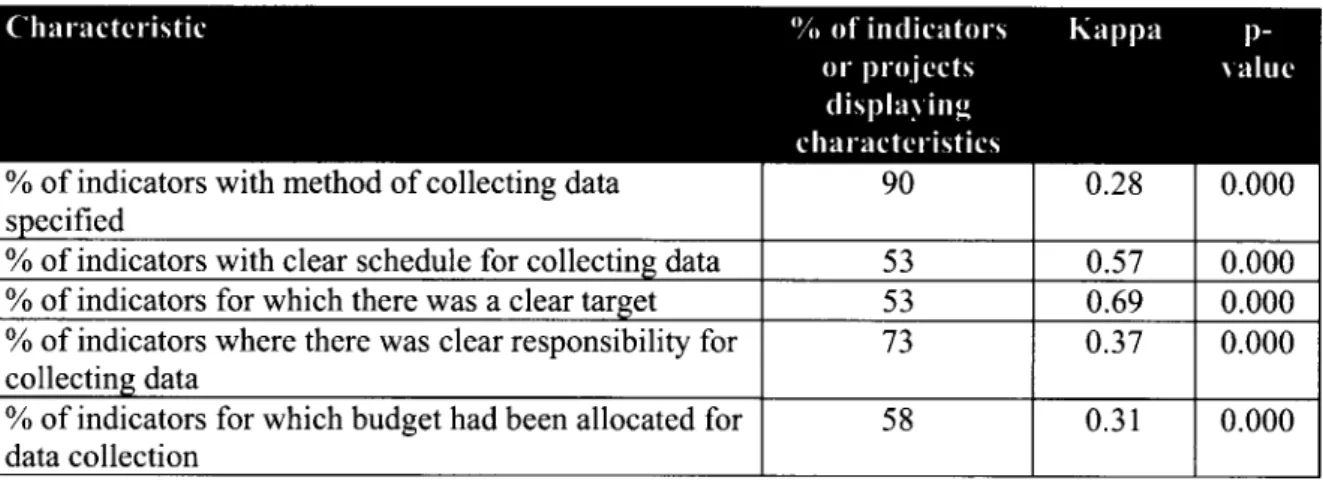
17. Key Aspects of Data Collection Specified for Only a Third of Indicators: As mentioned above 80% of the indicators studied were defined in a measurable way. As can be seen in Table 2, task teams often provided important information on the indicators selected that helped in ensuring that data was collected and analyzed. For example, 90%

of the 60 indicators studied had a clear method for collecting information defined in the

PAD and for 73% it was clear who was responsible data collection. While task teams

clearly felt that describing these individual aspects of the indicators in the PAD was

important, only 33% of the indicators had all of the following elements: (a) they were

defined in a measurable way; (b) had a clear method for collecting data; (c) had an

explicit schedule for data collection; (d) had an explicit target; and (e) indicated who was

responsible for collecting the data.

(16)

Measuring Results: A Review of Monitoring and Evaluation in HNP Operations in South Asia and Some on Practical Suggestions for Implementation

Table 2: Design Features of M&E Indicators Reviewed in Detail (N=60)

% of indicators with method of collecting data 90 0.28 0.00

specified

% of indicators with clear schedule for collecting data 53 0.57 0.000

% of indicators for which there was a clear target 53 0.69 0.000

% of indicators where there was clear responsibility for 73 0.37 0.000 collecting data

% of indicators for which budget had been allocated for 58 0.31 0.000 data collection

Note: Kappas between 0 and 0.20 represent poor agreement, 0.21-0.40 fair agreement, 0.41-0.60 moderate agreement, and >0.61 substantial agreement.

18. Limited Use of Household and Health Facility Surveys: Household surveys can provide important information not easily available from other sources, such as: (a) equity in access to services; (b) use of private sector services; (c) prevalence data, such as the contraceptive prevalence rate or the occurrence of diarrhea; (d) community satisfaction; and (e) expenditures on health care. Such surveys can also be used to in concert with data from the health management information systems (HMIS) which usually collects data from the public sector. While HMISs can provide near real time information, they have often been found, in South Asia, to be inaccurate. Thus another use of household surveys can be to validate HMIS information. Despite their potential importance, there was limited use of household surveys. Only 13% of the indicators were to be measured using household surveys, although 18% of indicators were supposed to be measured using multiple methods which sometimes included household surveys.

Measuring quality of care almost always requires some form of health facility assessment, however only 2% of the indicators obtained information using this method.

The other sources of data for the indicators were 13% from HMIS; 32% from project records; 20% from other sources; and for 2% of indicators no method of data collection was specified.

19. Control/Comparison Groups Rarely Used Even When Available: For only 7%

of the indicators reviewed in detail was a control or comparison group identified in the PAD. However, for the remaining indicators, the reviewers felt that for at least one third it was possible to identify a control group (kappa = 0.32, p = 0.0000). One quarter of the operations studied were supposed to phase in activities over time (although in half the projects it was unclear whether there was phasing or not) and in about 58% of the operations not all the jurisdictions in the project area were covered. Thus it appears that there are more opportunities to have comparison or control groups by taking advantage of the project design. It appears that this could be done at modest cost.

20. Declining Use of Control Groups: There has been a declining trend over time in the use of control groups to measure the success of Bank operations. In projects approved

7

(17)

prior to 2000 about 16% of the indicators had control groups mentioned in the PAD. For projects approved since 2000, none of the indicators had clearly identified comparison

groups.

C. Implementation of the Data Collection Plans

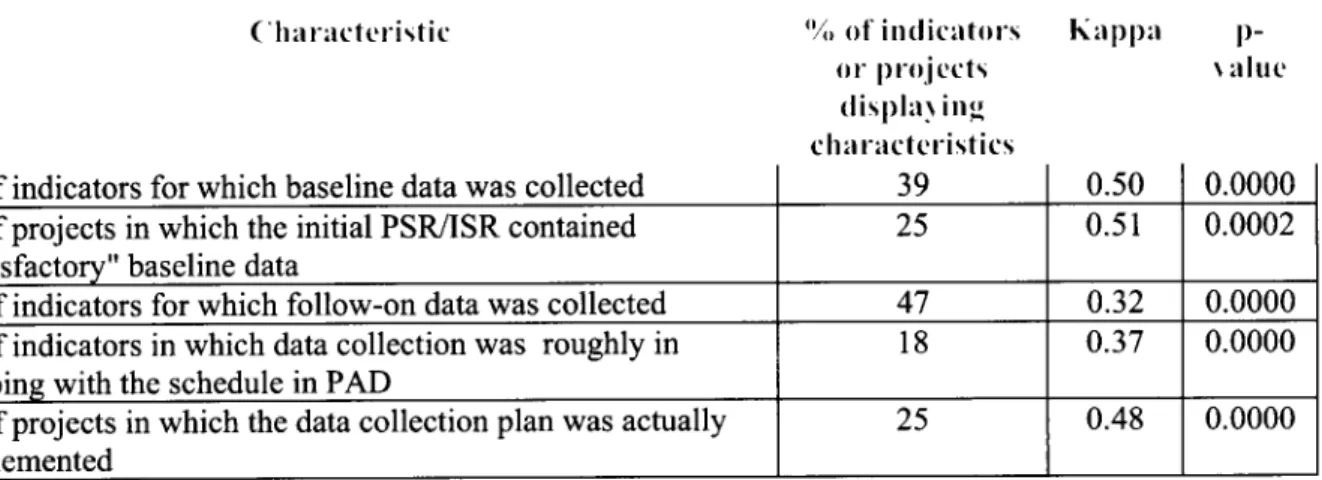
21. Baseline Data Rarely Collected: Among the sixty randomly selected indicators studied in detail, baseline data was collected for only 39% of them (see Table 3). Among those indicators with baseline data, 67% of the data was stated in the PAD; 22% of the baseline data was collected between four months to one year after effectiveness; and for 11% of indicators with baseline data, it was collected more than two years after effectiveness. For one project "baseline" data became available almost five years after board approval. Due to delays in contracting a firm to undertake the baseline survey in another project, baseline data was available about two and one-half years after project effectiveness. Overall, only 25% of the operations reviewed had satisfactory baseline data prior to or included in the first ISR (an indicator in the IDA-14 results agreement). These findings are a little lower but comparable to a Bank-wide review of HNP projects which found that 47% of first ISRs have baseline data.

Table 3: Implementation of Data Collection Plans

C har acteristic "ou of in(licatri-s Kap pa p-

OP. projects . altie

dlisplaN ing' chal-ra cte ristics

% of indicators for which baseline data was collected 39 0.50 0.0000

% of projects in which the initial PSR/ISR contained 25 0.51 0.0002

"satisfactory" baseline data

% of indicators for which follow-on data was collected 47 0.32 0.0000

% of indicators in which data collection was roughly in 18 0.37 0.0000 keeping with the schedule in PAD

% of projects in which the data collection plan was actually 25 0.48 0.0000 implemented

Note: Kappas between 0 and 0.20 represent poor agreement, 0.21-0.40fair agreement, 0.41-0.60 moderate agreement, and >0.61 substantial agreement.

22. Overall, Data Collection Plans Were Not Implemented as Designed: As can be appreciated in Table 3, in addition to baseline data collection, the rest of the data collection plans were rarely implemented as designed. Follow-on data was collected for 47% of the indicators studied according to the authors of the aides-memoire and the PSRs/ISRs. This is higher than the collection of baseline data and suggests that task teams themselves decide that after a certain period data cannot be considered as baseline.

Even for those indicators with a clear schedule for data collection, the schedule was even

approximately met only 18% of the time. Only a quarter of the projects implemented the

data collection plan described in the PAD. The reviewers comments on the individual

projects suggests that the major issues in data collection are: (a) the lack of attention

given by governments and task teams to implementation of data collection during the

(18)

Measuring Results: A Review of Monitoring and Evaluation in HNP Operations in South Asia and Some cm Practical Suggestions for Implementation

preparation process; (b) data collection plans were overly complex and ambitious when simpler approaches would have been easier to implement; (c) project managers were overwhelmed by other aspects of implementation; and (d) unclear responsibility for data collection and analysis.

23. Inconsistent Approach to Data Collection: There were a number of cases where the methodology used for collecting data changed during the life of the project. While this is sometimes necessary to reflect ground realities, it can also lead to data that is un- interpretable. For example, in one project, data was collected by two different agencies, which unfortunately adopted different definitions of key indicators leading to major discrepancies in data reporting. In another project there was an elegant controlled design and baseline data was collected before the project started. However, the follow-on data used a completely different sampling methodology which meant that the data could not be used to judge the effectiveness of the program (one in which billions of dollars have been invested over the years).

24. There Are Good Examples of Data Collection: While, on average, data collection has been problematic, there have been some operations that did a good job suggesting that it is possible to carry out M&E under real-world conditions. For example, in one project information was collected on the utilization of services, annual performance surveys were conducted, facility surveys were carried out to monitor quality of care, data was collected from hospital records, and pre- and post- tests were done to evaluate training workshops. The mid-term review of this project had a detailed annex that described the data collection methodology for the key performance indicators and

coherently analyzed the results.

D. Use and Analysis of Data

25. Limited Use of Data Even When it is Available: For only 27% of the indicators studied was there any evidence in the aides-memoire or PSRs/ISRs of actual analysis of the data (see Table 4). This partly reflects the fact that there was limited collection of baseline or follow-on data. However, even among those indicators for which data was collected, only about half (49%) of the time was there evidence that the data was analyzed (kappa = 0.52, p = 0.0000). For only 27% of those indicators with data was there any evidence that actions had been taken as a result of the findings.

Table 4: Use of Data

% of indicators for which there was evidence of analysis 27 0.52 0.0000

% of indicators for which action was taken based on the 27 0.31 0.0000 results of data that was collected

Note: Kappas between 0 and 0.20 represent poor agreement, 0.21-0.40 fair agreement, 0.41-0.60 moderate agreement, and >0.61 substantial agreement.

9

(19)

E. Building M&E Capacity

26. Limited Analysis of M&E Capacity and Unclear Plans: In only a third of operations was there any analysis in the PAD of the client's ability to undertake M&E.

There was little agreement among the reviewers on this issue nor was there agreement on whether the operation actually had capacity building plans or not (kappa = 0.18, p = 0.069). This lack of agreement suggests that M&E capacity building was not explicitly addressed in the PAD although there may have been plans implicit in the design of the M&E framework. For example, under one project the PAD allocated US$67 million to

"institutional strengthening" which included "building capacity for monitoring and evaluation program activities". There were also many projects which involved development of computerized management information systems, but did not explicitly lay out plans for building M&E capacity. In the latest version of the PAD, OPCS specifically recommends that this aspect of M&E be explicitly dealt with in the M&E section of the text.

27. Capacity Building Seen as Important: The lack of explicit plans is not because TTLs think the issue is unimportant. On the contrary, the TTLs interviewed strongly believed that it is critical to build country systems and enhance monitoring capacity within the government. However, when it comes to project implementation, the work on building capacity generally is translated into a focus on developing software and procuring hardware. In one project, the aides-memoire often discussed software and connectivity issues, but never addressed building of the human capacity for using the data.

F. Impact Evaluation of Innovations

28. Innovations Not Systematically Dealt With: Many of the PADs mentioned that introduction of innovations was part of the operation (the mean was two innovations per project). Unfortunately, there was very little agreement among the reviewers about whether a project included an innovation or whether there was a clear mechanism for assessing the effectiveness of the innovation (see Table 5). The lack of inter-observer agreement may reflect the lack of explicit plans for innovations or their evaluation.

Again, there were intimations that evaluations were to be carried out but this rarely

happened. In one project for example, there was a very important innovation described in

the PAD about decentralizing decisions on use of funds to local governments. However,

it was unclear how the experience would be judged. (The innovation was never

implemented in any case.) As mentioned earlier, there were certainly opportunities for

controlled studies but these were rarely taken advantage of even when there was clear

phasing of implementation or when the project did not cover all the districts or sub-

districts.

(20)

Measuring Results: A Review of Monitoring and Evaluation in HNP Operations in South Asia and Some Practical Suggestions for Implementation

Table 5: Evaluation of Innovations

% of projects that-contained an innovation | 50 |0.24 |002

% of projects with an evaluation mechanism described to 8-0.05 0.6731 evaluate the innovations systematically

% of projects with controlled study described in the PAD 8 0.43 0.0007 Note: Kappas between 0 and 0.20 represent poor agreement, 0.21-0.40fair agreement, 0.41-0.60 moderate agreement, and >0.61 substantial agreement.

G. Progress on M&E Over Time

29. No Evidence of Improvement Over Time: Based on a variety of parameters, it appears that there is little evidence that M&E has improved between those projects approved before the end of 2000 and those approved after the beginning of 2001. While there are some differences on some characteristics, they are generally small and they do not consistently favor one time period over the other. The projects approved before 2000 may benefit from having longer implementation time, however, that would not much change the overall conclusion.

Table 6: Comparison of Indicators for Operations Approved Before December 2000 and those Approved After

% of indicators defined in such a way as to be measurable 76 83

% of indicators for which there was a clear method for 84 94 collecting data

% of indicators for which there was a clear schedule 44 60

% of indicators with a clear target 44 60

% of indicators for which baseline data actually collected 42 37

% of indicators with follow-up data 60 37

% of indicators in which data collection was roughly in keeping 40 26 with the schedule in PAD (Yes or partially)

4. RECOMMENDATIONS

30. The results of this review were discussed with sector staff and other M&E experts in the Bank. The following recommendations came out of these discussions and the findings of the review:

31. Use an M&E checklist: In order to help task teams use a more systematic approach to M&E during preparation and implementation of operations, a checklist has been developed (see Section 5) that incorporates some of the lessons learned from the

11

(21)

above review. For example, the checklist emphasizes defining a limited number of indicators, figuring out, in detail, how these indicators will be measured, ensuring that baseline data is collected during preparation or early during implementation, etc. Such a checklist should help task teams and peer reviewers systematically address key M&E issues.

32. Make M&E a central part of QERs: The M&E checklist can be used to make the discussion of M&E during QERs more systematic and focused. This review found that it is difficult to reach agreement on what indicators should be used in an operation, but this does not mean that careful discussion of all aspects of M&E during the QER process is unimportant. Sector management should also ensure that there is not a lot of

"second guessing" after the design process, something that, understandably, upsets task teams.

33. Providing technical assistance to task teams: For a variety of reasons, relatively little technical support for M&E has been provided to task teams during the design of operations. This is too bad because doing a good job on M&E requires a number of different skills. In addition to a deep knowledge of the content and evidence in the sector, good M&E design requires: (a) expertise in different quantitative and qualitative methodologies; (b) practical knowledge of the costs and logistics of the different methodologies; (c) understanding of experimental design in real world situations; and (d) a capacity to convince skeptical stakeholders of the value of M&E. The technical assistance can come from within the Bank, from consultants, or from other development partners. A database of local M&E consultants in human development sectors has been developed for India (and is available at O:\SAS HNP M&E).

34. Building the M&E capacity of task teams through training: While having technical support may help task teams, there is still a need to strengthen the skills that task teams themselves bring to the design and implementation of M&E aspects of operations.

35. Deal with all aspects of M&E: This review emphasizes three aspects of M&E:

(a) M&E of the Bank operation; (b) building the capacity of clients to measure the performance of their own health sector; and (c) rigorous evaluations of innovations so that successful ones can be used more widely. The review found relatively little attention paid to the latter two aspects of M&E. Strengthening these aspects of M&E will require considerably more attention during the design phase of operations from the task teams and management.

36. Clear messages from management about the importance of M&E: CMUs and

sector management need to be consistent and clear both with task teams and clients about

the importance of M&E. For example, given the consistent problems with baseline data,

both country and sector management should be willing to push clients on advanced

recruitment of organizations to collect baseline data.

(22)

Measuring Results: A Review of Monitoring and Evaluation in HNP Operations in South Asia and Some cm Practical Suggestions for Implementation

37. Regular review and self-assessment of M&E during implementation:

Managers and task team leaders should review aide-memoires and ISRs to ensure that M&E is being implemented as designed. The proposed checklist, or a similar tool, should be used by task teams to carry out a self-assessment of how well M&E is being implemented.

38. Dedicate part of the time of one staff to support M&E: Implementing these recommendations and supporting staff to strengthen M&E will require continued efforts of at least one senior staff in the sector. This should not be a full time job but success in M&E needs more than casual attention.

13

(23)

5. CHECKLIST FOR M&E IN HNP OPERATIONS A. Introduction

This checklist is meant to be a guide for task teams during preparation/appraisal and implementation of projects and programs. It is not meant to be exhaustive, but it does set out some specific actions teams need to consider during the different phases of operations. The checklist is not entirely sequential. For example, the indicators selected may be affected by how easy or hard it is to collect the required data. Thus, there are iterative loops for many of the actions listed below. The annex provides a self-assessment summary of the checklist.

Don't Panic!!! If done systematically M&E doesn't need to be overly complex or difficult. We all tend to promise too much and become frustrated when it is not achieved.

We should "under-promise and over-deliver." This is not the same as lowering the bar, it does mean taking into account real world difficulties. In the end, what is promised in the PAD should be delivered.

B. Preparation and Appraisal

This section divides actions into: (a) selection of indicators; (b) design of data collection;

(c) thinking about controlled evaluations; and (d) building capacity among clients for M&E.

B1. Selection of Indicators

1. [ +! I Discuss Project Objectives Before Components: Start discussion with Government about PDOs during identification. Task teams should not design the project components and then figure out how to do the M&E. Instead it makes sense to start with objectives (including some important indicators) and design components to achieve them.

2. 1 ] Limit the Total Number of Indicators: Because the likelihood of actually collecting and using data decreases as the number of indicators increases, the effort during identification and preparation should be to limit the number of indicators. A core set of not more than 10 indicators should be chosen that relate to the PDOs. A few process indicators can also be included in the M&E framework to tell the causal story (see #4 below).

3. 1 +i I Indicators Should Tend Towards Outputs and Outcomes: In selecting

indicators, the bias should be towards using ones that are more downstream (i.e., closer to

impact rather than inputs). For example, rather than using the number of staff trained on

quality assurance, it is preferable to examine the percentage of facilities in which an

acceptable (needs to be defined) quality assurance system is in place. This indicator is

meaningful by itself and is much closer to the desired outcome, i.e., improved quality of

care. Some other examples of more downstream indicators include: (a) availability of

(24)

Measuring Results: A Review of Monitoring and Evaluation in HNP Operations in South Asia and Some la Practical Suggestions for Implementation

drugs in health facilities, rather than an increase in drug budget allocation; (b) availability of female health staff in health facilities rather than number of women enrolled in para- medic training programs; and (c) increase in immunization coverage rather than an increase in the number of vaccinators.

4. [ zi I Attribution and Telling a Causal Story with Indicators: Another source of legitimate disagreement surrounds which indicators to include in order to attribute improvements in services to a Bank operation. Focusing just on outcomes, will strain credibility. In the example above, combining implementation of a quality assurance system with an objective indicator of quality of care provides a neat story about how quality was improved.

5. [ J Discuss the Evidence for the Link Between Inputs and Outputs: M&E means evidence and some of the discomfort with M&E arises from legitimate disagreements about the strength of evidence linking inputs or processes and objectives (i.e., output or outcome indicators). Sometimes the evidence is quite strong, for example, the link between measles immunization campaigns and reduced measles mortality (regardless of whether you think the approach is sustainable or not). For many other situations the evidence linking inputs/processes to outputs/outcomes is less clear. For example, will refurbishing a hospital increase the overall use of hospital services by poor people? This type of discussion may not be easy but may be useful in strengthening the design of the operation. It will also be important in ensuring that the PDOs are sensible.

6. [ zi I Using Existing Indicators and Targets: There are many advantages to using indicators and targets that have already been selected for the particular country or sub-sector. This increases country ownership and facilitates coordination among development partners. Indicators may be in the PRSP, health sector strategy, or other government document. For example, the Health Metrics website has a list of indicators to be considered for HIV, malaria and TB programs; to address equity concerns; and to track vital events. http://www.who.int/healthmetrics/librarv/enl. In addition, harmonizing indicators with other development partners will create a more concise set of indicators with potentially more readily available data.

7. [ 1 I Equity, Quality, and Quantity: When selecting indicators, task teams need to ensure that measures of equity (e.g. concentration index or use by the poorest two income quintiles), quality of services (indices of quality of care through health facility surveys), and quantity (coverage of services, number of services provided) are included in the list.

8. [ l I Define the Indicator Precisely: Each indicator should be clearly defined in sufficient operational detail as to be clear to everyone. This means defining the numerator and denominator exactly and clarifying key terms. For example, the indicator "percentage of health centers that are fully functional" would have to define what "fully functional"

means and would have to clarify what the denominator is (e.g., all health centers that have been constructed or just those that have any staff in them). It may also help to do a

15

(25)

'test run' of an indicator, by plugging in hypothetical numbers and determining if the indicator is helpful in tracking the operations' success.

9. [ +i I Discuss Measurement of U5MR: As part of the IDA14 agreements, task teams for each health operation financed by IDA are obliged to determine whether the client is able to measure and utilize the under-five mortality rate (U5MR). This does not mean that every health operation has to use U5MR as an indicator, only that its measurement and status needs to be discussed with the client.

B2. Planning Data Collection

10. 1 4 I Develop a Practical Plan for Data Collection: People tend to focus more on the selection of indicators and much less on how data will actually be collected and analyzed. In keeping with the template table in Annex 3 of the PAD, task teams need to figure out for each indicator that is selected: (a) a definition of the indicator in enough detail so that it is clear to everyone what it means; (b) how data will be collected; (c) the schedule of data collection; (d) the baseline values of the indicators; (e) the targets for the indicators; and (f) who will be responsible for collecting, analyzing, and interpreting the data.

11. [ 'l Be Aware of Data Limitations: If data on an indicator is hard to collect, of poor quality, or not reliable, it may make sense to reconsider the inclusion of the indicator. For example, IMR through survey data is difficult to collect reliably, requires a large sample size and is time lagged (i.e., the estimate often centers on a moment three years prior to the survey).

12. [ >I I Specify the Details of Data Collection: There needs to be a description in

the PAD about the different modalities for data collection. The table below provides an

example although the same can be accomplished in text format. Whether in text or table,

the data collection modalities should be described in sufficient detail so that people

coming later can understand the intent. Identifying the source of funds, especially for

baseline data is important.

(26)

Measuring Results: A Review of Monitoring and Evaluation in HNP Operations in South Asia and Some Practical Suggestions for Implementation

Table 1: Details of Data Collection

Behavioral Technical $2,200,000

surveillance X X X X X NACP assistance will be ($450,000 Yes

among provided to NACP per year)

vulnerable by CIDA. Data

populations collection by a

firm/NGO/research institution under contract

Assessment Third party firm $300,000

of NGO X X X X X NACP under contract during 4 Yes

Performance year

contract

13. 1 < Ensure Consistency in Data Collection Methodology: There are numerous examples where follow-on data collection methods have been inconsistent with the baseline methodology. This makes comparisons difficult and limits the utility of the M&E effort. While the people who do the follow-up studies are always smarter (they often feel that way and they have the benefit of hindsight), it makes sense for follow-on studies to use the same methods as the baseline, to the extent possible. If needed, questions can be added to a questionnaire but generally previous questions should not be taken out. Aspects of the studies that need to be consistent include: (a) sampling methodology and location; (b) definition of important groups (e.g., child-bearing age women should stay as fifteen to forty five years of age and not change halfway through the operation to women eighteen to fifty years of age); and (c) questionnaires including how specific questions are asked; etc.

14. [1 <1 Identifying Existing or Planned Sources of Data: It often turns out that the government, other Bank-financed operations, or other donor projects have collected data or plan to collect data that will be useful for the operation the task team is responsible for.

Given that using such sources of data, when appropriate, is an efficient use of resources, it makes sense to search for such data sources. It is useful to factor into the data collection plan the schedule of major national surveys such as income and expenditure surveys (funded by the Government), demographic and health surveys (DHS, often funded by USAID), and multiple indicator cluster surveys (MICS, financed by UNICEF).

15. [1 ] I Collect Baseline Data: Both because it makes sense, and because it was a commitment under IDA14, adequate baseline data is supposed to be collected before the first supervision mission.

17

(27)

16. 1 i ] Advanced Action on Recruitment of M&E Consultants and Firms: Many operations will need baseline and follow-on data collected independently or in a non- routine manner. Similarly, it may be necessary to hire a consultant to assist the client in data collection design, analysis, or interpretation. Given the serious delays that often occur in baseline data collection, recruitment of such M&E firms or consultants should be an advanced procurement action. Terms of reference (TORs) should be agreed early during preparation, EOIs should be issued, RFP drafted and agreed before appraisal, and consultants selected prior to approval. A set of sample TORs, E0Is, and RFPs have made available for reference to all staff on the 0 drive (O:\SAS HNP M&E). The contracts with firms should include both baseline and follow-on studies to reduce administrative burden (on clients as well as the Bank), help ensure consistency in methodology, and

reduce the cost of the efforts (economies of scale).

17. [ V ] Collect Actual Data: For indicators for which information will come from health management information systems (HMIS), administrative records (e.g., budget data), or existing surveys, the reports, actual data sets, questionnaires, and forms, etc.

should be collected during preparation. This will tell a lot about the quality of the data, ease of collection, and will establish baselines that won't change later on. For example, in one project budget allocation data for the same prior years kept on changing during implementation (as reported in ISRs). In another project, the definition of a female health worker in the baseline survey included any staff in the facility that was female. Only later was the mistake realized and the definition changed to include only skilled para- professionals, which reduced the baseline significantly.

18. 1 7I I Store Reports and Actual Data Sets in Secure Location: In order to allow government officials, Bank staff, consultants, etc. to go back and use the same sampling methodology and questionnaires, it is worthwhile to have a copy of reports, questionnaires, and data sets available in a readily accessible place and format.

B3. Need, and Opportunities, for Impact Evaluations

19. [ I I Determine Need for Impact Evaluations: Shortly after identifying innovative aspects of the operation, the task team needs to ask itself and its Government counterparts: (a) are the innovations important? (b) are they expensive or involve a difficult/controversial change; (c) is the global literature on the effectiveness of the innovation limited or non-existent. If the answers to these questions are yes, then there is at least a prima facie case that an impact, often controlled, evaluation is needed.

20. 1 +I I Examine Opportunities for Impact Evaluations: If there is a reasonable

case for an impact evaluation, the task team and its Government counterparts need to see

whether there are really opportunities to conduct one. For example, some of the

conditions that facilitate controlled evaluations include: (a) when the implementation of

the innovation will be phased in (due to logistical or managerial constraints); (b) when

resource constraints result in only some areas being subject to the innovation; or (c)

where jurisdictions are excluded from receiving the innovation for other reasons.

(28)

Measuring Results: A Review of Monitoring and Evaluation in HNP Operations in South Asia and Some Om Practical Suggestions for Implementation

21. l V I Reach Broad Agreement on Impact Evaluation: The Government and the task team need to reach broad agreement on the utility, feasibility, and importance of an impact evaluation. Experience thus far suggests that this takes time but that committed Government managers will see the value.

22. 1 + ] Design of an Impact Evaluation: During preparation of the operation it makes sense to begin the design of the impact evaluation. The HD Chief Economist runs a clinic which provides advice to task teams on design of such evaluations. Technical help is also available from DEC and now IEG. The design also needs to include an implementation plan that indicates who is responsible for implementation. Guidebooks and resources for impact evaluation can be found on the intranet (at http://www1.worldbank.org/prem/poverty/ie/evaluationdb.htm).

23. 1 J I Identify Funds for the Evaluation: Carrying out impact evaluations may require additional funds. If the task team feels that additional funds are required, then it makes sense to start identifying possible sources of finding during preparation of the operation. Sources of funds for such evaluations includes PHRD grants, trust funds, and institutional development funds.

24. 1 '1 I Obtain Ethical Review/Clearance for Evaluation: After the impact evaluation has been designed, it may be necessary to obtain ethical clearance. To some extent this depends on the nature of the evaluation. Those that involve individuals as the experimental units are more likely to need ethical clearance.

25. 1 +i I Alternates to Prospective Controlled Evaluations: If controlled evaluations are not feasible, then other possibilities for evaluating innovations should be considered such as case-control studies, discontinuity methods, and propensity score matching. For example, case-control studies involve identifying people with good or bad outcomes and comparing them to a control group of people with the opposite outcomes.

Then the two groups are assessed for their exposure to the innovation, controlling for possible confounders. More information on alternatives to prospective controlled evaluations can be found http://www.worldbank.org/oed/ecd/.

B4. Building M&E Capacity Among Clients

26. [ J I Assessment of M&E Capacity: Carry out a rapid assessment of M&E capacity of the client organization including decision makers, key staff, and managers in the field. There has been relatively little work done in this area so far, but as experience grows with these kinds of assessment, the results will be made available.

27. [ + I Identify Possible Means of Strengthening M&E Capacity: Discuss with clients some of the actions that can build M&E capacity, including: (a) quarterly or semi- annual meetings of high level officials and field managers to review key indicators; (b) training of key staff on data analysis and utilization; (c) production of formal annual report that examines data on key indicators; (d) consultants or Bank staff attend quarterly review meetings and provide technical assistance on interpretation of data; (e)

19

Abbildung

Table  1:  Selection  and Definition  of Indicators
Figure 1:  Decrease  in Data  Collection  as Number of  Indicators Increases % of projects 100  __  _  80- 60-40  -ENYes ANo 20  3  U  Unclear 0
Table  2:  Design  Features  of M&amp;E  Indicators Reviewed  in Detail  (N=60)
Table  3: Implementation  of Data Collection  Plans
+5

Referenzen

ÄHNLICHE DOKUMENTE

* Bu çalışma, 21-23 Eylül 2004 tarihlerinde Ankara’da düzenlenmiş olan “Müzakere Sürecinde Türkiye - AB İlişkileri” isimli Uluslararası Sempozyum’da sunulan

 The work function of the Cu-PDA system increases by 2.6 eV when the H atom belonging to the vacuum exposed COOH group rotates from up to down (and the oxygen lone pairs

It has been financed by the European Union (EU) and created with a view to building a network of medium-sized cities across Europe for exchanging good practices

Alle untersuchten KünstlerInnen entwickelten erfolgreiche Muster im Umgang mit Unsicherheit, so kann resümierend festgehalten werden, erfolgreich allerdings im Sinne einer

tomber bien : come in a good moment The analysis of the mismatching expressions with lexical categories preserved across languages (groups 1 and 2) suggests that using a special

In our German data, after the acceptance of a possible pre-closing (extract 1, line 30: &#34;gut.&#34;), the next activity is not a terminal greeting.. In fact, we have not found

Goal projection effects (as compared with a no- goal control group) should be observed for participants with strong implicit and explicit goals (i.e., participants in the

4, we characterise the joint distribution of adverse selection, the probability of trade, the efficiency contribution, the inside firm’s profit, and the worker’s wage.. The first