Article
Omics Integration Analyses Reveal the Early Evolution of Malignancy in Breast Cancer
Shamim Sarhadi
1,2,†, Ali Salehzadeh-Yazdi
3,†, Mehdi Damaghi
4,5,
Nosratollah Zarghami
1,2, Olaf Wolkenhauer
3and Hedayatollah Hosseini
6,*
1
Stem Cell Research Center, Tabriz University of Medical Sciences, Tabriz 5166614756, Iran;
shamim.sarhadi65@gmail.com (S.S.); zarghami@tbzmed.ac.ir (N.Z.)
2
Department of Medical Biotechnology, Faculty of Advanced Medical Sciences, Tabriz University of Medical Sciences, Tabriz 5166614756, Iran
3
Department of Systems Biology and Bioinformatics, University of Rostock, 18051 Rostock, Germany;
ali.salehzadeh-yazdi@uni-rostock.de (A.S.-Y.); olaf.wolkenhauer@uni-rostock.de (O.W.)
4
Department of Oncologic Sciences, Morsani College of Medicine, University of South Florida, Tempa, FL 33612, USA; Mehdi.Damaghi@moffitt.org
5
Department of Cancer Physiology, Moffitt Cancer Center and Research Institute, Tampa, FL 33612, USA
6
Experimental Medicine and Therapy Research, University of Regensburg, 93053 Regensburg, Germany
*
Correspondence: hedayatollah.hosseini@ukr.de
†
These authors contributed equally to this work as first authors.
Received: 12 April 2020; Accepted: 31 May 2020; Published: 4 June 2020
Abstract: The majority of cancer evolution studies involve individual-based approaches that neglect the population dynamics necessary to build a global picture of cancer evolution for each cancer type.
Here, we conducted a population-based study in breast cancer to understand the timing of malignancy evolution and its correlation to the genetic evolution of pathological stages. In an omics integrative approach, we integrated gene expression and genomic aberration data for pre-invasive (ductal carcinoma in situ; DCIS, early-stage) and post-invasive (invasive ductal carcinoma; IDC, late-stage) samples and investigated the evolutionary role of further genetic changes in later stages compared to the early ones. We found that single gene alterations (SGAs) and copy-number alterations (CNAs) work together in forward and backward evolution manners to fine-tune the signaling pathways operating in tumors. Analyses of the integrated point mutation and gene expression data showed that (i) our proposed fine-tuning concept is also applicable to metastasis, and (ii) metastases sometimes diverge from the primary tumor at the DCIS stage. Our results indicated that the malignant potency of breast tumors is constant over the pre- and post-invasive pathological stages. Indeed, further genetic alterations in later stages do not establish de novo malignancy routes; however, they serve to fine-tune antecedent signaling pathways.
Keywords: breast cancer; cancer evolution; omics data integration; machine learning; forward and backward evolution
1. Introduction
Modern cancer biology, which is expanding rapidly in the light of omics approaches, has validated many aspects of Darwinian somatic evolution in cancer progression [1]. Such evolutionary logic influences our thinking and actions [2]. However, there are still some unknowns in the cancer evolution field, and innovative ideas and approaches are needed. For example, it is not clear how the progress of tumor staging could be correlated to clinical outcomes. It is speculated that tumor staging is the leading prognosis indicator and that the decline in cancer mortality in diverse cancer types is predominantly the result of screening, which reduces the incidence of larger tumors [3–8]. However, it has been
Cancers2020,12, 1460; doi:10.3390/cancers12061460 www.mdpi.com/journal/cancers
suggested that certain features of tumors have more prognostic relevance than the anatomy of the tumor [9]. Furthermore, recent studies in breast and colorectal cancer have shown that disseminated cancer cells from earlier stages are the main cause of metastases [10,11]. Hence, it is still unclear to what extent the evolution of malignancy represents the evolution of genetic alterations and pathological progression of tumors.
The study of the somatic evolution of cancer relies on the dynamic genotype-phenotype relationship of cancer cells at different stages of tumor progression [12]. Data for cancer evolutionary studies are mostly obtained via paired or longitudinal sampling from individual patients [13,14].
However, this approach is technically complicated and has some limitations by default. For example, multiple sampling and biopsies are not adequate to cover the whole heterogeneous tumor population [14,15]. Moreover, the depth of sequencing that is used to generate the mutational portrait of samples is still below the detection limit for minor subclones within the samples [16].
Most importantly, genetic drift, genetic background, and neutral evolution introduce undetectable bias into individual-based evolutionary studies [17,18]. Recently, the Pan-Cancer Analysis attempted to draw maps of the similarities and differences among the genomic and cellular alterations in a population across diverse tumor types, reflecting some evolutionary traces [19]. Nonetheless, there is still a gap in the exploration of cancer evolution within the population of each cancer type.
Studying the evolution of malignancy in large populations of patients will solve some of the mentioned issues, and might allow new aspects of cancer evolution that are not visible in the individual-based approaches to be pinpointed. We exploited a large volume of available data on different stages of breast cancer to build a universal portrait of tumor evolution in breast cancer.
The most common type of breast cancer is ductal carcinoma, which consists of two main stages, ductal carcinoma in situ (DCIS) and invasive ductal carcinoma (IDC) [20]. DCIS or Stage 0 breast cancer is considered the noninvasive stage, and is the immediate precursor of the most invasive breast cancers [20,21].
With the advent of high-throughput technologies, researchers can quantify cellular changes at different molecular levels. Omics data have been broadly used for disease classification and identification of molecular gene signatures, but low reproducibility is a major weakness of these approaches [22]. However, new approaches based on omics data integration are expected to play a key role in identifying and qualifying new biomarkers, which is why the focus of data analysis approaches has shifted from single-omics to multi-omics data integration [23,24]. Consequently, many integrative methods, tools, and packages have been devised to identify cancer driver genes [25].
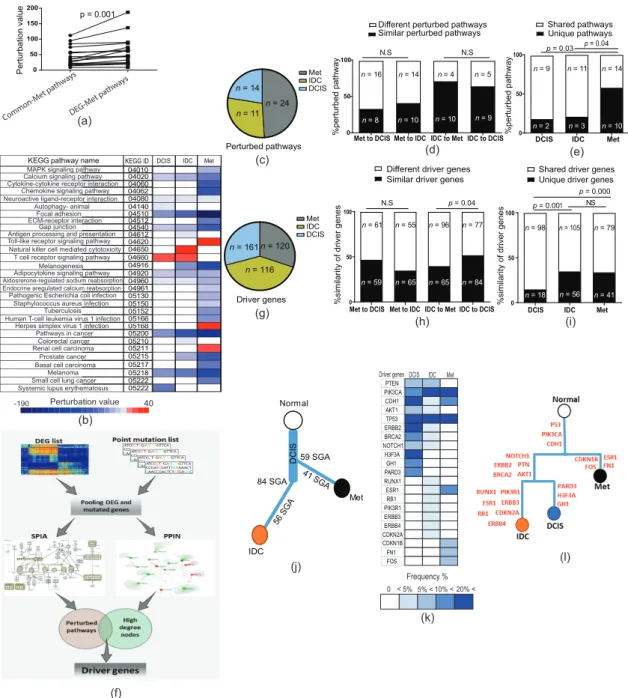
In this study, we used an omics integration approach to integrate the gene expression, copy-number alteration (CNA), and mutation data for the DCIS, IDC, and metastasis (Met) samples. Our results indicated that the malignant phenotype mostly forms in the earlier stages of tumor progression.
Phylogenetic analyses depicted a global picture of breast cancer evolution that indicated early
divergence of metastases at the DCIS stage. We discovered that further genetic alterations in advanced
tumors do not generate new functional pathways in the tumor, but rather serve as fine-tuning effectors
for antecedent changes from earlier stages. The fine-tuning happens via two different pathways,
forward and backward evolution. In forward evolution, cancer cells increase the single gene alteration
(SGA) burden to increase the efficiency of selected pathways. In backward evolution, tumor cells
exploit CNAs in order to reverse the expression direction of unwanted inherited genetic changes, with a
negative impact on the function of operating pathways. Therefore, we concluded that the malignancy
fate is determined at the very early stages, and subsequent genetic changes are the fine-tuners of the
evolutionary path.
2. Results
2.1. DCIS and IDC Are Indistinguishable Based on Gene Expression Profiles
In breast cancer progression, it is widely believed that DCIS and IDC are the noninvasive and invasive states of breast tumors, respectively [20,21]. We hypothesized that DCIS can be distinguished from IDC based on molecular features. Hence, we assessed the differences between normal, DCIS, and IDC samples using gene expression analyses. Accordingly, we used 10 datasets including 430 DCIS, IDC, and normal samples, profiled by three different platforms (Figure S1a). We used microarray data due to the availability of sufficient gene expression data for DCIS and IDC samples with a normal matched dataset. We then performed a statistical analysis for the identification of differentially expressed genes (DEGs), which resulted in 4275, 5000, and 1098 DEGs with a combined p-value < 0.05 for DEG1 (DCIS vs. normal), DEG2 (IDC vs. normal), and DEG3 (DCIS vs. IDC), respectively (Table S1 and Figure S1b). In order to guarantee that our results were not biased because of the faults of microarray technology, we compared DEG2 with an analogous DEG dataset from the largest available RNA-sequencing dataset in breast cancer [26] and found significant similarities between these two data groups (p < 0.0001, exact hypergeometric probability test; Figure S1c).
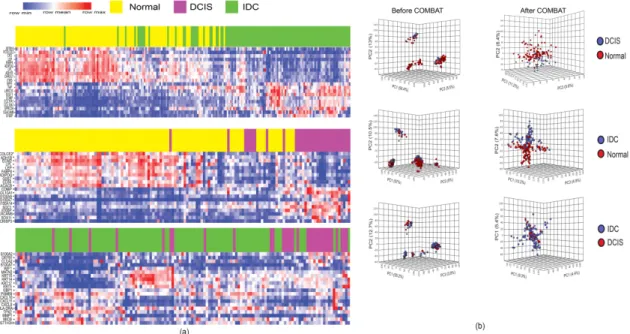
After the identification of DEGs, we used principal component analysis (PCA) and hierarchical clustering to determine whether the gene expression profiles of DCIS and IDC samples were separable.
We did not find a clear separation between these samples (Figure 1a,b). To avoid the bias of incompatibility noise in our analyses, we used Combining Batches (ComBat) method in the PCA and hierarchical clustering methods to remove the batch noise. Applying PCA and the hierarchical clustering method after ComBat was able to differentiate DCIS and IDC samples from normal samples. However, DCIS and IDC samples could not be differentiated even after applying ComBat (Figure 1a,b). These results indicated that DCIS is not distinguishable from IDC using gene expression clustering approaches.
Figure 1.
Unsupervised hierarchical clustering and PCA. (a) Two-dimensional heatmaps show
16 differentially expressed genes based on the log fold-changes. Clustering was done after applying the
ComBat method; (b) PCA analyses before (left) and after ComBat (right). PCA distinguished DCIS and
IDC from normal samples based on their gene expression profiles, but failed to distinguish DCIS from
IDC samples.
2.2. Stage-Dependent Gene Expression Analyses Did Not Generate a Malignancy-Predictive Feature
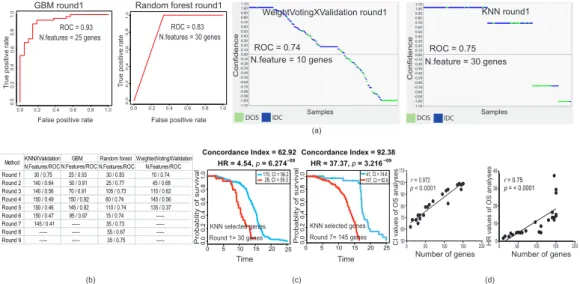
Here, we applied further advanced approaches to distinguish DCIS and IDC based on their gene expression profiles. Therefore, we used machine-learning (ML) methods to define a minimal number of genes as representatives of DCIS and IDC. We optimized four different ML methods (weightedVotingXValidation, KNN, GBM, and Random Forest) and they successfully generated distinctive (Receiver Operating Characteristics/Area Under the Curve, ROC/AUC > 0.5) features able to sort DCIS from IDC samples (Figure 2a). In order to evaluate the accuracy of selected gene features, we removed all of the first selected gene features and reran all ML models to generate new distinctive features. Notably, all ML methods were able to reconstruct new distinctive features, even after excluding previous selected gene features from the data source (Figure 2b and Figure S2a).
Next, we hypothesized that the first selected gene features might have a stronger biological correlation to the clinical outcomes (e.g., survival) in patients as compared to the gene features in the next rounds (Figure 2c and Figure S2b). Our analyses revealed that the discriminative power for the selected features of our chosen ML methods did not indicate their biological relevance. Indeed, features with nonsignificant discriminative power (ROC/AUC < 0.5) were also strongly correlated to biological outcomes (Figure 2c and Figure S2b). Inspecting the survival analyses and selected features using ML methods, we realized that the strength of the hazard ratio (HR) and concordance index (CI) was strongly correlated to the number of genes in the selected features (p < 0.0001, Pearson correlation test;
Figure 2d). Furthermore, we could not find significant consistency between the direction of expressed genes in the source of selected feature gene (DCIS or IDC) and the poor- and good-prognosis samples in the survival analyses (Figure S2c). These results suggested that the distinguishing power of the discriminative gene features of DCIS versus IDC was not correlated to the clinical outcomes and malignancy of breast tumors.
DCIS IDC
Sample Sample Sample Sample Sample Sample Sample Sample Sample Sample Sample Sample Sample Sample Sample Sample Sample Sample Sample Sample Sample Sample Sample Sample Sample Sample Sample Sample Sample Sample Sample Sample Sample Sample Sample Sample Sample Sample Sample Sample Sample SampleSample -1.10
-1.05 -1.00 -0.95 -0.90 -0.85 -0.80 -0.75 -0.70 -0.65 -0.60 -0.55 -0.50 -0.45 -0.40 -0.35 -0.30 -0.25 -0.20 -0.15 -0.10 -0.050.00 0.05 0.10 0.15 0.20 0.25 0.30 0.35 0.40 0.45 0.50 0.55 0.60 0.65 0.70 0.75 0.80 0.85 0.90 0.95 1.00 1.05 1.10
Confidence
DCIS
IDC DCIS IDC
sample sample sample sample sample sample sample sample sample sample sample sample sample sample sample sample sample sample sample sample sample sample sample sample sample sample sample sample sample sample sample sample sample sample sample sample sample sample sample sample sample sampleSample -1.10
-1.05 -1.00 -0.95 -0.90 -0.85 -0.80 -0.75 -0.70 -0.65 -0.60 -0.55 -0.50 -0.45 -0.40 -0.35 -0.30 -0.25 -0.20 -0.15 -0.10 -0.05 0.00 0.05 0.10 0.15 0.20 0.25 0.30 0.35 0.40 0.45 0.50 0.55 0.60 0.65 0.70 0.75 0.80 0.85 0.90 0.95 1.00 1.05 1.10
ConfidenceConfidence
Confidence
1.0
False positive rate
True positive rate
0.0 0.2 0.4 0.6 0.8 1.0
0.00.20.40.60.81.0
N.features = 30 genesROC = 0.83
0.00.20.40.60.81.0
False positive rate
True positive rate
0.0 0.2 0.4 0.6 0.8 1.0
0.00.20.40.60.81.0
N.features = 25 genesROC = 0.93
KNNXValidation GBM Random forest WeightedVotingXValidation N.Features/ROC N.Features/ROC N.Features/ROC N.Features/ROC
Round 1 30 / 0.75 25 / 0.93 30 / 0.83 10 / 0.74
Round 2 140 / 0.64 50 / 0.91 25 / 0.77 45 / 0.68
Round 3 140 / 0.56 70 / 0.91 105 / 0.73 110 / 0.62 Round 4 150 / 0.49 150 / 0.92 60 / 0.74 145 / 0.56 Round 5 150 / 0.46 145 / 0.92 110 / 0.74 135 / 0.37
Round 6 150 / 0.47 95 / 0.97 15 / 0.74 ---
Round 7 145 / 0.41 --- 35 / 0.73 ---
Round 8 --- --- 55 / 0.67 ---
Round 9 --- --- 35 / 0.75 ---
Method
0 50 0 50
50 60 70 80 90 100 110
100 100
r = 0.972 p < 0.0001
Number of genes150 200 Number of genes150 200
CI values of OS analyses HR values of OS analyses
Probablity of survival Probablity of survival 0
5
0 10 15 20 25
0.00.20.40.60.81.0
Concordance Index = 62.92 HR = 4.54, p = 6.274
170, CI = 56.2 28, CI = 59.3
Round 1= 30 genes
KNN selected genes KNN selected genes
Time Time
0
5
0 10 15 20 25
0.00.20.40.60.81.0
Concordance Index = 92.38 HR = 37.37, p = 3.21641, +:18, CI=74.6
157, CI = 92.641, CI = 74.6
Round 7= 145 genes Random forest round1
WeightVotingXValidation round1 KNN round1 GBM round1
True positive rate True positive rate
False positive rate False positive rate
0.0 0.2 0.4 0.6 0.8 1.0 0.0 0.2 0.4 0.6 0.8 1.0
0.00.20.40.60.81.0
N.feature = 10 genes N.feature = 30 genes
ROC = 0.74 ROC = 0.75
Samples Samples
0 10 20 30 40
p = < 0.0001 r = 0.75 (a)
(b) (c) (d)
-1.10 -1.00 -0.90 -0.80 -0.70 -0.60 -0.50 -0.40 -0.30 -0.20 -0.100.000.100.200.300.400.500.600.700.800.901.001.10
-1.10 -1.00-0.90-0.80-0.70-0.60-0.50-0.40-0.30-0.20-0.100.000.100.200.300.400.500.600.700.800.901.001.10
IDC
IDC DCIS
DCIS
−09 −09
Figure 2.
Machine-learning (ML) predictive models and survival analyses. (a) ROC plots and plots
obtained by a prediction results viewer for the first round of feature selection by four different ML
models. Separation of DCIS and IDC samples was achieved by both models. (b) ROC results of the
first nine rounds of feature selection. After each round of feature selection, we excluded this gene list
feature from the DEG source and repeated it for a new feature selection. Note that we did not continue
feature generation if ROC/AUC was constant or dropped below 0.5. (c) Kaplan-Meier survival analyses
of the first and the last rounds of gene feature selection optimized using the KNN model. Note that the
last feature with ROC below 0.5 (panel b) also strongly correlated with survival. All log rank tests were
significant (p
<0.05; p-value generated by SurvExpress online server). (d) Correlation of concordance
index (CI; left) and hazard ratio (HR; right) obtained from overall survival (OS) analyses with the
number of genes in each gene feature (see Figure S2b; Pearson correlation test).
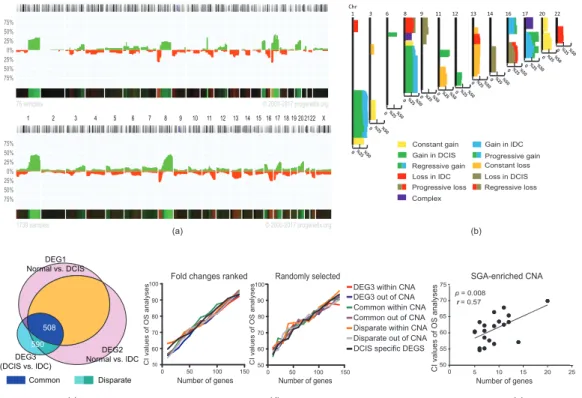
2.3. Stage-Dependent CNA and SGA Integrative Analyses Did Not Generate Malignancy-Predictive Features The aggravation of chromosomal aberration is a general aspect of tumor progression in the evolutionary path toward advanced stages [27]. We speculated that the integration of CNA (copy-number alteration) and SGA (single gene alteration, extracted from DEGs) would help us to find a better discriminative feature for sorting DCIS from IDC samples. Indeed, we assumed that the integration of SGAs and CNAs would generate better discriminative features to distinguish DCIS and IDC in correlation with malignancy outcomes (e.g., survival analyses). To test this hypothesis, we extracted the CNA map of DCIS and IDC samples (Progenetix, database; version 2017; 76 DCIS and 1736 IDC samples; Figure 3a, and Table S2). We assumed that all cases of IDC had experienced a DCIS stage during tumor progression. Thus, we generated a combined map of the CNAs of DCIS and IDC to depict an evolutionary view of the CNA map for breast tumors (Figure 3b). This map generated 25 prototypes, including five prototypes that were specific for DCIS and three prototypes that were specific for IDC. There were two complex prototypes without clear gain and loss patterns in correlation with the DCIS or IDC stage (see Section 4.4 and Tables S2 and S3). We also found 15 shared prototypes between DCIS and IDC. On the other hand, not all SGAs were generated de novo in IDC.
Almost half of the SGAs (508 out of 1098 for DEG3, extracted from IDC vs. DCIS) originated from DCIS (referred to herein as “common genes”), and their changes became stronger in IDC. The rest of the SGAs, which we refer to as “disparate genes”, including SGAs, were generated exclusively in the IDC stage (Figure 3c, Figure S3a, and Table S1). Next, we distributed the SGAs in CNAs and ranked them based on log fold-changes (LFC). We then tested if any of these gene sets (common/disparate, within/not within CNAs) had a better CI to the survival outcomes. For this analysis, we selected features of 10 genes (arbitrary number) and added 10 more genes for the next features. We performed these analyses for the fold-changed ranked gene lists and for the random list. Interestingly, the CIs of all groups of SGAs were correlated to the number of genes in each feature and not to their CNA-related category (Figure 3d and Figure S3b). We further assessed whether SGA-enriched parts of chromosomal regions within CNAs (regions with many SGAs, with not more than 5 Mb distance to the next SGA;
Table S3) might have a stronger correlation to malignancy outcomes compared to other chromosomal regions. Our results recapitulated previous findings that the number of genes defines the strength of CI, and not the specific region (p = 0.008, Pearson correlation test; Figure 3e). Furthermore, we could not find a significant consistency between the directions of expressed genes in the source of selected feature genes (IDC) and the poor- and good-prognosis samples in the survival analyses (Figure S3c).
Finally, we tested several well-known gene signatures that are used in clinical settings and found that
the number of genes in these signatures strongly correlated to their CI power (Figure S3d). Altogether,
these results suggest that the increase in genetic alterations in IDC as compared to DCIS does not
necessarily increase the malignant properties of tumors.
Chr1 3 6 8 9 11 12 13 14 16 17 20 22
1 2 3 4 5 6 7 8 9 10 11 12 13 14 15 16 17 18 19 202122 X
75%
50%
25%
0%
25%
50%
75%
76 samples © 2000-2017 progenetix.org
1 2 3 4 5 6 7 8 9 10 11 12 13 14 15 16 17 18 19 202122 X
75%
50%
25%
0%
25%
50%
75%
1739 samples © 2000-2017 progenetix.org
0 %25 %50 0 %25 %50
0 %25 %50 0 %25 %500 %25 %500 %25 %500 %25 %500 %25 %50 0 %25 %500 %25 %500 %25 %500 %25 %50
0 %25 %50
Constant gain
Complex
Constant loss Gain in DCIS Progressive gain
Progressive loss Regressive loss Regressive gain
Gain in IDC
Loss in IDC Loss in DCIS
CI values of OS analyses
Fold changes ranked
Number of genes
CI values of OS analyses
0 50
50 60 70 80 90 100
100 150
Randomly selected
Number of genes Number of genes
SGA-enriched CNA
0 5
50 55 60 65 70 75 p = 0.008
r = 0.57
10 15 20 25
500 60 70 80 90 100
50 100 150
Dispar ate
DEG3 within CNA Common within CNA Disparate within CNA Common out of CNA Disparate out of CNA DCIS specific DEGS DEG3 out of CNA
(a) (b)
(c) (d) (e)
CI values of OS analyses
Normal vs. DCISDEG1
Normal vs. IDCDEG2 (DCIS vs. IDC)DEG3
508 590
Common Disparate
Figure 3.
Integration of copy-number alteration (CNA) and single gene alteration (SGA) of DCIS and IDC. (a) CNA map of DCIS (up) and IDC (down) obtained from Progenetix database (DCIS
=76, IDC
=1739). The y-axis depicts the percentage of samples with aberrations (green stands for gain and red stands for loss) for each chromosomal region. (b) Map of CNA prototypes (see also Table S3).
(c) A Venn diagram of common and disparate genes. (d) Correlation of concordance index (CI) obtained from overall survival (OS) analyses with the number of genes that selected based on ranked (left) or random (right) fold-changes to overall survival. Genes were selected from common, disparate, DCIS-specific, and DEG3 (IDC vs. DCIS) within and outside of CNAs. (e) Correlation of CI obtained from OS analyses with the number of genes in SGA-enriched CNA. The p-value in (e) was calculated by a Pearson correlation test.
2.4. Genetic Changes in Earlier Tumor Stages Were More Functional Than in Later Stages
The constant malignant properties of tumors in premalignant stages raise a question about the role of the accumulation of genetic alterations in later stages. To address this question, we first explored the functions of earlier and later events during tumor evolution, as well as the possible interactions between them. We assumed that each CNA prototype is an evolutionary unit (Figure 3b) wherein we can assess the correlation between the direction of CNA and SGA changes during the progression of tumors from DCIS to IDC. The IDC has two types of gene expression profile: common, which originates from DCIS;
and disparate, which is acquired specifically in IDC (see Figure 3c and Table S1). In addition, there are
different types of CNAs for IDC and DCIS: DCIS-specific, which only exists in DCIS; progressive
CNAs, which are inherited from DCIS and progress further in IDC; IDC-specific, which is acquired
specifically in IDC; and constant CNAs, which are constant changes (gain or loss of function) in DCIS
and IDC. First, we calculated the density of common and disparate up- and downregulated genes in
their CNA prototypes (SGA density is the number of SGA/Mb; Table S4). We then specifically tested
whether the expression direction of common and disparate SGA density was similar to the direction of
CNAs in each stage (Figure S4a). Our results revealed a positive correlation between the expression
direction of SGAs and the direction (gain or loss) of CNAs in each tumor stage (p = 0.008 for common
genes in constant CNAs and DCIS CNAs, p = 0.06 for disparate genes in constant CNAs and IDC
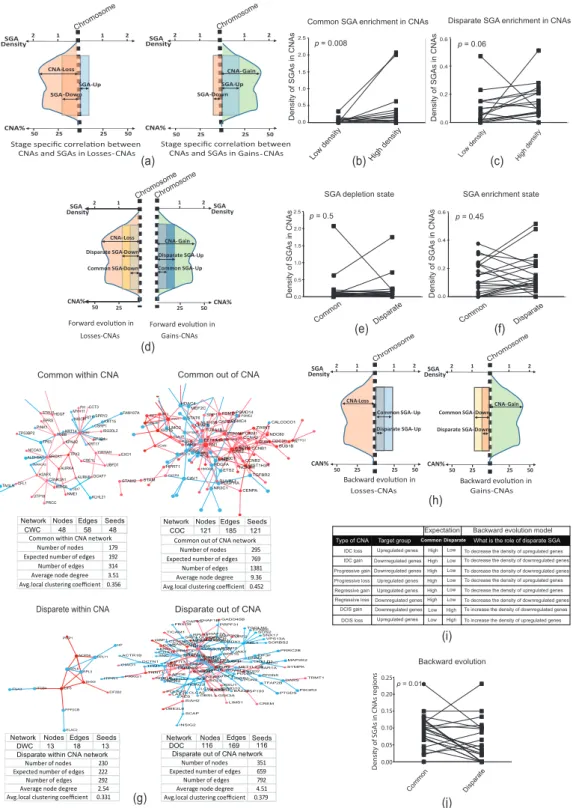
CNAs, Wilcoxon matched-pair signed rank test; Figure 4a–c and Figure S4a,b). We then sought a serial
relationship between common and disparate SGAs and their correlation to the direction of CNAs.
Since the direction of changes of SGAs and CNAs in the stage-dependent analyses were harmonic and DCIS and IDC had indistinguishable gene expression profiles, we speculated a positive correlation between the direction of IDC CNAs and the direction of changes for both common and disparate SGAs.
Here, we assumed a forward evolution model in which the disparate SGAs increased the density of SGAs in the direction (up- or downregulation) of existing common SGAs in the IDC-specific and IDC-progressive CNAs (Figure 4d and Figure S4c). Surprisingly, we could not confirm the forward evolution model for the consequential common and disparate SGAs in the CNAs related to IDC (Figure 4d–f). Subsequently, we analyzed the functional interactions of common and disparate SGAs using protein-protein interaction networks (PPINs). We separated SGAs into two categories: SGAs within and outside of CNAs. Interestingly, we found that common SGAs were the most interactive in the specific PPIN analyses, as shown by the higher average node degree (Figure 4g). Notably, SGAs within CNAs were poorly connected in the networks. In addition, gene-set enrichment analyses (GSEA) revealed the enrichment of more functional pathways for the common gene sets compared to disparate genes and SGAs in the CNAs (Figure S4d).
Up to this point, our results suggested that the progression of CNAs in later stages did not increase
the density of SGAs in each given CNA. Surprisingly, further genetic alterations specific to the later
stages did not generate further signaling pathways in the tumor, contradicting a forward evolution
model for extra genetic alterations in the later stages. Hence, we proposed two scenarios to explain
the role of further genetic alterations in the later stages. The first scenario was to consider a neutral
evolution model whereby further genetic alterations randomly accumulate in tumors. This scenario
might be accurate, but is difficult to test. In a substitute scenario, we hypothesized a backward
evolution in the later stages, serving to reverse the expression of unwanted genes inherited from earlier
stages. In a backward evolutionary model, we supposed that CNAs in the later stages would function
in the reverse direction to SGAs from earlier stages within that region (Figure 4h,i). For example,
the forward evolution model supposed an additive impact whereby an IDC CNA gain increases the
density of upregulated SGAs (which failed; see Figure 4d,f); however, the backward evolution model
posited that an IDC CNA gain is selected to decrease the density of downregulated SGAs in that
given chromosomal region, inherited from the DCIS stage (Figure 4i). Our results corroborated this
hypothesis in that we found that later CNAs reversed the density of common SGAs in those regions
(p = 0.01, Wilcoxon matched-pair signed rank test; Figure 4j and Figure S4e). This hypothesis was
further supported by CNAs being constant (the percentage of gain or loss was constant) through the
DCIS and IDC stages. In these constant CNAs, the density of common and disparate SGA did not
change in the forward or backward models (Figure S4f–h). Therefore, we concluded that CNAs could
serve as backward evolutionary tools in later stages to reverse the expression of some of the SGAs
inherited from earlier stages.
High density Low density
p = 0.06
Disparate SGA enrichment in CNAs
Density of SGAs in CNAs
Density of SGAs in CNAs 0.0
0.2 0.4 0.6
Chromosome Chromosome
CNA-Gain SGA-Up SGA-Down
25
25 50
CNA% 50
1
1 2
SGA 2 Density
Stage specific correla�on between CNAs and SGAs inGains- CNA-Loss
SGA-Up SGA-Down
25
25 50
CNA% 50
1
1 2
SGA 2 Density
Stage specific correla�on between
CNAs and SGAs inLosses CNAs- CNAs
Gains-CNAs
Gains-CNAs Losses-CNAs
Losses-CNAs
0.0 0.5
p = 0.5
p = 0.01 Common
Common Disparate
Disparate SGA depletion state
Density of SGAs in CNAs
1.0 2.0 1.5 2.5
0.2
Disparate Common
0.0
SGA enrichment state
Density of SGAs in CNAs
p = 0.45
0.4 0.6
ChromosomeChromosome
CNA-Gain Disparate SGA-Up
25 50 CNA%
1 2 DensitySGA
Common SGA-Up CNA-Loss
Disparate SGA-Down
50 25 CNA%
2 1
Density SGA
Common SGA-Down
Forward evolu�on in Forward evolu�on in
Network Nodes Edges Seeds
CWC 48 58 48
STAU1HDGF TP53BP2
EPRS PINK1
TP63 TUBB
MYH11FH CCT3 RIT1 SPRY2 FAM107A NISCH
KRT14GRB2 KPNA2 KRT17
KRT15 CSRP1
ISG20L2 SF3B4CFH NCOA3
ALDH9A1 BRCA1 SMARCA2
H2AFX AURKA TAGLNCFL1
CSNK2A1 BIRC5 UTP18
PRCC TPX2
CSE1L YWHAH EXO1
UBFD1 AURKB CBX7 NME1 KLHL21
DCAF7
Common within CNA
PWP1
NOP56 HP RPL11 RPL6RPL3
DHX9 ITGA3 ITGB4 EIF6
PPP2CB EIF2B2
ELAC2
Network Nodes Edges Seeds
DWC 13 18 13
Network Nodes Edges Seeds COC 121 185 121
HDAC4 MEF2C IRF7 CXCL10 IRF9
STAT1 LMO2
STAT6 SPP1 CKAP5NUP155 ISG15
PLAUR VCAN
PTBP1 SPTBN1 TUBA1B TARS EEF1A1
FN1 PSMD14 PSMD1
PSMC4 CAPZA1
PSME2 ZWINT CDK4PSMA6 BARD1FEN1LMNB1FOXM1CCNA2
BUB1 CALCOCO1 NDC80
CDC20 BUB1BTTK
PTTG1
STAM2 STAM CXCL12SNCACIRBP
RPL9ERG HPRT1
CXCR4 HMGB2 CAV1
CKS2CDK1 ACTR2 MCM6MMERCC1
EZH2 CCNB1 CCNB2 ETS2 PDGFA
RUVBL1 HIST1H3H NCAPH
TGFBR2 NR3C1PDGFRA
CENPA
Common out of CNA
Disparete within CNA
GBP1 FBXO9 TICAM1
DAPK3CHAF1B
CCNG2 PCK2RABGGTA
SKP1RPL34 DPYSL3MAPRE2
CHAF1A CCNG1 CCND3
TNFAIP3 ACTR1B
CIAO1 DCTN1 TPM1 TNNT1
ENG PTHLH PRMT1
TNC SMAD3
CDK2 IDH1
RPL31ENO2 SSB
RPS13 CDC37 FHL2IFIT3
LARP1CHUKRPS4X IFIT2
SUMO4NFKB2GSK3B PRPF31
GADD45B EFNA5SOS2 TGOLN2 CEBPGMAP3K5
AZGP1PRDX1 UPF2
ABL1 SNX17
VPS13A SORBS2 ATP5A1BTBD2
HSPD1 RPS15JAK1
EIF3F DNM2 RPLP1
PTN U2AF1 IL7RRUVBL2
CRELD1 METTL21B
SOD2 PRRC2B MCC SAR1A
MAP2K2 SYMPK ITPR1 PRKG1 RRP1BNOS3ITGA2
APOE RCN2 ALB NFKB1
HDAC3 POLR2G
LAS1L CLCA2AES LCN2 OBSL1 UBE2L6
SIAH2
INSIG2 SCAP
CTBP2 BCL3
RSU1 IGBP1
PDLIM1 PON2 COMMD4IL1BPSMD10
GSK3A BAZ2BSP100
PFDN5 TFAP2B
TRMT1 DARS PTGDSPIK3R3 LIMS1 CREM
Disparate out of CNA Number of nodes 295 Expected number of edges 769 Number of edges 1381 Average node degree 9.36 Avg.local clustering coefficient 0.452
Common out of CNA network Number of nodes 179
Expected number of edges 192 Number of edges 314 Average node degree 3.51 Avg.local clustering coefficient 0.356 Common within CNA network
Number of nodes 230 Expected number of edges 222 Number of edges 292 Average node degree 2.54 Avg.local clustering coefficient 0.331 Disparate within CNA network
Network Nodes Edges Seeds
DOC 116 169 116
Number of nodes 351 Expected number of edges 659 Number of edges 792 Average node degree 4.51 Avg.local clustering coefficient 0.379 Disparate out of CNA network
0.00 0.05 0.10 0.15
Backward evolution 0.20
0.25
Density of SGAs in CNAs regions
Chromosome Chromosome
CNA-Gain Common SGA-Down
Disparate SGA-Down
25
25 50
CAN%50
1
1 2
SGA 2 Density
CNA-Loss
Common SGA-Up
Disparate SGA-Up
25
25 50
CAN%50
1
1 2
SGA 2 Density
Backward evolu�on in Backward evolu�on in Common SGA enrichment in CNAs
Low density High density p = 0.008
0.0 0.5 1.0 2.0 2.5
1.5
(a)
(d)
(g)
(e)
(h)
(i)
(j)
(f)
(b) (c)
IDC loss
DCIS loss DCIS gain IDC gain Progressive gain
Regressive gain Regressive loss
High High High Low Low
Low Low Low Low Low Low
High High High High High
Progressive loss Upregulated genes
Upregulated genes Downregulated genes Downregulated genes Downregulated genes Downregulated genes Upregulated genes Upregulated genes Target group Common Disparate
Expectation Backward evolution model To decrease the density of upregulated genes
To decrease the density of upregulated genes To decrease the density of upregulated genes To decrease the density of downregulated genes To decrease the density of downregulated genes
To decrease the density of downregulated genes To increase the density of downregulated genes To increase the density of upregulated genes
What is the role of disparate SGA Type of CNA
Figure 4.
Evolutionary correlation models of SGAs and CNAs. (a) This scheme depicts the expectation
of stage-specific correlation between the direction of CNAs and SGAs. It was expected that the density
of upregulated SGAs would be higher than that of downregulated SGAs in gain CNAs (right) and
the density of downregulated SGAs would be higher than that of upregulated SGAs in loss CNAs
(left). (b) Common SGAs were correlated with the direction of CNA prototypes of DCIS. The density of
downregulated genes was high in loss CNAs and the density of upregulated genes was high in gain
CNAs (see Figure S4a). (c) Disparate SGAs were correlated with the direction of CNA prototypes of
IDC. The density of downregulated genes was high in loss CNAs and the density of upregulated genes is high in gain CNAs (see also Figure S4b). (d) This scheme depicts the expectation of forward evolution for the common and disparate SGAs in IDC CNAs. It was expected that the density of disparate upregulated SGAs would be higher than that of common upregulated SGAs in gain CNAs (right), and that the density of disparate downregulated SGAs would be higher than common downregulated SGAs in loss CNAs (left; see also Figure S4c). (e,f) The forward evolution model was not confirmed either for the SGA-depletion state (e) or the SGA-enrichment state (f; see Figure
4c). (g) Specificprotein-protein interaction networks (PPINs) of common SGAs within CNAs (CWC), common outside of CNAs (COC), disparate within CNAs (DWC), and disparate outside of CNAs (DOC). Networks were constructed by mapping gene sets to the human PPIN database. Blue and red nodes represent down- and upregulated genes, respectively. PPINs statistics were calculated by STRING (https://string-db.org/).
(h) This scheme depicts the expectation of backward evolution for the common and disparate SGAs in IDC CNAs. It was expected that backward evolution would decrease the density of upregulated SGAs in loss CNAs (left) and the density of downregulated SGAs in gain CNAs (right). (i) The table presents a backward evolution concept (the numbers for this prediction are presented in Figure S4e). Note that we evaluated all SGAs (common and disparate) in the IDC CNAs or progressive CNAs prototypes as the final evolved version of CNAs. (j) Evaluation of backward evolution. p-values in panels (b,c,e,f,j) were calculated by Wilcoxon matched-pair signed rank test.
2.5. Forward and Backward Evolution Models Were Exploited for the Fine-Tuning of Operating Pathways during Tumor Progression
To better understand the role of early and late genetic alterations during tumor progression, we performed more functional analyses. Since in the late stage of tumors, genetic alterations are the accumulative results of the early (common SGAs) and late stages (disparate SGAs), we studied the function of disparate SGAs as a part of the whole running program (common + disparate) in the late stage. Therefore, we performed PPIN analyses for common SGAs and all DEG3 (all common and disparate SGAs), independent of their chromosomal loci. Surprisingly, we found that the higher connectivity of the network suggested more intricate biological functions for the protein network of all DEG3 compared to the common SGAs (Figure S5a). We then performed GSEA for both networks and found that the common SGA profile was mostly related to cell proliferation pathways. Interestingly, all of these proliferation-related pathways were enriched in DEG3, which indicates the constant role of selected pathways during tumor progression (Figure S5b and Table S5).
We then investigated how further genetic alterations might affect the function of selected pathways from earlier stages. Closer inspection of PPINs suggested that highly interactive nodes in the common PPINs were more homogenous in their connections compared to the PPINs of DEG3 (a similar color, which means similar direction of expression; Figure 5a and Figure S5c). Thus, we assessed the homogeneity and heterogeneity of highly interactive protein nodes in the PPINs. For this purpose, we analyzed all nodes with ≥ 4 connections and considered them to be homogeneous nodes if ≥ 75% of connections showed a similar direction of expression (up-/downregulation). Our analyses revealed that the homogeneity of highly interacting protein nodes in common genes that originated from DCIS stages was 2-3 times greater than at later stages (p < 0.0001, chi-square test; Figure 5b, and Table S6).
These results, along with the information from GSEAs (Figure S5b), suggested that earlier operating
pathways stay constant during tumor progression; however, the relationships between the involved
components become more complex.
To investigate the functionality of the acquired complexity, we expanded our analyses by using signaling pathway impact analyses (SPIA) to track the functions of changes in the enriched pathways.
The biggest advantage of SPIA is its ability to quantify the direction of changes by integrating the effect of topological positioning, gene expression values, and the impact of players’ interaction (inhibition or activation) in a given enriched pathway [28]. Therefore, we performed SPIA for (i) common SGAs out of CNAs as an earlier event in comparison with all SGAs of DEG3 out of CNAs, and (ii) all common SGAs as compared to all DEG3 to understand the functional impact of SGAs within the CNAs in the enriched pathways. Our analyses for the SGAs (only SGAs out of CNAs) showed that only five pathways had significant perturbation for the common profile (Figure 5c, Table S7). Next, we found that the perturbation of enriched pathways for common SGAs increased when we tested all SGAs (only SGAs out of CNAs; Figure 5d; p = 0.03 Student’s paired t-Test), which indicated that SGAs increase the function of selected pathways in a forward evolution manner. Similarly, we performed SPIA for all SGAs of common genes compared to all DEG3 (all SGAs within and outside of CNAs). Interestingly, perturbation was detected for only seven pathways (Figure 5e). Consistently, the perturbation values increased in the same enriched pathway in all DEG3 compared to the common profile (Figure 5f;
p = 0.007, Student’s paired t-Test). These results indicated that further genetic alterations in later stages do not establish new paths for the operating pathways of tumor cells, but rather fine-tune and increase the function of descendant pathways, which can be explained by the forward evolution model.
In the next step, we functionally assessed the existence of backward evolution during tumor progression. In the previous section, we showed that CNAs in later stages serve to decrease the load of SGAs inherited from earlier stages in those regions where their function was left unaddressed (see Section 2.4 and Figure 4j). Here, we hypothesized that the reverting of SGAs by CNAs in the later stages increases the function of selected pathways in later stages. In this order, we sorted all genes from DEG1 (DCIS vs. normal; those are prone to reversal by CNA in later stages) that existed in the seven enriched pathways with significant perturbation from the SPIA results of DEG3 (Figure 5f).
We found eight DCIS-upregulated genes in the CNA regions (six out of the seven enriched pathways) with a supposed backward evolution function (their expression reversed by CNA in later stage; CNA regions are listed in Figure S4e) and added them to the DEG3 along with their original gene expression values from DCIS and ran SPIA. Remarkably, the perturbation of these six pathways significantly decreased upon adding the mentioned eight genes from DCIS (Figure 5g; p = 0.03, Student’s paired t-Test; Figure S5d). We further tested these eight genes for correlation with the survival of patients with invasive breast carcinoma (TCGA data deposited in Survexpress), which showed significant prognostic value for the discrimination of poor- and good-prognosis samples. Interestingly, all of these genes had similar (higher) expression to their DCIS source in the good-prognosis samples compared to poor-prognosis ones (Figure 5h,i).
Altogether, these results indicated that SGAs in advanced stages, which are inherited from earlier
stages, play a prominent role in the construction of functional signaling pathways. Those SGAs that
are acquired in later stages serve as fine-tuners for the functions of SGAs that are inherited from earlier
stages. These results further suggest that CNAs have no driving role in the evolution of functional
signaling pathways of tumors, but, rather, are tools exploited by tumors for the fine-tuning in a forward
or backward evolution model.
−1 0 1 2
−0.10.00.10.20.30.40.5
pathway ID=04512
Log2 FC
Perturbation accumulation (Acc)
−4 −20 246
0.000.050.100.150.200.25
Total Perturbation Accumulation
−1 0 1 2
−0.10.00.10.20.30.40.50.6
pathway ID=04512
Log2 FC
Perturbation accumulation (Acc)
−4 −20 246 8
0.000.050.100.150.20
pathway ID=04512 P PERT=0
−1 0 1 2
−0.20.00.20.4
pathway ID=04512
Perturbation accumulation (Acc)
−6 −4 −20 246
0.000.050.100.150.200.25Density
−1 0 1 2
−0.20.00.20.40.6
pathway ID=04512
Log2 FC
Perturbation accumulation (Acc)
−5 0 5
0.000.050.100.150.20Density
0 50 100 150 200
0.00.20.40.60.81.0
Concordance Index = 69.72 HR = 3.89, p=8.066
370, CI = 51.1 132, CI = 55.7
−2024Gene Expression Level
Gene Expression By Risk Group
CCND1 CSNK1E CTNNBIP1 HLA−DOB ITGA3 WNT7B TRAF5 ITGA10
p=4.48 p=1.29 p=1.11 p=7.50 p=2.45 p=6.50 p=4.13 p=6.29
2−Low Risk 1−High Risk 0 5 10 15 20
Common pathways All pathways 0
p < 0.0001
Homogene Heterogene
Common All
% Ferequency
n = 57 n = 86 n =185 n = 29
20 40 60 80 100
(a)
(e) (f)
(g) (h) (i)
(d)
(b)
(c)
ECM-receptor interaction (after fine-tuning) ECM-receptor interaction (before fine-tuning)
ECM-receptor interaction (before fine-tuning) ECM-receptor interaction (after fine-tuning)
Perturbation valuePerturbation value Perturbation value
0 5 10 15 20
p = 0.03
After fine-tuning Before fine-tuning 0
5 10 15 p = 0.03
p = 0.007
Common pathways out of CNA
All pathways out of CNA
Homogene nodes Heterogene nodes
Total Perturbation Accumulation Total Perturbation Accumulation
Density
Density
pathway ID=04512 P PERT=0.001
pathway ID=04512 P PERT=0.006 pathway ID=04512 P PERT=0.02
Total Perturbation Accumulation (TA) Total Perturbation Accumulation (TA)
Log2 FC
−08 -03 -16 -13 -08 -04 -03 -01 -14
Figure 5.