Integrative functional genomic search for regulatory DNA sequence polymorphisms influencing DNA methylation and mRNA
expression in hippocampal brain tissue
I n a u g u r a l - D i s s e r t a t i o n
zur
Erlangung des Doktorgrades
der Mathematisch-Naturwissenschaftlichen Fakultät der Universität zu Köln
vorgelegt von
Ann-Kathrin Ruppert
aus Köln
2015
Berichterstatter:
Prof. Dr. Peter Nürnberg Prof. Dr. Peter M. Schneider Vorsitz der Prüfung:
Prof. Dr. Peter Kloppenburg
Beisitzerin:
Dr. Birgit Budde
Tag der mündlichen Prüfung: 15.06.2015
I
Z USAMMENFASSUNG
Obgleich bekannt ist, dass die Ausprägung zahlreicher neuropsychiatrischer Erkrankungen genetisch bedingt ist, sind die grundlegenden Mechanismen dieses Zusammenhangs noch weitestgehend unbekannt. Eine Methode, um Einblicke in die Genetik neuropsychiatrischer Erkrankungen zu erhalten, sind genomweite Assoziationsstudien (GWASs). Mit Hilfe dieser konnten bisher über 2.000 Loci für genetische Risikofaktoren von Hirnerkrankungen identifiziert werden. Die Mehrheit dieser Loci befindet sich in nicht-codierenden DNA-Bereichen, was ihre funktionelle Erforschung erschwert.
Die vorliegende Arbeit geht der Fragestellung nach, inwieweit regulatorische Sequenzvarianten, welche DNA-Methylierung und Genexpression beeinflussen, zur genetischen Disposition von neuropsychiatrischen Erkrankungen beitragen.
Meine Studie nutzt einen integrativen Ansatz der funktionellen Genomik, um epigenetische Regulationen im hippocampalen Hirngewebe bei Patienten mit pharmakoresistenter mesialer Temporallappenepilepsie zu untersuchen. Hierzu wurden SNP-Genotypen mit genomweiter CpG- Methylierung und mRNA Genexpression korreliert. Die daraus resultierenden »genomweiten Landkarten« von quantitativen Methylierungs Trait Loci (meQTLs) und quantitativen Expressions Trait Loci (eQTLs) wurden zur Lokalisation von regulatorischen SNPs (rSNPs) verwendet die in Zusammenhang mit einigen Hirnerkrankungen stehen (488 GWAS Katalog Einträge, P < 5,0 x 10⁻⁸).
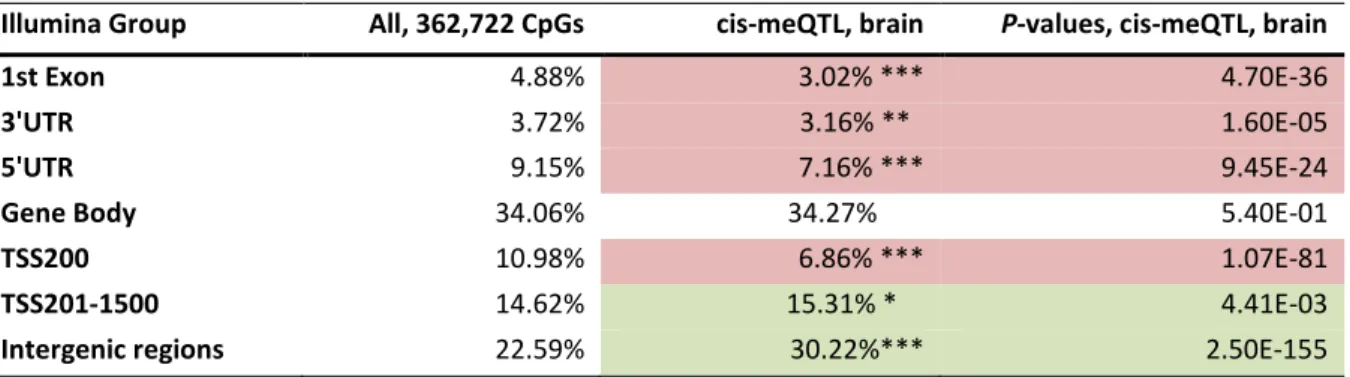
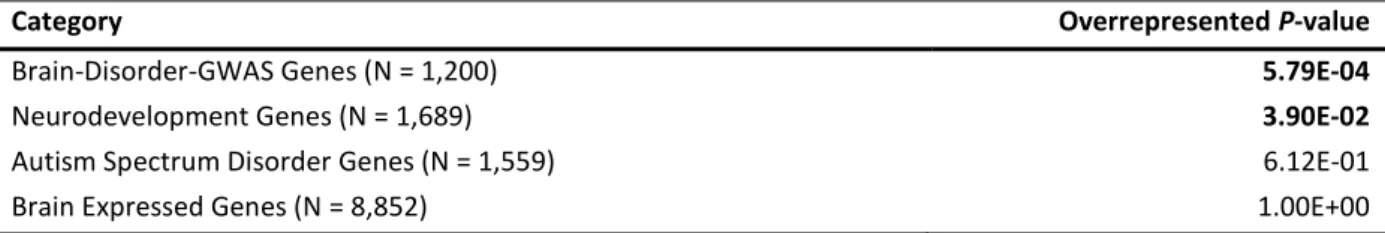
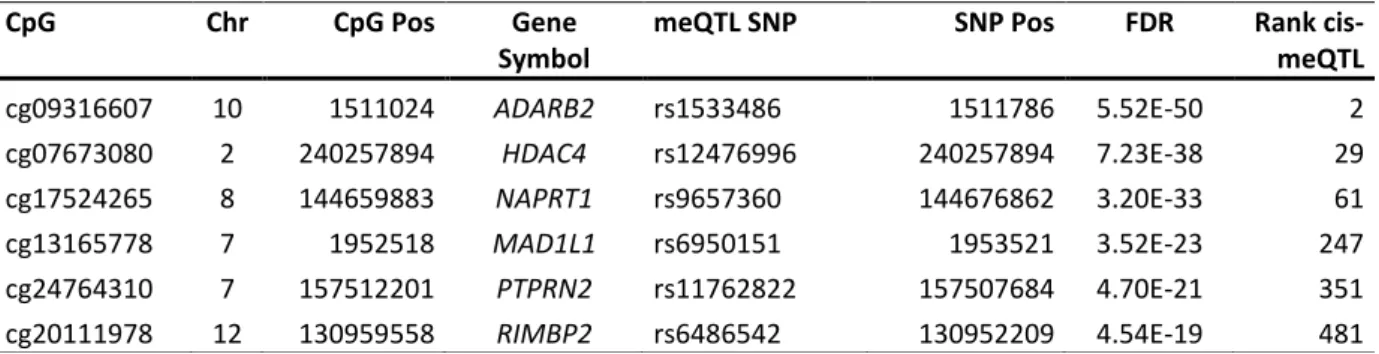
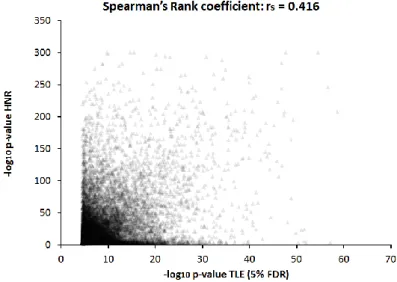
Die vorliegende Arbeit stellt die erste meQTL Studie dar, welche den leistungsfähigen Human Methylation450 array auf Basis von frisch-gefrorenem menschlichem Hirngewebe verwendet. Mit Hilfe einer linearen Regressionsanalyse und unter Berücksichtigung einer Korrektur für die Gewebeheterogenität, wurden insgesamt 19.954 (8,5% der 362.000 CpGs) cis-regulierte meQTLs identifiziert. Dies entspricht einer Versechsfachung der bisher bekannten meQTLs aus postmortalem Hirngewebe. Eine signifikante Anreicherung der meQTLs in der 5´-regulatorischen Region vor den Genpromotoren (TSS201-1500; P = 7,7 x 10-61) spiegelt den funktionellen Einfluss dieser Region wider, welche Enhancer als auch Insulatoren beherbergt. Es hat sich gezeigt, dass einige der hoch signifikanten cis-meQTLs bekannte Kandidaten Gene für neurologische Entwicklungsstörungen beeinflussen (ADARB2, HDAC4, NAPRT1, MAD1L1, PTPRN2 und RIMBP2). Die Gewebespezifität wurde anhand einer weiteren meQTL-Analyse, unter Beibehaltung gleicher experimenteller Bedingungen, in Blutzellen von 496 deutsch stämmigen Kontrollproben ohne neuropsychiatrische Erkrankungen untersucht. 65% der im Hirngewebe identifizierten meQTLs konnten auch in Blutzellen wiedergefunden werden (Spearman Rank Koeffizient = 0,42). Diese nennenswerte Übereinstimmung eröffnet die Möglichkeit, epigenetische Biomarker für komplexe Hirnerkrankungen in einfach zugänglichem Gewebe auszuwählen. Die zusätzlich zur meQTL Analyse durchgeführte eQTL Analyse konnte unter den 31.000 mRNA-Sonden insgesamt 734 signifikant cis-wirkende eQTLs identifizieren.
II
In einer weiteren Analyse wurden CpG-Methylierung und Genexpression korreliert – diese stellt die erste systematische Untersuchung dieser Form in frisch-gefrorenem Hirngewebe dar. Hierbei wurden sowohl negative (73%) als auch positive (27%) Korrelationen beobachtet. Die stärksten negativen Korrelationen wurden bei dem Gen NAPRT1, welches die Nicotinat Phosphoribosyltransferase kodiert, beobachtet. Des Weiteren konnte bei den mit NAPRT1 assoziierten meQTLs und eQTLs eine genetische Beeinflussung durch ein und denselben SNP rs9657360 festgestellt werden. Die Korrelations-Ergebnisse kombiniert mit der genetischen Beeinflussung des SNPs zeigten auf, dass das minor C Allel eben dieses SNPs mit einer erhöhten Methylierung in der NAPRT1-Promoterregion und einer verminderten Genexpression assoziiert ist. Die Kombination aus einer tumorspezifischen Hypermethylierung einer in der Promoterregion gelegenen CpG island mit gleichzeitiger Verminderung der NAPRT1 Expression wurde ebenfalls in der Krebsforschung erkannt: NAPRT1 kann als prädiktiver Biomarker zur Therapie von Karzinomen mit NAMPT Inhibitoren eingesetzt werden.
Durch den innovativen Ansatz, translationale Auswirkungen der epigenetischen Regulation der Genexpression in Kombination mit meQTLs und eQTLs zu testen, wurde zusätzliche eine genetische Determination erkannt. Diese ist von großer klinischer Bedeutung, da sie einen Ansatz zur Erfassung von Patienten erlaubt, die von der Gabe von NAMPT Inhibitoren profitieren können.
Zusätzlich wurde eine Imprinting meQTL (imeQTL) Analyse durchgeführt, um das Potential der Kombination aus Imprinting und Methylierung zu untersuchen. Zur Erfassung der imeQTLs wurde der Methylierungsstatus von 269 Individuen (auf Basis von Blutzellen), stratifiziert nach den elterlich inversen heterozygoten Genotypen, verglichen. Insgesamt konnten 177 CpGs an 31 genomischen Loci identifiziert werden, von denen 22 bisher unbekannte Imprinting Regionen darstellen. Die stärkste Auswirkung von Parent-of-Origin-Effekte auf Methylierung wurde in Regionen beobachtet, die Gene für neurologische Entwicklungsstörungen beherbergen, sowie im chromosomalen Segment 3p21.1, welches eine GWAS Kandidaten Region für affektive Störungen ist. Positionelle Gene in Imprinting Regionen sind aussichtsreiche Kandidaten Gene aufgrund ihrer potentiell monoallelischen Genexpression. Hierdurch wird es möglich, potentiell rezessive Erkrankungsmutationen zu ermitteln.
Die Enrichment Analysen von cis-meQTL assoziierten Genen ergab eine Überrepräsentation von Genen, die positionell im Bereich von GWAS Loci liegen (P = 5,8 x 10⁻⁴). Potentielle rSNPs wurden in der GWAS Kandidaten Region von 1q31.2 (RGS1) und von 3p21.1 (PRBM1) lokalisiert. Die allelische Veränderung von Transkriptionsfaktor-Bindungsstellen durch potentielle rSNPs führt zu quantitativen Änderungen der Gentranskription oder Spleißprozessen, welche wiederum zu pathogenen Verläufen von neuropsychiatrischen Erkrankungen beitragen. Die aus diesen Studien hervorgehende Datenbank von autosomalen meQTLs, imeQTLs und eQTLs in Hirngewebe stellt eine wertvolle Quelle dar, um rSNPs zu identifizieren und deren Beteiligung an Erkrankungsprozessen aufzuklären.
III
A BSTRACT
Neuropsychiatric disorders have a strong genetic predisposition, but their genetic basis remains elusive. Genome-wide association studies (GWASs) have mapped more than 2,000 susceptibility loci that were shown to increase the risk of common brain disorders. However, the majority of these susceptibility loci reside in non-coding regions and their functional consequences are unknown. The present study addresses the question whether regulatory sequence variants, affecting DNA methylation and gene expression, may be causal susceptibility alleles.
I used an integrative functional genomics approach to investigate epigenetic regulation phenomena in human hippocampal brain of 115 European patients with pharmacoresistant mesial temporal lobe epilepsy. High-density SNP genotypes were correlated with genome-wide quantitative CpG methylation and mRNA expression levels using the Human Methylation450 array (HM450) and the Human HT-12 v3 array. Subsequently, a genome-wide map of methylation quantitative trait loci (meQTLs) and expression quantitative trait loci (eQTLs) was used to dissect regulatory SNPs (rSNPs) that confer susceptibility to common brain disorders at 488 known GWAS hits (P < 5.0 x 10⁻⁸).
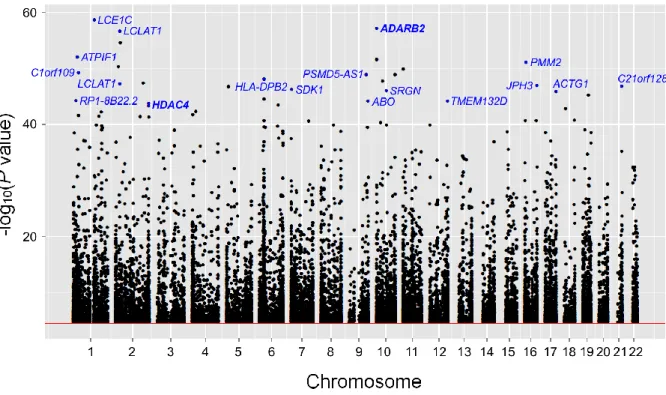
This is the first meQTL study of brain tissue applying the high-density HM450 array in specimens of fresh frozen human brain tissue obtained by epilepsy surgery at large scale. Linear regression analysis of this study implementing a correction for cell-type heterogeneity, identified 19,954 (8.5% of 362k CpGs) cis-acting meQTLs at a false-discovery rate (FDR) of 5%, which is a six-fold increase compared to previous meQTL studies that all investigated postmortem brain tissue. Specifically, cis-meQTLs were strongly enriched upstream of the gene promoter region (TSS201-1500; P = 7.7 x 10-61), highlighting the functional impact of this 5´-regulatory region that harbors binding sites of enhancers and insulators. Some of the most significant cis-meQTLs affected high-ranking candidate genes (ADARB2, HDAC4, NAPRT1, MAD1L1, PTPRN2 and RIMBP2) for neurodevelopmental disorders. To explore tissue specifity, the same approach was repeated in an additional meQTL analysis of whole blood cells originating from 496 German population controls without neuropsychiatric disorders.
Results show that 65% of the meQTLs in brain tissues were also present in whole blood cells (Spearman’s Rank coefficient = 0.42). The present database of cis-meQTLs in brain and blood cells provides a key to select accessible epigenetic biomarkers for brain disorders in whole blood cells. The performed eQTL study identified 734 out of 31k mRNA probes at which expression levels were significantly influenced by cis-acting SNPs (FDR < 5%).
Apart from meQTL and eQTL analyses, additionally a CpG methylation to gene expression correlation analysis was performed. This represents the first systematic delineation of methylation-driven genes in fresh frozen brain tissue. Both inverse correlations (73%) and positive correlations (27%) were
IV
observed, whereby the strongest inverse correlations were detected at NAPRT1, the gene encoding Nicotinate Phosphoribosyltransferase. Furthermore, the NAPRT1-associated meQTLs and eQTL were both genetically regulated by SNP rs9657360. The minor C allele of that very SNP was significantly associated with high methylation levels in the NAPRT1 promoter region and simultaneously associated with low gene expression of NAPRT1. Both, the tumor-specific hypermethylation of a promoter CpG island as well as loss of NAPRT1 expression have been previously proposed as predictive biomarkers for the therapy of carcinomas using NAMPT inhibitors. The additionally genetic risk constellation which has been identified by my approach – combining meQTLs and eQTLs to unravel the translational impact of epigenetic regulation of gene expression – is of high clinical relevance. It enables a diagnostically driven clinical strategy in tumorigenesis including the selection of patients which likely benefit from the administration of NAMPT inhibitors.
To dissect imprinted meQTLs (imeQTLs) exhibiting differential methylation in a Parent-of-Origin (PofO) dependent manner, the CpG methylation states of blood cells in groups of 269 individuals stratified by parentally inverse heterozygous genotypes of nearby SNPs were compared. The imeQTL analysis revealed 177 CpGs at 31 genomic loci of which 22 were previously unknown. The strongest PofO effects were observed at loci harboring neurodevelopmental genes and on chromosome 3p21.1, which is a GWAS candidate region for mood disorders. Genes at genomic loci that show imprinting effects are promising candidate genes because of their potentially monoallelic gene expression which may unmask recessive susceptibility alleles.
Enrichment analyses of genes associated with cis-meQTLs revealed an overrepresentation of genes implicated in GWAS hits of brain disorders (P = 5.8 x 10⁻⁴). Potential rSNPs at the GWAS candidate loci 1q31.2 (RGS1 gene locus) and 3p21.1 (PRBM1 gene locus) were identified. The allelic alteration of transcription factor binding sites by potential rSNPs is likely to result in changes of gene transcription or splicing processes which could contribute to pathogenic pathways underlying neuropsychiatric disorders. As exemplified in this thesis, the created database of autosomal meQTLs, imeQTLs and eQTLs in brain tissue provides a valuable resource to dissect rSNPs at GWAS hits and to decipher their functional effects.
V
T ABLE OF C ONTENTS
1. Introduction ... 1
1.1 Neuropsychiatric disorders ... 1
1.2 Genetic strategies for the dissection of the genetic architecture of neuropsychiatric disorders ... 2
1.3 Genome- and epigenome-wide projects ... 3
1.4 DNA methylation ... 4
1.5 Quantitative trait loci (QTLs) ... 5
1.5.1 Methylation quantitative trait loci (meQTLs) ... 6
1.5.2 Expression quantitative trait loci (eQTLs) ... 7
1.5.3 Imprinted methylation quantitative trait loci (imeQTLs) ... 7
1.6 Perspectives ... 8
1.7 Objectives ... 9
2. Materials and methods ... 10
2.1. Study participants and surgical specimens ... 10
2.1.1 Fresh frozen hippocampal brain tissue ... 10
2.1.2 Whole blood cells from German population controls ... 11
2.1.3 Whole blood cells from parent-offspring trios with GGE ... 11
2.2 Genome-wide high-density SNP genotyping ... 12
2.2.1 SNP imputing ... 12
2.3 DNA methylation analysis ... 13
2.3.1 Bisulfite treatment of genomic DNA ... 13
2.3.2 Array-based genome-wide assessment of CpG methylation ... 13
2.3.3 Assessment of signal intensities ... 14
2.3.4 Normalization of signal intensities ... 14
2.3.5 Quality control filters of CpG methylation profiles ... 16
2.4 mRNA expression analysis ... 16
2.5 Statistical quantitative trait loci (QTL) analyses ... 17
2.5.1 meQTL and eQTL analyses in hippocampal brain tissue ... 18
2.5.2 Methylation-driven gene expression in hippocampal brain tissue ... 20
2.5.3 meQTL analysis in blood cells ... 20
2.5.4 Imprinting methylation QTL (imeQTL) analysis in blood cells ... 21
VI
2.6 Exploration of the genomic features of QTL analyses ... 24
2.6.1 Genomic distribution of cis-meQTLs ... 24
2.6.2 Enrichment analysis of cis-meQTLs and cis-eQTLs ... 24
2.7 Exploration of the role of QTL-associated rSNPs in common neuropsychiatric disorders ... 24
3. Results ... 26
3.1 Methylation QTL analyses ... 26
3.1.1 Cis-meQTL analysis in hippocampal brain tissue ... 26
3.1.2 Comparative cis-meQTL analysis of brain cells and whole blood cells ... 32
3.1.3 Trans-meQTL analysis in hippocampal brain tissue... 37
3.1.4 Imprinting methylation QTL analysis in blood ... 38
3.2 Expression QTL analyses ... 45
3.2.1 Cis-eQTL analysis in hippocampal brain tissue ... 45
3.2.2 Trans-eQTL analysis in hippocampal brain tissue ... 48
3.3 Delineation of methylation-driven gene expression in hippocampal brain tissue ... 49
3.3.1 Correlation analysis of CpG methylation with gene expression ... 49
3.4 Exploration of the role of QTL-associated rSNPs in common neuropsychiatric disorders ... 54
3.4.1 Co-occurrence of cis-acting meQTLs and GWAS hits ... 54
3.4.2 Co-occurrence of cis-acting eQTLs and GWAS hits ... 56
4. Discussion ... 57
4.1 Autosomal map of cis-meQTLs in human hippocampal brain tissue ... 58
4.1.1 Gene-centric distribution of cis-meQTLs ... 59
4.1.2 Enrichment analysis of cis-meQTLs ... 60
4.1.3 Tissue-specifity of cis-meQTLs in hippocampal brain cells ... 60
4.2 Autosomal map of trans-meQTLs in human hippocampal brain tissue ... 61
4.3 Genome-wide assessment of imprinting meQTLs in GGE parent-offspring trios ... 61
4.4 Autosomal map of cis-eQTLs in human hippocampal brain tissue ... 63
4.5 Autosomal map of trans-eQTLs in human hippocampal brain tissue ... 64
4.6 Delineation of methylation-driven gene expression in hippocampal brain tissue ... 64
4.6.1 Functional implications of meQTL and eQTL effects on NAPRT1 expression ... 65
4.7 Dissection of rSNPs involved in common neuropsychiatric disorders ... 66
4.8 Outlook ... 69
VII
5. References ... 72
6. Appendix ... 87
6.1 Clinical parameters of 115 mTLE patients ... 87
6.2 Confirmation analyses of cis-meQTLs and cis-eQTLs in hippocampal brain tissue and whole blood cells ... 87
6.3 Master regulatory loci of trans-meQTL SNPs ... 91
6.4 QQ-plots of QTL analyses ... 93
6.4.1 QQ-plots of meQTL analysis ... 93
6.4.2 QQ-plots of imeQTL analysis ... 93
6.4.3 QQ-plot of eQTL analysis ... 94
7. Danksagung ... 95
8. Erklärung ... 97
9. Curiculum vitae ... 98
VIII
L IST OF F IGURES
Figure 2-1: Normalization and transformation effects. ... 15
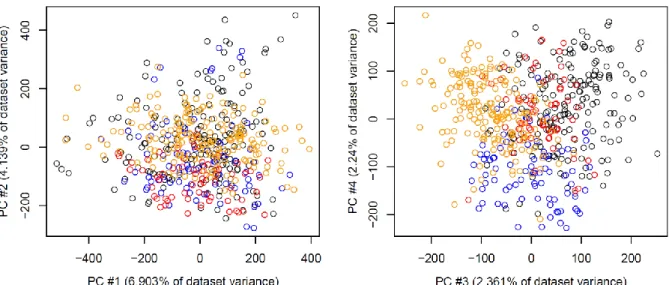
Figure 2-2: Scree plots. ... 19
Figure 2-3: PC variance for four levels of month of methylotyping. ... 21
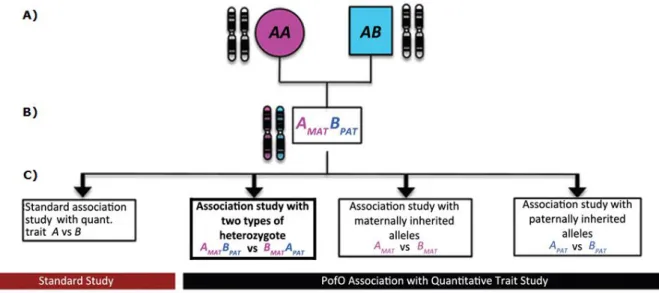
Figure 2-4: Determination of parental origin and PofO specific association testing for a hypothetical SNP. ... 22
Figure 3-1: Manhattan plot for cis-meQTLs identified in hippocampal brain tissue samples. ... 27
Figure 3-2: Functional localization of genomic regions of meQTLs in hippocampal brain tissue. ... 28
Figure 3-3: P-value scatter plot of hippocampal brain tissue and blood cells. ... 33
Figure 3-4: Functional localization of CpGs in GM12878. ... 36
Figure 3-5: Circos plot of 115 hippocampal brain tissue for trans-meQTLs. ... 37
Figure 3-6: Manhattan plot for cis-imeQTLs of 269 trio offspring. ... 39
Figure 3-7: Quantification of the allele-specific imeQTL effect. ... 42
Figure 3-8: Manhattan plot for cis-eQTLs identified in 115 hippocampal brain tissue samples. ... 45
Figure 3-9: DNA methylation and gene expression of NAPRT1 plotted by genotypes of rs9657360. ... 53
Figure 3-10: NAPRT1 region. ... 54
Figure 4-1: Chromosome 1q31.2 region. ... 67
Figure 6-1: QQ-plot of CpG methylation in 115 hippocampal brain tissue samples and 496 blood cell samples. 93 Figure 6-2: QQ-plot of CpG methylation in 269 parent-offspring trios (heterozygote test). ... 93
Figure 6-3: QQ-plot of CpG methylation in 269 parent-offspring trios (maternal and paternal imeQTL analysis). ... 94
Figure 6-4: QQ-plot of mRNA expression in 115 hippocampal brain tissue samples. ... 94
IX
L IST OF T ABLES
Table 2-1: Survey of the data sets integrated for QTL analyses. ... 17
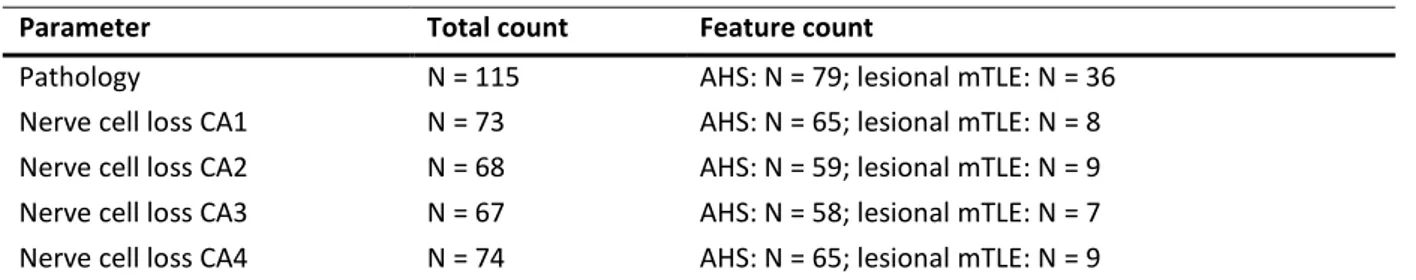
Table 2-2: Parameters and counts of clinical parameters for hippocampal brain tissue. ... 18
Table 2-3: Spearman rank correlation rhos and nominal P-values of pairs of parameters. ... 19
Table 2-4: Known imprinted clusters and associated allelically methylated regions. ... 23
Table 3-1: Distribution of meQTLs within different gene-centric regions in hippocampal brain tissue. ... 28
Table 3-2: Gene-set enrichment analyses of cis-meQTLs in hippocampal brain tissue. ... 29
Table 3-3: Overlaps with comparable human meQTL studies. ... 30
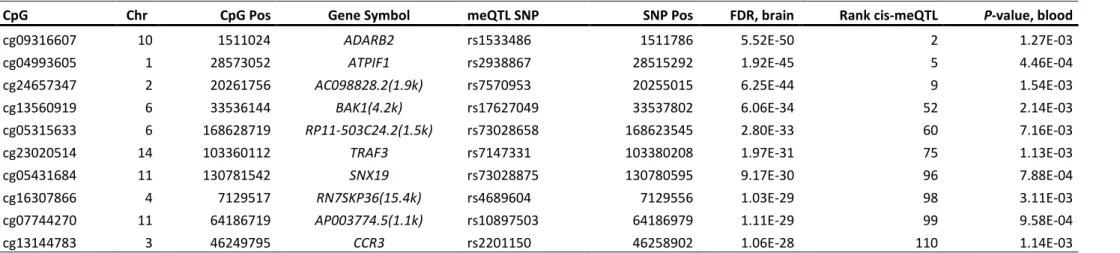
Table 3-4: Top hits of meQTLs in hippocampal brain tissue. ... 31
Table 3-5: Significant cis-meQTLs of high-ranking candidate genes in hippocampal brain tissue. ... 32
Table 3-6: Frequency of cis-meQTLs for different significance thresholds for hippocampal brain tissue and blood cells... 33
Table 3-7: Brain tissue-specific cis-meQTLs not found in blood cells. ... 34
Table 3-8: Genomic distribution of cis-meQTL associated CpGs in hippocampal brain tissue and blood cells. .... 35
Table 3-9: Top 10 imeQTLs and specification of their preferential parental expression. ... 40
Table 3-10: Eight imeQTLs with specification according to their parental expression loci consistent with Crowley et al. (2015). ... 44
Table 3-11: Cis-eQTL overlaps with comparable human eQTL studies. ... 46
Table 3-12: Top hits of cis-eQTLs in hippocampal brain tissue. ... 47
Table 3-13: Master regulatory sites – trans-eQTL SNPs with simultaneous impact on the expression of two genes. ... 48
Table 3-14: Genomic distribution of CpGs influencing gene expression in gene features in hippocampal brain tissue. ... 50
Table 3-15: Top hits of CpG methylation-driven gene expression in hippocampal brain tissue. ... 52
Table 3-16: GWAS lead SNPs in strong LD with cis-acting meQTLs in hippocampal brain tissue. ... 55
Table 6-1: Distribution of clinical parameters within sample group. ... 87
Table 6-2: Reference meQTL and eQTL studies exploited for confirmation analyses. ... 89
Table 6-3: Master regulatory sites – trans-meQTL SNPs with simultaneous impact on the methylation of at least four genes. ... 91
1
1. I NTRODUCTION
1.1 Neuropsychiatric disorders
Neuropsychiatric disorders such as epilepsy, schizophrenia, bipolar disorder, major depressive disorder, autism spectrum disorder, attention deficit-hyperactivity disorder and substance use disorders represent 13% of the global burden of diseases, surpassing cardiovascular disease and cancer (World Health Organization 2008; Collins et al. 2011). They cause enormous personal and social burdens (Collins et al. 2011; Labrie et al. 2012) and have a lifetime prevalence that ranges from 0.1% for autism spectrum disorder to approximately 1% for schizophrenia and up to 24% for nicotine dependence (Sullivan et al. 2012). Family studies, including twin and adoption studies provide consistent evidence that genetic factors contribute to the risk of neuropsychiatric disorders (Kendler et al. 2005). These family studies assessed heritability estimates ranging from 37% for major depressive disorder to more than 80% for schizophrenia and bipolar disorder (Cardno et al. 1999;
Sullivan et al. 2012) and show empirical evidence of a shared genetic etiology across neuropsychiatric disorders (Cross-Disorder Group of the Psychiatric Genomics Consortium 2013). Overall, almost all neuropsychiatric traits display a complex genetic predisposition (Labrie et al. 2012; Gelernter 2015) and only a small fraction follows mendelian inheritance patterns (Lander & Schork 1994). There is no common genetic architecture for the set of complex psychiatric traits. Generally, the genetic architecture of the vast majority of neuropsychiatric disorders is composed by highly polygenic and heterogeneous factors including multiple risk alleles, epistatic and epigenetic effects. Risk alleles can individually be common or rare, and can include, for example, single nucleotide polymorphisms (SNPs) and copy number variants (CNVs, Gelernter 2015).
Common neuropsychiatric disorders are among the most complex and poorly understood conditions affecting the human body. In recent years there have been major research efforts to improve our understanding of their complex genetic predisposition. Initial studies included genetic linkage studies, candidate gene association studies and targeted sequencing studies, which follow a hypothesis-driven approach. Although these “traditional” approaches have identified a few susceptibility genes, these studies did not succeed to identify common major susceptibility loci. The scenario started to change with the advent of genome-wide association studies (GWASs) which allowed a more systematic, hypothesis-free exploration of the genetic basis of neuropsychiatric disorders. The hypothesis-free approach of a GWAS offered the opportunity to overcome difficulties and obstacles enforced upon the incomplete understanding of the pathophysiology of the disease (Kitsios & Zintzaras 2009).
2
1.2 Genetic strategies for the dissection of the genetic architecture of neuropsychiatric disorders
A GWAS is usually designed as a case-control association study, in which allelic variation of SNPs is compared between individuals with a particular disease and unaffected individuals. The strategy of the GWAS approach is mainly directed on the discovery of common variants conferring low/moderate risks following the “common disease/common variant” hypothesis (Reich & Lander 2001). This hypothesis predicts that the genetic risk for common diseases will often be due to disease-predisposing alleles with relatively high frequencies. In the last few years, a huge number of GWASs have been performed to dissect the genetic basis of many different complex diseases and traits. GWASs investigating the genetic architecture of neuropsychiatric disorders have identified many susceptibility variants (Psychiatric GWAS Consortium Bipolar Disorder Working Group 2011;
Sullivan et al. 2012). The National Human Genome Research Institute (NHGRI) catalog of published GWAS hits harbors more than 15,000 SNPs associated with human diseases, of which more than 2,000 SNPs are associated with neuropsychiatric disorders (Welter et al. 2014). However, the identified genetic variants characteristically explain only a modest proportion of the total heritability of these traits. This has led to the common question, how the “missing heritability” of complex diseases can be explained (Eichler et al. 2010). One plausible explanation is that most of GWASs have SNPs with minor allele frequencies of more than 5% implying that many rare variants has not been ascertained by current GWASs. According to the alternative “common disease/rare variant”
hypothesis, complex traits are caused collectively by multiple rare DNA sequence variants, each with moderate to high penetrance (Marian 2012). To test this hypothesis, gene sequencing studies have been carried out by next-generation sequencing (NGS) methods: either as target candidate gene studies and whole exome or genome studies (Bamshad et al. 2011). Although NGS has identified many deleterious gene mutations, the current findings do not close the gap of the missing heritability (Petronis 2010; Liu & Leal 2012). One problem arises by the difficulty to interpret the biological effect of variants identified by GWASs (Westra & Franke 2014). Typically, a candidate region identified by a GWAS contains more than one gene and multiple sequence variants form a linkage disequilibrium (LD) block (Albert & Kruglyak 2015). Although variants that alter coding sequences are obvious candidates, the majority of loci identified in GWASs is found in non-coding regions and probably affects regulatory elements (Maurano et al. 2012). It is difficult to unequivocally identify the causal variant for each locus by using the traditional fine-mapping methods. Several lines of evidence suggest that many sequence variants in non-coding regions influence regulatory processes controlling mRNA transcription.
3
1.3 Genome- and epigenome-wide projects
I presume that the understanding of the molecular mechanisms underlying common diseases will be improved by an integrated functional genomics strategy. By 2004, large-scale genome projects already indicate that genome sequences alone cannot explain the whole diversity of life, because they are very similar within and across species (cf. Ptashne et al. 2010). Instead, epigenetics may explain how these similar genetic codes are differentially expressed in different cell-types within different environmental conditions and at different times (Ptashne et al. 2010). Epigenetics refers to heritable changes in gene expression caused by alterations in DNA methylation and chromatin structure (Henikoff & Matzke 1997). Epigenetic factors have been linked to developmental processes and play a critical role in normal cellular differentiation during embryogenesis (Li 2002). They have been implicated to play an important role in several human diseases, including cancer and neuropsychiatric disorders (Dalton et al. 2014). Epigenomics is the science of functional elements regulating gene expression in cells. The epigenome consists of the complete collection of epigenetic marks, such as DNA methylation, histone modifications and non-coding RNAs that exist in a cell at any given point (Romanoski et al. 2015).
Ongoing projects such as ENCODE (Encyclopedia of DNA Elements), the International Human Epigenome Consortium (Bae 2013) and the US National Institutes of Health Epigenomics Roadmap are generating cell-specific reference data sets that provide a basis for delineating the complex interplay between epigenomic processes and the transcriptome. The ENCODE project aimed to catalog the regulatory elements in human cells and to study the epigenomic signatures of cells which are grown in culture (ENCODE Project Consortium 2004, 2007, 2012). Additional approaches and projects further benefit from the ENCODE project (Civelek & Lusis 2014): Systematic maps of transcription factor binding sites and chromatin modifications have been generated as have databases and web-tools such as GWAS3D (Li et al. 2013), which help to automate some of the processes involved. In addition, the Roadmap Epigenomics Project extends the ENCODE project and aims to elucidate how epigenetic processes contribute to human biology and disease (Kundaje et al.
2015). The researchers have linked epigenomic signatures to the corresponding genetic information, producing reference epigenomes for several human tissues and cell-types. The result is a comprehensive landscape of epigenomic elements regulating gene expression in the human body (Romanoski et al. 2015). Kundaje and co-workers (2015) enable insights into the epigenomic landscape, its dynamics across cell-types or tissues and development. Their epigenomic data sets, regulatory annotation and integrative analyses have resulted in the most comprehensive map of the human epigenomic landscapes so far and cover the largest collection of primary cells and tissues (Kundaje et al. 2015). Some of the most widely studied mechanisms of epigenetic regulation include
4
DNA methylation, histone modifications as well as non-coding RNAs. DNA methylation is the most stable of all epigenetic modifications and the most studied epigenetic modification to date (Beck &
Rakyan 2008; Dalton et al. 2014).
1.4 DNA methylation
DNA methylation is the only epigenetic mark for which a detailed mechanism of mitotic inheritance has been described (Bird 2002). The most common form of DNA methylation in vertebrates is 5- methylcytosine (5mC), which arises by the addition of a methyl group to cytosine nucleotides (C) and affects 70 to 80% of CpGs in the human genome (Ehrlich et al. 1982). High levels of 5mC in promoter regions that are CpG-rich are strongly associated with transcriptional repression, whereas genomic regions that are CpG-poor exhibit a more complex relationship between DNA methylation and transcriptional activity (Jones 2012). DNA methylation has become an important tool in the emerging systems approach to explore and better understand genome function in health and disease. DNA methylation has been extensively studied for its role in several biological processes such as for example genomic imprinting (Barlow 2011) and characteristic changes in DNA methylation have been reported for cancer (Baylin & Jones 2011; Shames et al. 2013) and several other diseases (Feinberg 2007).
Over the past decade, numerous approaches have been evolved for methylation analysis. Recent advances in NGS and microarray technology allow mapping of DNA methylation at a high genome- wide resolution and in a large number of samples (Laird 2010). These new methods create enormous opportunities for research of the epigenome (Bock 2012). Key advantages of the NGS technology are its comprehensive genomic coverage, high quantitative accuracy and excellent reproducibility (Bock 2012). But the most widely-used approach for epigenome-wide DNA methylation analysis is the Illumina Infinium Human Methylation450 BeadChip microarray (HM450). The HM450 microarray offers a powerful tool to assess DNA methylation across the genome. The genomic coverage of the Infinium assay is more limited than that of most bisulfite-sequencing based methods, but the compatibility with existing genotyping pipelines, the lower per-sample cost compared with whole- genome bisulfite sequencing and the simpler analysis and interpretation of methylation data makes it an attractive approach for large-scale sample collections (Bock 2012; Morris & Beck 2015).
Verification and validation are usually done using locus-specific DNA methylation assays at a small number of CpGs in many samples to reduce the cost of studying large validation cohorts. For this purpose the most popular method is pyrosequencing (Tost & Gut 2007; Potapova et al. 2011).
5
1.5 Quantitative trait loci (QTLs)
In 2001, Jansen and Nap introduced the concept for a strategy, coined ‘genetical genomics’ to identify which genes are regulated by genetic variation (Jansen & Nap 2001). By correlating genetic variants with intermediate molecular quantitative traits, such as methylation levels or gene expression levels, it is possible to identify quantitative trait loci (QTLs). To identify the variants that influence DNA methylation or gene expression, two types of data must be collected from each individual. First, the genotype data of each individual are required. Second, in each individual the DNA methylation is measured using an array platform considering genome-wide patterns or the expression of each gene in the genome is measured using either expression microarrays or RNA sequencing. The QTLs are then identified by comparing the genotypes with the methylation or expression levels using a statistical association test. During that course, individuals are grouped according to the allele they carry. A significantly higher methylation or expression level for a gene in one group than in the other group suggests that the variant (or another variant in LD) influences the methylation or expression of this gene. The test is repeated at every DNA variant in the genome which results in a genome scan for methylation quantitative trait loci (meQTLs) or expression quantitative trait loci (eQTLs) for this gene (Albert & Kruglyak 2015).
QTLs can be divided into those that have local effects (cis-QTLs), meaning that the genetic variant is located near the genomic probe and those with distant effects (trans-QTLs), meaning that the genetic variant is located further away from the genomic probe (e.g. >10 Mbps apart or on a different chromosome; Januar et al. 2015). Recent studies have examined the association between genetic variants and the quantitative traits in both cis and trans, of which cis-acting QTLs predominate (Gibbs et al. 2010; Zhang et al. 2010; Bell et al. 2011; Numata et al. 2012; Westra et al. 2013; Ramasamy et al. 2014; Schramm et al. 2014). Distant QTLs have smaller effects sizes and seem also to be more tissue-specific than local QTLs which are often conserved among various tissues (Petretto et al. 2006;
van Nas et al. 2010; Fairfax et al. 2012), which further complicates the detection of those trans-acting QTLs. Overall, previous reported studies show that the genetic regulation of gene expression is complex and differs widely across cell-types and tissues, especially for genetic variants that are disease-associated.
The choice of tissue type is a major challenge that distinguishes genetic and epigenetic studies. The tissue type is largely irrelevant for genetic studies of germline genetic variation in contrast to epigenetic studies where often the primary disease- or exposure-relevant target tissue (or cell-type) is available on a limited scale, e.g. brain tissue (Mill & Heijmans 2013). So far, several QTL studies have investigated human brain tissue in neuropsychiatric disorders (Gibbs et al. 2010; Zhang et al.
2010; Numata et al. 2012; Gamazon et al. 2013; Kim et al. 2014; Numata et al. 2014; Ramasamy et al.
6
2014; Smith et al. 2014), but all of them performed QTL analyses in postmortem brain tissue.
Postmortem studies of brain tissue have several limitations: postmortem brain tissue samples have restrictions with respect to mRNA conservation (Bray et al. 2003; Webster et al. 2009) and methods of tissue preservation alter the quality of biomolecules obtained (Januar et al. 2015). A delay of the autopsy of postmortem brain tissue alters DNA methylation profiles from baseline (Miller-Delaney et al. 2015). Additionally, postmortem studies of brain tissue are critical for understanding the disease aetiology (Januar et al. 2015). On the one hand these aspects indicate the need for fresh frozen human brain tissue obtained from living patients. On the other hand it is necessary to explore the extent to which easily accessible cells obtained from tissues such as whole blood can be used to address questions about epigenomic variation in inaccessible tissues such as the brain.
Known and unknown confounders can contribute significantly to the dataset variance in quantitative epigenomic high throughput analyses, so the integration of major confounding factors are required to perform a successful analysis of QTL data (Januar et al. 2015). Potential confounders include age, gender and ethnic diversity. Further, medical histories of participants, such as antiepileptic treatments, antipsychotic or antidepressant medications are useful and necessary. Studies that use postmortem brain tissue also have to consider confounders such as antemortem history, medication use and cause of death or postmortem delay. Another important issue when performing QTL studies is cellular heterogeneity. To overcome this issue, methods of adjusting for DNA methylation variability associated with cell composition differences have been developed for brain as well as for blood cells and can be incorporated in statistical models for adjustment (Houseman et al. 2012;
Guintivano et al. 2013; Jaffe & Irizarry 2014). Cellular heterogeneity provides an important issue but only a few current studies start to consider this confounding factor.
1.5.1 Methylation quantitative trait loci (meQTLs)
The association between genetic variants and the disorder could be mediated via its ability to influence DNA methylation (meQTLs). Because sequence variation can directly influence DNA methylation in cis (Schalkwyk et al. 2010) and evidence already provides an enrichment of meQTLs at loci for several disorders identified by GWAS (Numata et al. 2012; Gamazon et al. 2013; Smith et al.
2014), it is likely that interpretation of genetic data can be largely improved by integrating allele- specific epigenetic information into the analyses (Meaburn et al. 2010).
Early meQTL studies focused on methylation data from relatively few CpGs showing a strong bias towards promoter regions. The comprehensive array platform considering genome-wide patterns enable recent studies to cover much more meQTLs. The present study uses the popular platform of the HM450 array that is the best known platform capable of high-throughput work. However,
7
technical artifacts need to be taken into account, especially where Infinium probes overlap with positions of known DNA variants (Barrow & Byun 2014). When using microarray platforms and studying meQTLs regarding SNPs whose genotype correlates with DNA methylation, potential SNP artifacts represent a substantial challenge (Barrow & Byun 2014). Removing of all SNP-associated probes from the analysis process would not be appropriate as 56% of the probes on the Infinium array contain SNPs. Definite factors such as the distance of an SNP within the probe and the minor allele frequency within the ethnicity of the study population should be considered. It is important to give careful consideration to what parameters should be set and potential confounding factors should be subsequently excluded without minimizing the HM450 probe set excessively. Up to date only few meQTLs have been reported to change gene expression (Gibbs et al. 2010; Gamazon et al.
2013; Gutierrez-Arcelus et al. 2013). The present study addresses this promising issue.
1.5.2 Expression quantitative trait loci (eQTLs)
Expression quantitative trait loci (eQTLs) are regions of the genome which contain DNA sequence variants that influence the expression level of one or more genes (Albert & Kruglyak 2015). The genetics of expression variation of single genes has been studied for a long time, at least since 1962 (Schwartz 1962). Maps of eQTLs are being built in large-scale studies in humans for different cell- types or tissues, such as blood cells and brain tissue (Gibbs et al. 2010; Westra et al. 2013; Kim et al.
2014; Ramasamy et al. 2014; Schramm et al. 2014).
Beyond the hitherto description of large eQTL catalogs, the understanding of the role of regulator variation is currently being expanded in two directions. Typically, eQTLs were identified as ‘loci’, statistical associations between regions of the genome and the expression of genes. Recently, eQTLs are being used to identify the causal variants and their molecular mechanism of action. One immediate application of eQTLs lies in the interpretation of GWAS risk loci. Large eQTL studies can help to prioritize potential causal variants among multiple polymorphisms within the GWAS candidate regions (Albert & Kruglyak 2015).
1.5.3 Imprinted methylation quantitative trait loci (imeQTLs)
Imprinting meQTL (imeQTL) analyses imply the association of SNP genotypes of defined parental origin with methylation levels. Genes that show a parental bias in methylation will undergo differential regulatory effects from the paternal and maternal alleles. As standard association studies treat both alleles equally, they are unable to detect effects such as imprinting in which the two alleles are differentially regulated.
Genomic imprinting is a form of epigenetic variation whereby Parent-of-Origin (PofO) specific epigenetic modifications are inherited by offspring, resulting in mono-allelic gene expression.
8
Aberrations in normal imprinting patterns have been linked to congenital disorders such as Prader- Willi / Angelman syndromes (Nicholls et al. 1989; Clayton‐Smith 1993), and Beckwith-Wiedemann syndrome (Reik et al. 1995). This finding is consistent with the fact that many imprinted genes have prominent roles in growth and development (Georgiades et al. 2001; Lambertini et al. 2012). Recent GWASs have taken into account potential PofO effects and have uncovered important contributions of imprinting to common complex diseases (Kong et al. 2009). In addition to genetic studies, epidemiological data in many common diseases, including multiple sclerosis (Chao et al. 2010), asthma (Carroll et al. 2005), and bipolar disorder (McMahon et al. 1995; Kornberg et al. 2000) further imply that PofO and imprinting-mediated effects on disease may be pervasive. But despite evidence for the significant impact of imprinting in genome function and disease, catalogs of imprinted genes in the human genome are almost certainly incomplete. At present, there are >120 known imprinted genes in mice; yet in humans, only approximately 85 have been confirmed (www.geneimprint.com;
Wei et al. 2014), 10% of which have been identified since 2012 (Barbaux et al. 2012). The imprinting meQTLs of the present study may help to identify additional imprinted genes which display both allele specific CpG methylation and genomic imprinting. The imeQTL study of this work will help to identify PofO dependent susceptibility effects that may improve the analytical power of GWASs to dissect the complex genetic architecture of common brain disorders and may explain a substantial fraction of the missing genetic heritability.
1.6 Perspectives
The field of epigenetics is expanding at an exponential rate and projects like the Roadmap Epigenomics Consortium (Romanoski et al. 2015) makes huge efforts to fill the gap of epigenomic studies and its association with human disease. Systems genetics studies are aiming to identify the role of regulatory variation in complex traits by integrating intermediate phenotypes, such as CpG methylation, transcript, protein or metabolite levels (Civelek & Lusis 2014; Albert & Kruglyak 2015).
Recent reviews present a survey about the current knowledge of the molecular architecture of complex traits and are useful for the identification of genes and pathways that underlie common human diseases. However, our understanding of the exact mechanisms by which epigenetic changes modify a phenotype, particularly in association with common neuropsychiatric disorders in humans, is still limited. Current research in this area is limited by a number of factors including difficulties in establishing functional causality, tissue heterogeneity and other confounding factors such as spatial and temporal effects (Januar et al. 2015). The understanding of the role of the methylome in regulating human health and disease is yet at the beginning. This is particularly true in the field of
9
neuropsychiatric disorders for which access to pathogenic brain tissue is usually not available in living patients.
1.7 Objectives
The present study aims to get a deeper insight into the role of regulatory variation in complex traits, especially in neuropsychiatric disorders, with a particular interest in mapping the effects of common genetic variants on gene expression and DNA methylation. An integrative functional model of genomics and epigenomics will be optimal for understanding the etiological pathways to common disorders with complex genetic predisposition, such as neuropsychiatric disorders. An integrative functional approach will further help to trace molecular changes through layers of biological information to the disease outcome.
Functional genomics studies of common brain disorders are difficult because human brain tissue is usually not available. Temporal lobe epilepsy (TLE) offers a unique opportunity to obtain bioptic brain specimens when epilepsy surgery is necessary to control pharmacoresistant seizures (Grote et al.
2015). I used this intriguing resource to perform the first meQTL and eQTL study of bioptic human brain tissues of pharmacoresistant mesial TLE (mTLE) patients. Additionally, the approach of the present study allows a systematically examination of the influence of cis-meQTLs on gene expression to delineate methylation-driven genes in fresh frozen brain tissue.
Currently, there are no QTL studies, which consider cellular heterogeneity among different brain regions and focus on neuropsychiatric disorders. Thus, the present study considers two major aspects of epigenetic studies including tissue relevance, as I can use tissue in which the given disease emerges, and cellular heterogeneity.
An intra-individual cross-tissue study concluded that between-tissue variation in DNA methylation greatly exceeds inter-individual differences for any one tissue but suggested that some inter- individual variation in DNA methylation may be correlated between brain regions and blood (Davies et al. 2012). To explore tissue-specifity of the cis-meQTLs detected in hippocampal brain tissue, meQTL analyses in whole blood cells of 496 German population controls without neuropsychiatric disorders were performed, using the same array platform and analytical procedures. This may offer the opportunity to dissect accessible biomarkers in blood DNA sources for common brain disorders.
One major achievement of this study will be a public release (publication in preparation) of a database reporting the complete meQTL and eQTL findings of this thesis. These genome-wide maps of meQTLs and eQTLs will improve the prospects to elucidate the genetic mechanisms determining DNA methylation and gene expression in common brain disorders.
10
2. M ATERIALS AND METHODS
Genome-wide methylation quantitative trait loci (meQTL) and expression quantitative trait loci (eQTL) analyses were performed in fresh frozen hippocampal brain tissue of European patients with pharmacoresistant mesial temporal lobe epilepsy (mTLE). Individual high-density SNP genotypes were correlated with individual quantitative methylation states and individual expression levels. To delineate accessible epigenetic biomarkers, genome-wide maps of meQTLs were also generated in whole blood cells from German population controls using the same methylation microarray. In addition, blood cell DNA samples of parent-offspring trios with Genetic Generalized Epilepsy (GGE) were investigated to screen for differentially methylated parental genomic regions (imprinting meQTLs, imeQTLs).
2.1. Study participants and surgical specimens
2.1.1 Fresh frozen hippocampal brain tissue
The present study included 117 pharmacoresistant mTLE patients of European descent who underwent surgical treatment in the Epilepsy Surgery Program at the University of Bonn Medical Center (Wiebe et al. 2001). In all patients, presurgical evaluation using a combination of noninvasive and invasive procedures revealed that seizures originated in the mesial temporal lobe (Kral et al.
2002). Surgical resection of the hippocampus was clinically indicated in every case (Pernhorst et al.
2011). Informed written approval was obtained from all patients and procedures were in accordance with the Declaration of Helsinki and approved by the local ethics committee.
All fresh frozen hippocampus tissue samples were from identical regions of the hippocampus. Fresh frozen sections were analyzed according to international standards and the diagnostic classification was established by an experienced neuropathologist according to international criteria (Becker et al.
2003; Blumcke et al. 2007). The majority (> 60%) of the hippocampi specimens displayed Ammon’s horn sclerosis (AHS; segmental neuronal cell loss and concomitant astrogliosis and microglia activation). A smaller proportion of the specimens showed predominantly lesional alterations such as cortical dysplasia or tumors. Up to five 20 µm thick tissue sections were used for the preparation of genomic DNA and mRNA. DNA was isolated from tissue specimens using the DNeasy Blood and Tissue Kit (Qiagen, Hilden, Germany), according to the manufacturer’s protocol (Schonberger et al.
2009). mRNA was isolated from tissue specimens using the Dynabeads mRNA Direct Micro Kit (Dynal, Oslo, Norway) following the manufacturer’s protocol (Fassunke et al. 2008). Complementary DNA
11
(cDNA) was synthesized by reverse transcription of total mRNA using the RevertAid First-Strand cDNA Synthase Kit (Fermentas, St. Leon-Rot, Germany) according to the manufacturer’s protocol.
All 117 mTLE patients fulfilled the inclusion criteria by having mRNA-expression data, DNA methylation data and genotypes in sufficient quality. Two patients were excluded because of their outstanding disease type (Rasmussen's encephalitis). Conclusively, analyses have been performed on 115 hippocampal brain tissue samples (60 males, 55 females; range of age of seizure onset:
1-47 years, average age: 11.1). The mTLE patient group was clinically characterized with respect to seizure manifestation. The clinical parameters of the mTLE patients are summarized in Appendix, Table 6-1.
2.1.2 Whole blood cells from German population controls
A population-based cohort of 498 unrelated German population controls without neuropsychiatric disorder (273 males, 225 females; age range: 54 – 74 years, average age: 57.4) was collected from the Western regions of Germany (Ruhr area) within the framework of the cardiovascular longitudinal Heinz Nixdorf RECALL study (HNR; Schmermund et al. 2002). Of the 498 population controls two individuals did not fulfill the inclusion criteria having DNA methylation data and genotypes in sufficient quality. Hence, analyses have been performed on 496 population controls.
2.1.3 Whole blood cells from parent-offspring trios with GGE
Epilepsy patients of European ancestry with common GGE syndromes, including genetic absence epilepsies (GAE), juvenile myoclonic epilepsy (JME) and epilepsies with generalized tonic clonic seizures alone (EGTCS) exhibiting generalized spike and wave discharges in their resting electroencephalogram (gsw-EEG), were recruited in a multi-center effort from the European EPICURE Project (http://www.epicureproject.eu). The diagnostic classification of GGE syndromes were prepared according to EPICURE guidelines and standardized phenotyping protocols (http://portal.ccg.uni-koeln.de/ccg/research/epilepsy-genetics/sampling-procedure/; ILAE 1989;
Nordli 2005; Berg et al. 2010). Individuals with a history of major psychiatric disorders (autism spectrum disorder, schizophrenia or affective disorder) or severe intellectual disabilities were excluded (Trucks 2013). In total, 269 parent-offspring trios of European origin with offspring affected by GGE were available for imeQTL analysis (103 male trio children, 166 females; range of age of seizure onset: 2 – 21 years, average age: 9.8). Trios were recruited from different European countries or countries with European ancestry, including Australia (N = 69), Bulgaria (N=2), Denmark (N = 20), Germany (N = 14), Italy (N = 138), and Turkey (N = 26). The offspring trios were affected by the following GGE syndromes: 175 GAE, 92 JME, and 2 EGTCS alone. All study participants gave informed consent according to the regulations at their local institutional review boards.
12
2.2 Genome-wide high-density SNP genotyping
Genome-wide high-density SNP genotyping was carried out by using different SNP genotyping arrays for the different study cohorts. For the mTLE patients SNP genotyping was performed using the Illumina HumanHap550 SNP array (550k SNPs; Illumina, San Diego, CA, USA). For the HNR controls two genotyping arrays, Illumina HumanOmniExpress 12 v1.1 and Illumina HumanOmni1 Quad v1.0 (overlap of 539k SNPs; Illumina, San Diego, CA, USA) were combined. For the GGE offspring trios the Affymetrix Axiom Genome Wide Human genotyping array (567k SNPs; Affymetrix, Santa Clara, CA, USA) was used. To ensure a high accuracy of the SNP genotype calls, several quality filters were applied for the individual array and the single SNP. Exclusion criteria for SNP arrays were: call rate per array < 97%, and autosomal heterozygosity rate > 29%. Exclusion criteria for SNPs were: i) non- autosomal position, ii) missing hg19 annotation, iii) call rate per SNP < 97%, and iv) European minor allele frequency (MAF) < 5% from the 1000 Genomes Project. In addition, the trio pedigree structure and the relationship of all trio members was checked with the PedigreeExplorer (http://pedigreeexplorer.meb.uni-bonn.de/) and by IBD-estimation and was further visualized with GRR (graphical representation of relationship errors; Abecasis et al. 2001). All quality control (QC) procedures were carried out using Plink, version 1.9 (http://pngu.mgh.harvard.edu/purcell/plink/, Purcell et al. 2007).
2.2.1 SNP imputing
SNP imputing is a useful method that can detect causal variants that use the linkage disequilibrium (LD) structure in a genomic segment to infer the alleles of SNPs which are not directly genotyped (Marchini et al. 2007). The pre-phasing based imputation was carried out using a combination of the programs SHAPEIT2 and IMPUTE2 (Howie et al. 2012). Imputation with IMPUTE2 was based on the reference panel: 1000 Genomes Phase I release of NCBI build 37 (hg19). The imputed SNP genotypes were additionally quality filtered using SNPTESTv2 (Marchini et al. 2007). Imputed SNPs were excluded from further analyses according the following criteria: i) SNPtest info quality value < 0.9, ii) MAF < 5%, iii) missing data proportion > 3% using Plink 1.9. Furthermore, a LD-based SNP pruning was performed, considering a window of 50 SNPs, followed by a LD calculation between each pair of SNPs in the window and removal of one SNP of SNP pairs with a LD r2 > 0.8.
13
2.3 DNA methylation analysis
2.3.1 Bisulfite treatment of genomic DNA
All methylation profiling technologies of Illumina are based on genotyping bisulfite-converted DNA.
The EZ DNA Methylation Kit from Zymo Research (Zymo Research, Irvine, CA, USA) was used for bisulfite treatment of genomic DNA samples. The kit is based on the divergent reaction of unmethylated vs. methylated cytosine and sodium bisulfite: unmethylated cytosine is converted into uracil while methylated cytosine is protected and remains cytosine (Zilberman & Henikoff 2007).
Following PCR, the converted uracil nucleotides will be detected as thymine.
A standardized bisulfite conversion protocol was used. Genomic DNA was applied according to the manufacturer’s protocol of the Zymo EZ DNA Methylation kit (#D5001). Alternative incubation conditions are recommended, which differ from the normal manufacturer’s protocol, when the Illumina Infinium methylation assay is used. This step based upon Illumina’s feedback to Zymo Research that bisulfite conversion efficiency can be improved by incorporating a cyclic denaturation protocol during the process of conversion.
2.3.2 Array-based genome-wide assessment of CpG methylation
For mapping CpG methylation level of genomic bisulfite-converted DNA the Infinium Human Methylation450k BeadChip array (HM450; Illumina, San Diego, CA, USA) was used. The HM450 array assesses the methylation levels of 485,577 CpG sites (482,421 CpG sites, 3,091 non-CpG sites and 65 random SNPs) and uses the Infinium methylation assay.
The CpG probes of the HM450 BeadChip are located in 21,231 RefSeq genes and 26,658 UCSC annotated CpG islands (CGI), as well as in genomic regions such as 5’ and 3’ UTRs, gene body and promoter. The 5´-regulatory gene region was divided into two blocks of 200 bps (TSS200) and 1,500 bps (TSS201-TSS1500) upstream of the transcription start site (TSS). The CGI region was further extended by including the 2 kb regions flanking CpG island shores (N = 26,249) as well as the CpG island shelves (2 kb regions upstream and downstream of the CpG island shores; N = 24,018; Bibikova et al. 2011).
The Human Methylation450 BeadChip applies both Infinium I and II assay chemistry technologies to quantitatively assess the methylation state of bisulfite-treated CpG sites. Both Infinium probes are 50 bases long, but detection of the methylation levels occur by different mechanisms. One bead type of the Infinium I assay corresponds to methylated (C), another bead type to unmethylated (T) state of the CpG site. Both bead types for the same CpG locus incorporate the same type of labeled nucleotide, determined by the base preceding the interrogated “C” in the CpG locus, and will be
14
detected in the same color channel. For the Infinium II assay only one bead type corresponds to each CpG locus. Each locus will be detected in two colors (red and green fluorescence signals) by single- base extension (SBE) which reflects the methylation state (Bibikova et al. 2011). The Infinium methylation assay was performed following the standard Infinium protocol.
2.3.3 Assessment of signal intensities
Infinium methylation data was processed with the Methylation Module of the GenomeStudio software (v2011.1) using HumanMethylation450 manifest v1.1. The GenomeStudio Methylation Module calculates methylation level of each CpG locus as methylation beta-value (β-value, see below) using the ratio of intensities between methylated and unmethylated alleles (Bibikova et al.
2011). These β-values were exported and used for further analyses. In addition, the GenomeStudio Methylation Module has an Infinium Methylation Controls Dashboard which provides a couple of quality parameter like staining, hybridization, extension, bisulfite conversion and specificity. This Control Dashboard gives an overview of the technical quality of the array and the array run.
2.3.4 Normalization of signal intensities
The brain and blood methylation arrays were SWAN (subset-quantile within array normalization;
Maksimovic et al. 2012) corrected and quantile normalized using the Bioconductor R-packages preprocessCore and minfi. The SWAN performs an independent normalization of six probe categories.
The categories are defined by the differentiation of type I and II Infinium probes and in combination with the CpG number in the probe-body (one to three). Using the SWAN method technical variability within and between arrays could be reduced. To increase the performance in terms of detection and true positive rate of highly methylated and unmethylated CpG sites (Du et al. 2010) ß-values where transformed to M-values (see below) and subsequently quantile normalized between the arrays (Figure 2-1). The resulting M-values where further checked for general signal deviances in a principle component analysis (PCA). PCA was performed using a correlation dispersion matrix and normalized Eigenvector scaling (prcomb, stats R-package).
15
Figure 2-1: Normalization and transformation effects.
The distribution of signal values without normalization (A, B), using within array SWAN normalization (C), using within array SWAN normalization and between arrays quantile normalization (D) and using M-value transformation (B - D) is plotted.
The β-value is defined as the ratio of the methylated probe intensity and the overall intensity (sum of methylated and unmethylated probe intensities), ranging from 0 to 1. For an ith interrogated CpG site ß-value is defined as:
𝛽
𝑖= max (𝑦
𝑖,𝑚𝑒𝑡ℎ𝑦, 0)
max(𝑦
𝑖,𝑢𝑛𝑚𝑒𝑡ℎ𝑦, 0) + max(𝑦
𝑖,𝑚𝑒𝑡ℎ𝑦, 0) + 𝛼
yi,methy and yi,unmethy are the intensities measured by the ith methylated and unmethylated probes, respectively. Ideally, a value of zero indicates that all copies of a CpG site are completely unmethylated (no methylated molecules are measured) and a value of one indicates that every copy of the site is methylated. In contrast, the M-value is calculated as the log2 ratio of the intensities of methylated probe versus unmethylated probe as shown in the following equation:
𝑀
𝑖= log 2 ( max(𝑦
𝑖,𝑚𝑒𝑡ℎ𝑦, 0) + 𝛼 max(𝑦
𝑖,𝑢𝑛𝑚𝑡ℎ𝑒𝑦, 0) + 𝛼 )
It has a range from positive to negative values. An M-value close to 0 indicates a similar intensity between the methylated and unmethylated probes, which means that the CpG site is about half- methylated. The meaning of positive M-values is that more molecules are methylated than
16
unmethylated, while negative M-values mean the opposite. M-values have been widely used in expression microarray analysis, especially two-color microarray analysis and are more statistically valid for differential methylation analysis of methylation levels of CpG loci. In the present work M- values are particularly used for demonstrating methylation levels.
2.3.5 Quality control filters of CpG methylation profiles
To ensure a high accuracy of the CpG methylation profiles several quality control filters were applied – mainly based on the previous work of Chen and colleagues (2013): i) CpG probe sets were filtered according to hg19 autosomal representation, ii) CpG detection signal had to be sufficient (P-value >
0.01 in > 5% of the samples), and iii) SNPs in the cg 50mer probe with MAF > 1% using the 1000 Genomes Project (release 20110521) were excluded. Additionally, CpGs that overlap known SNPs, so called polymorphic CpGs, were excluded. A CpG site was defined to be polymorphic if a SNP resided at the position of the cytosine or guanine on either strand, and for Infinium I assays, if a SNP resided at the position where SBE occurs (base before C). Furthermore, nonspecific probes (aka as cross- reactive probes, Chen et al. 2013) on the Illumina 450K array, i.e. probes which co-hybridize to alternate sequences which are highly homologous to the intended targets (ca. 6%) were excluded. In total, a set of QC-filtered 362,722 CpG probes remained of the original 485,577 CpG probe set for the regression statistics (see below 2.5).
2.4 mRNA expression analysis
For mapping mRNA expression of the 115 mTLE patients the Illumina HumanHT-12 v3 Expression BeadChip (Illumina, San Diego, CA, USA) was used. Each array on the HumanHT-12 v3 Expression BeadChip targets more than 48,000 probes which were derived from the National Center for Biotechnology Information Reference Sequence (NCBI, RefSeq) (Build 36.2, Release 22) and the UniGene (Build 199).
Raw intensity values for each mRNA expression probe were generated in the Department of Genomics, Research Center Life & Brain at Bonn University, Germany, using the HumanHT-12 v3 BeadChips. Subsequently, mRNA expression data were quantile normalized on probe level and without background correction using Illumina GenomeStudio. The resulting signals were log2 transformations after offset addition (+16). Exclusion criteria for Illumina HT12 probes included: i) probes which were only marginal or not expressed (minimum Illumina detection P-value > 0.05), and ii) probes without autosomal (hg19) positioning. Additionally, ambiguous and SNP-containing probes