Policy Research Working Paper 6799
The Implementation of Industrial Parks
Some Lessons Learned in India
Yannick Saleman Luke Jordan
The World Bank
Financial and Private Sector Development Competitive Industries Global Practice Unit March 2014
WPS6799
Public Disclosure AuthorizedPublic Disclosure AuthorizedPublic Disclosure AuthorizedPublic Disclosure Authorized
Produced by the Research Support Team
Abstract
The Policy Research Working Paper Series disseminates the findings of work in progress to encourage the exchange of ideas about development issues. An objective of the series is to get the findings out quickly, even if the presentations are less than fully polished. The papers carry the names of the authors and should be cited accordingly. The findings, interpretations, and conclusions expressed in this paper are entirely those of the authors. They do not necessarily represent the views of the International Bank for Reconstruction and Development/World Bank and its affiliated organizations, or those of the Executive Directors of the World Bank or the governments they represent.
Policy Research Working Paper 6799
Industrial parks are as popular as they are controversial, in India and globally. At their best they align infrastructure provision and agglomeration economies to jolt industrial growth. More often, they generate negative spill-overs, provide handouts, sit empty, or simply do not get built.
This paper disaggregates how parks are built and how they fail. It contextualizes parks in India, followed by a thick case study of an innovative scheme that appears
This paper is a product of the Competitive Industries Global Practice Unit, Financial and Private Sector Development. It is part of a larger effort by the World Bank to provide open access to its research and make a contribution to development policy discussions around the world. Policy Research Working Papers are also posted on the Web at http://econ.worldbank.
org. The authors may be contacted at ysaleman@worldbank.org.
to buck the trend. This performance is then explained by the way in which the scheme’s design and action fit India’s political economy. The paper concludes by considering how the analysis and the lessons learned might inform the design and implementation of industrial park programs and other public interventions, in India and elsewhere.
The Implementation of Industrial Parks:
Some Lessons Learned in India
Yannick Saleman* Luke Jordan†
JEL classification
D78 - Positive Analysis of Policy-Making and Implementation H11 - Structure, Scope, and Performance of Government H44 - Publicly Provided Goods: Mixed Markets
L52 - Industrial Policy; Sectoral Planning Methods
L67 - Industry Studies: Manufacturing - Other Consumer Nondurables: Clothing, Textiles, Shoes, and Leather
O14 - Industrialization; Manufacturing and Service Industries; Choice of Technology O25 - Industrial Policy
Keywords
industrial parks, India, industry, competitive industries, textile, clusters, competitiveness, private sector development, implementation, special economic zones, industrial policy Sector Board
Financial and Private Sector Development
* Yannick Saleman is a Private Sector Development Consultant with the Competitive Industries Global Practice of the World Bank Group, based in New Delhi (ysaleman@worldbank.org).
† Luke Jordan is a Private Sector Development Specialist with the Competitive Industries Global Practice of the World Bank Group, based in New Delhi (ljordan@worldbank.org).
2 CURRENCY EQUIVALENTS
(Exchange Rate as of February 15, 2013) Currency Unit = Indian Rupees (Rs.)
54 INR = US$1
1 Lakh (100,000) INR = US $1,850 1 Crore (100 Lakh) INR = US $0.185 million
ABBREVIATIONS AND ACRONYMS APES Apparel Parks for Exports Scheme
DIPP Department of Industrial Policy & Promotion DPR Detailed Project Report
FPS Food Park Scheme
IDC Industrial Development Corporation
IIUS Industrial Infrastructure Upgradation Scheme
IL&FS-CDI Infrastructure Leasing and Financial Services – Cluster Development Initiative
MFPS Mega Food Park Scheme
MoT Ministry of Textiles, Government of India PAC Project Approval Committee
PMC Project Management Consultant PPP Public-Private Partnership PSC Project Scrutiny Committee
SEZ Special Economic Zone
SITP Scheme for Integrated Textile Parks SPV Special Purpose Vehicle
TCIDS Textile Centers Infrastructure Development Scheme
ToR Terms of Reference
3 ACKNOWLEDGMENTS
The authors wish to thank our principal reviewers Alan Gelb (Senior Fellow, Center for Global Development), Ejaz Ghani (Lead Economist, World Bank), and Professor Mushtaq Khan (Professor of Economics, SOAS, University of London). In the drafting of the paper we received invaluable guidance from Ivan Rossignol (Chief Technical Specialist, Competitive Industries Global Practice) and Professor Charles Sabel (Columbia University). The paper also benefited from the valuable comments and inputs of Laurence Wilse-Samson (Columbia University) and Vincent Palmade, Stefano Negri, Megha Mukim and Douglas Zhihua Zeng at the World Bank. We are very grateful to Ms. Sunaina Tomar, IAS, Joint Secretary, as well as to Ms. Sangeeta Saxena, Deputy Economic Advisor, Ministry of Textiles, Government of India, for fruitful discussions of the scheme and for allowing us access to all required data. Special thanks go to Mr. Raman, Executive Director, Mr.
Akshay Patel, Punita Bansal, Sharmistha Mohapatra, Riya Dhawan, Prashant Sood, Ketul Acharya, Dilip Gangadharan, M.G.Gnaneswaran and many others at IL&FS for their strong and continued cooperation and support for data provision and the organization of field visits. We are grateful to all the entrepreneurs met during those visits for their valuable time and enriching discussions.
TABLE OF CONTENTS
INTRODUCTION ... 4
I. INDUSTRIAL PARKS: THEORY AND PRACTICE ... 6
II. DESCRIPTION OF THE SITP MODEL IN INDIA ... 10
III. EARLY RESULTS: PARK COMPLETION AND DEMAND GENERATION ... 15
IV. EARLY RESULTS: CLUSTER EFFECTS AND POLICY SPILLOVERS... 20
V. EXPLAINING RESULTS: SITP DESIGN & THE POLITICAL ECONOMY OF IPs... 24
VI. REMAINING PITFALLS AND THE CHALLENGE OF SCALING UP... 32
CONCLUSIONS: LESSONS AND FURTHER RESEARCH ... 35
EXHIBITS ... 38
4 INTRODUCTION
The theory of industrial parks is seductive. It holds that governments must provide public goods, particularly infrastructure, for industrial firms to be competitive; co-located firms generate agglomeration economies; and so the public goods should be concentrated on areas of colocation. If the firms are not there yet, the provision of infrastructure will somehow induce them to be. If the area is demarcated, and the general economic environment difficult, exemptions can be made that will further entice firms and create competitiveness (in this case making the parks what is most generally termed “Special Economic Zones”, or SEZs).1
There are some cases where the practice has approached the theory. The most commonly cited cases are in East Asia, but parks also dot much of the developed world. Many question the true cost-benefit of such parks, though often with somewhat weak counterfactuals.
In much of the developing world, though, the case is somewhat simpler. The practice is far enough from the theory for subtle arguments to be moot. Industrial park and SEZ programs are often rightly criticized for producing white elephants; eroding the tax base; creating vehicles for land speculation;
delivering hand-outs to favoured firms; and funneling spending to favoured districts. That is if the parks are even completed in less than a decade.
More than one of these failures has afflicted industrial park schemes in India over the last few decades. The instrument though has continued to grow in its use, if often rechristened as “cluster development” or using variations around the term “zones”. Many of the most high-profile programs have very mixed records, often delivering under-target, several years late and with low take-up.
However, in the last few years a program has been developed and implemented in India, originated by the Ministry of Textiles, which seems to perform substantially better than the norm there. While results are still indicative, the scheme gets parks built; it guards against speculation and capture; the parks attract investment; and, in several cases, they show signs of generating real cluster effects.
At the core of the scheme’s relative success are the details of its design, and the manner in which those details fit to the political economy of building parks in India. In particular the scheme keeps parks right-sized, neither too small nor too large; makes location and dimension decisions costly to those who make them (much more costly than forfeiting a consulting incentive fee); reduces the role of forecasts; places the burden of navigating local informal relationships on those best placed to do it;
aligns roles and incentives; creates ‘soft’ infrastructure through the way it builds ‘hard’;2 and, from the outset, focuses the public sector and its hired consultants on catalyzing and monitoring groups of firms as owner-users, rather than initiating, designing or managing the parks.
In the model, government grants are closely tied to areas where there are immediate gains from coordinated action: common infrastructure and facilities and sometimes more limited help with land.
Firms which seek to gain access to support under the scheme need to cooperate on a number of immediate issues in order to access assistance. This builds agency that can lead to further externalities, whether through cooperation or “thick” markets such as for machinery and labor. This does not, however, work automatically: the effect requires a close fit between the incentives created
1 The term “SEZ” can sometimes be used by policy-makers with a specific meaning as regards the regulatory and other (mostly tax-related) exemptions provided, but it is considered the most generic term in the literature for parks providing any type of regulatory exemptions, and therefore was used as such here.
2 “Hard” refers to physical infrastructure, such as roads, rail and power, and the operational systems required for it to operate. “Soft” refers to social infrastructure, such as organizations for collective action, firm capabilities, skills, health services, cultural preservation, and so forth.
5 and the political and entrepreneurial context. It required substantial early work by the lead Ministry and its advisors to identify firms capable of leading this process among their peers, though once a demonstration effect had been created they were able to switch to a heavy focus on monitoring.
The study does not begin to claim that the scheme is a panacea. It remains early days, even if the signs are encouraging. In particular, though the scheme seems to be generating forms of cluster organization, it could experiment with doing more to capitalize on these and generate agglomeration economies quicker. The first wave of parks, now reaching operational mass, might be fertile grounds for such repeat experiments.
However, this is not a model which can be understood simply. Its performance is not uni-causal and its features are complex and deeply related to its context, in particular its local political economy, industry structures and firm capabilities. The scheme depends on the existence of a base of firms with the financial means to participate in park building (typically requiring $44,000 in equity) and more importantly with the management capabilities to at least initiate self-organization. It requires at least some “leader” firms, with the ability to recognize the value of common organization, and estimate that it outweighs the risks of free-riding and delays by “follower” firms, who themselves may join for more near-term instrumental benefits, such as reducing the transaction costs of obtaining sufficient land and scale in local infrastructural services. In turn though, this creates a risk of such leader firms, if large or able to wield substantial influence, turning this organization into a vehicle of capture. The fragmented nature of the textile industry in India likely mitigates this risk, but this may not hold if the scheme is “pushed” too quickly into other sectors or contexts.
Attempting a superficial replication is then likely to lead to one or more forms of failure, including creating the scope for corruption and collusion (and there are some signs that, even in India, the scheme is being “pushed” into sectors where it may not be appropriate). However, this does not mean there is no scope for learning, and it is our belief that there are a range of environments in which this scheme may have useful features. Nevertheless, this paper does not attempt to present a best practice for implementing industrial parks. It attempts to deepen our knowledge of how and why industrial parks fail, and how schemes can sometimes be designed in their detail, and implemented in practice, to avoid at least some types of failure.
Perhaps most broadly, it attempts to delineate the type of questions which must be asked when designing the implementation of these and other industrial policy programs. These include: what are the precise steps involved in undertaking the intervention? What performance failures might arise as these are undertaken? Where might these steps, and these performance failures, intersect? Who is given responsibility for each step? How strong or weak are their incentives to avoid the performance failure? Are there others, capable of performing the step, with stronger incentives? What is the size of each discrete intervention, and how does it interact with the prevailing political settlement (how noticeable is it, and is that beneficial or harmful)? What ripple effects could there be on the long-term pressures for or against reform, by either strengthening or removing different voices?
The remainder of the paper is structured as follows: the first section disaggregates the roles in building industrial parks, the types of failure witnessed in implementation, and relates these to each other. The second describes the model under consideration, and the third provides data on its results so far. The fourth considers tentative signs of agglomeration economies and positive and negative spillovers beyond the parks. Section five explains its performance by considering its alignment of formal and informal incentives and capabilities. Section six examines the challenges to scaling up and replicating the scheme. The paper then concludes with directions for further research and action.
6 I. INDUSTRIAL PARKS: THEORY AND PRACTICE
The rationale for industrial parks has traditionally been twofold. First, the provision of functional infrastructure is much easier to plan in a geographically limited space, particularly for delivery- constrained governments. 3 Second, the concentration of firms can provide significant spillover effects both inside and outside the park4: information spillovers, including knowledge and technology; the specialization and division of labor among enterprises; the development of skilled labor markets; and the development of markets around the parks.5
The general type of an industrial park is a concentrated set of firms operating on a demarcated ‘hard' infrastructure platform. Beyond this, a number of different forms have been developed. Most involve additional regulatory features, often to bypass unsupportive business environments, facilitated by the
“limited” area involved, in which case the umbrella term is “Special Economic Zones” (SEZs). Such variations include: “tax” parks (which provide tax benefits); technology parks; “green” parks; “export processing zones”; and many others. In this paper, “industrial park” will be used in its most general sense, i.e., involving the provision of common infrastructure to a group of industrial firms in a demarcated area, while forms involving additional regulatory or other measures will be specifically denoted as such.
In whichever variant, industrial parks in theory are a tool to develop a more general form of industrial organization: industrial “clusters”, a concentration of interconnected firms in a particular field. Such clusters can form “organically”, or can be the target of deliberate policies.6 The pursuit of active cluster development, like that of industrial parks themselves, can be a controversial policy goal. On the one hand, the growth of industrial clusters is frequently cited as a driver of China’s rapid growth.
Many emerged spontaneously, but government (especially local government) also provided crucial support for their development. 7
On the other hand, cluster development, and industrial park and zone programs in particular, have also been subject to significant criticism. There have been controversies regarding land allocated for their construction, sometimes at large scale, especially when parks are long delayed or scarcely occupied, fueling accusations of land speculation. It has also proven difficult to demonstrate additionality, i.e.
that the activity in parks would not have happened without their construction and the public money that has been spent to support it. This latter criticism has been strongest for policies that not only provide public money for park construction but forego revenues in the form of taxes or resort to specific regulations such as looser labor laws to attract investment.
Yet the criticisms seem to have had little to no impact on practice. Whether or not one side or the other of the general debate is correct, park and zone programs continue to proliferate, and many continue to under-deliver. To take just a few examples, many parks in Central America have eroded the tax base there; in Africa, industrial parks are often known to stand mostly empty even after many years; and a number of industrial parks in Afghanistan supported by various donors either did not
3 Marshall, A. (1920). Principles of Economics. London: Macmillan.
4 This review builds on previous writings by Douglas Zhihua Zeng (2006, 2010, 2011).
5 Sonobe, Tetushi, & Otsuka, K..(2006). Cluster-Based Industrial Development: An East Asian Model. New York: Palgrave Macmillan.
6 World Bank. (2010). Innovation Policy: A Guide for Developing Countries. Washington, DC: World Bank Institute;
Porter, M. (1990). The Competitive Advantage of Nations. New York: Free Press; Schmitz, H. (1995). “Small Shoemakers and Fordist Giants: Tale of a Supercluster.” World Development 23 (1): 9–28..
7 Ganne, B., & Lecler, Y., eds. (2009). Asian Industrial Clusters, Global Competitiveness and New Policy Initiatives.
Singapore: World Scientific Publishing Co. Pte. Ltd.
7 become operational or failed to attract demand. Yet a glance at pipelines of development programs across continents finds no slackening in the creation of new industrial park programs.8 Since the available evidence strongly suggests this will continue, there are likely more gains in understanding how and why park programs do or do not deliver than in attempting to frame a general law of their merits.
These general characteristics apply strongly to the Indian context. For decades state-level industrial development corporations have been building industrial parks. At the center, multiple ministries and plan periods have framed new industrial park schemes. The most visible recent attempt was the SEZ program, launched in 2005, which stumbled in implementation.9 Many examples of successful parks have been built in India, through both center and state initiatives, but the overall record is decidedly mixed, and timelines tend to be long and lengthening (as will be described in more detail below). 10 Several factors are often posited to explain the failures of industrial park programs. Some are highly specific, such as the threat of conflict, but most are broad, for example, poor sector targeting; poor location choice; insufficient investment in infrastructure; poor implementation capacity and lack of authority; and lack of high-level support and stability.11 When these are surmounted, or sidestepped, relative failure is also attributed to factors such as a lack of support for technology acquisition, skills building and quality assurance, or other actions that would generate “cluster effects”.12
Such diagnostics focus on the absence of particular institutional forms, rather than the functions that should be served by the different stakeholders.13 This runs this risk of building in “strong priors about the nature of the problem and the appropriate fixes”,14 and can stand in the way of finding solutions in terms of performance. We therefore find it more useful to classify implementation failures of industrial parks into four main performance categories:
(i) the parks do not get built;
(ii) the parks are built but there is little demand from firms to locate and invest in them;
(iii) the parks are built and generate demand, but with few “cluster effects”;
(iv) the parks are successful but have neutral or negative side-effects on investment climate outside the park (“negative spillovers” and “crowding out”).15
Two important points must be made on this classification. First, categories (i) and (ii) relate to performance failures in terms of outputs, while (iii) and (iv) relate more to outcomes. The underlying causes affecting park building (i) and investment attraction into them (ii) are very different from those affecting the development of clustering externalities (iii) on the one hand and the provision of local public goods (iv) on the other. It is still early stage for the scheme examined here to provide a formal
8 For example, in a recent analysis of the WB CI Practice affiliate’s desire for knowledge by topic, the largest unmet demand for knowledge related to parks and zones. The authors are personally aware of park programs recently formulated or in development in countries ranging from Ethiopia to Brazil to Myanmar to Afghanistan.
9 World Bank (2012), “Learning from SEZs in India”, Unpublished.
10 Farole, T.,, and Akinci, G., eds. (2011). Special Economic Zones: Progress, Emerging Challenges, and Future Directions.
Washington, DC: The World Bank.
11 Dinh, H.T. et al. (2012). Light Manufacturing in Africa: Targeted Policies to Enhance Private Investment and Create Jobs.
Africa Development Forum Series. Agence Française de Développement and The World Bank.
12 Zeng, D.Z. (2006). Knowledge, Technology and Cluster-based Growth in Africa: Findings from Eleven Case Studies of Enterprise Clusters in Africa. Knowledge for Development (K4D) Program, World Bank Institute, The W orld B ank.
13 Blum, J., Manning, N. & Srivastava, V. (2012). Public Sector Management Reform: Toward a Problem-Solving Approach. Economic Premise, Number 100, December 2012. The World Bank.
14 Rodrik, D. (2008). The New Development Economics: We Shall Experiment, but How Shall We Learn? Cambridge, MA:
John F. Kennedy School of Government, Harvard University.
15 What we term “cluster effects” and “negative spillovers” are explained in detail in section IV.
8 evaluation of the last two failures, and hence to make definitive statements about outcomes. As such, the study is principally focused on outputs, as these are necessary, if not sufficient for outcomes, and it is precisely the production of these outputs which has proven difficult and elusive (as discussed further below). Therefore the focus of this study is on evaluating how and why a scheme has managed to perform at getting parks built and attracting demand for them. However, the scheme’s potential in avoiding failure types (iii) and (iv) is explored, and areas of focus for a future evaluation identified.
Second, the ordering above is time-wise. In particular, the opportunity cost of (i): not getting the parks built, and therefore probably not spending all the public money that was committed, could be lower than the opportunity cost of (iv): successful parks but with negative side-effects (such as tax erosion, or diminished pressure for reform, discussed below), if those side-effects are large enough. However, there is not an a priori ranking of the opportunity costs of the failures, because of the variation in the size and configuration of schemes. A very large “white elephant”, whether built and empty or absorbing human and political capital and financial commitments (if not disbursals) for years, could have a larger opportunity cost than a moderate park with minor external effects.
These performance failures can be related to the process of building and operating industrial parks, the stakeholders involved and the functions they have been assigned. The steps in the process can be broadly enumerated as: (1) identification of park location; (2) identification of potential demand and overall dimensions; (3) procurement of land; (4) design and dimensioning (“master planning”) within the park; (5) financing and financial structuring and planning; (6) procurement of infrastructure building; (7) construction of infrastructure; (8) operation & maintenance; and (9) monitoring and evaluation.
These roles have been shared in many different ways between national, sub-national and local levels of government, and as many as four types of private sector firms: consultants hired by the government for demand identification, and/or designing and financing of the parks; “developers” who typically prepare the master plan for the parks; hired “constructors” and “operators” who construct the parks and manage their operation and maintenance (i.e., who follow more than make decisions); and
“users”, i.e. the private entrepreneurs occupying the park themselves. In this light, it is of limited use to call an industrial park delivery model “private sector driven” or “public-private” as soon as the private sector is “involved”. With a large number of process steps and roles, the critical questions are:
Who does the “private sector” refer to (real estate developers, consultants, users)? And, what steps will they undertake?
In this light, the pertinent question for a park scheme is how the choice of a certain part of the public or private sector to implement these steps increases or decreases the possibility for such failures. The phrases “private sector” or “PPP” need to be used carefully. Often, this implies private sector involvement primarily in the later steps of internal dimensioning (4); infrastructure construction (7) and park operation & maintenance (8), whereas the more crucial location selection (1), and demand identification and overall dimensioning (2) are predominantly, if not exclusively, taken on by a public entity. Even if this entity is supported by a technical consultancy, client-consultant agency and conflict of interest problems mean such steps may be de facto public and very often political.
Moreover, the “private sector” is heterogenous. The incentives and costs facing a consultant, a developer and the users of the park are very different, as is their situation – formal and informal – within the local political economy. It is important to caution against the prior assumption that “the private sector” will be better at all steps. Whether this is so, and who is meant by the “private sector”, will depend on specific capabilities and incentives. The design of industrial park programs should consider each of these steps, and seek to understand, in the light of the local political economy, which
9 actors would be better or worse suited to which roles. Among the conjectures we will explore below is that such “role allocation” is the most important parameter for park implementation.
To illustrate, Table 1 provides an indication of how the different functions or steps enumerated above might hypothetically map with the different types of failures mentioned earlier in some instances.
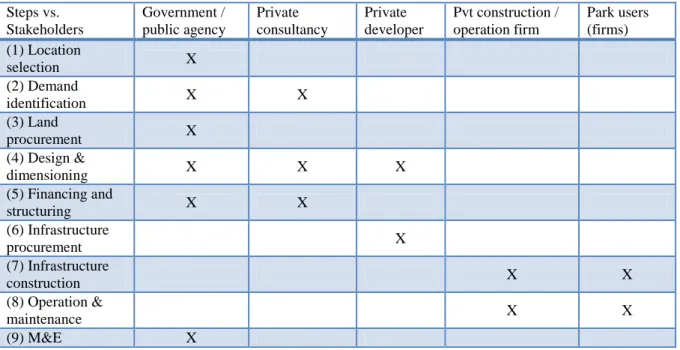
Table 2 gives an example of the mapping of actors with implementation steps in a typical “public- private partnership” model, showing the limited role played by the users/entrepreneurs, which will become a central point of the discussion below.
Table 1: Steps in industrial park development and potential failures Function vs.
Failures
(i) Park does not get built
(ii) Not enough demand
(iii) Limited cluster effects
(iv) Negative spillovers (1) Location
selection X X
(2) Demand
identification X X
(3) Land
procurement X X X
(4) Design &
dimensioning X X X X
(5) Financing and
structuring X X
(6) Infrastructure
procurement X
(7) Infrastructure
construction X
(8) Operation &
maintenance X X
(9) Monitoring &
evaluation (M&E) X X
Table 2: Example mapping of stakeholders and responsibilities Steps vs.
Stakeholders
Government / public agency
Private consultancy
Private developer
Pvt construction / operation firm
Park users (firms) (1) Location
selection X
(2) Demand
identification X X
(3) Land
procurement X
(4) Design &
dimensioning X X X
(5) Financing and
structuring X X
(6) Infrastructure
procurement X
(7) Infrastructure
construction X X
(8) Operation &
maintenance X X
(9) M&E X
10 II. DESCRIPTION OF THE SITP MODEL IN INDIA
The Scheme for Integrated Textile Parks (SITP) was inaugurated in 2005 by the Ministry of Textiles (MoT) of the Government of India (GoI). The objective was to create “world class infrastructure” for the industry and create “new textile parks of international standards at potential growth centers” to realize the full potential of the Indian textile sector.
The SITP’s most prominent innovation is the far greater, and far earlier, role it gives to the users of the park. In contrast to almost all other schemes the authors are aware of, the roles of the Centre and State are diminished, consultants are used quite differently than in common practice, and third-party developers are conspicuous by their absence. The former two concentrate on organizing, supporting and monitoring groups of firms, who must then navigate the formal and informal requirements for getting the park built.
In terms of specific roles, the MoT aimed to provide a robust implementation and funding framework, but then to delegate actual implementation and focus on monitoring. The entrepreneurs who will use the park are first required to organize themselves by forming a Special Purpose Vehicle (SPV). The SPV then selects a specialized Project Management Consultant (PMC) from a list empanelled by the MoT and under a standardized Terms of Reference (ToR) supplied by the Ministry, to prepare a Detailed Project Report (DPR) for the MoT.16 How the choice from the list is made is left to the SPV members’ discretion.
The SPV is then provided with a partial grant for the construction and operation of the park, for which they are also required to contract a PMC, though at this point it does not have to be chosen from the MoT panel. In practice, this PMC (the “SPV-PMC”), chosen for the execution of the park, is usually the same as the “MoT-PMC” which prepared the DPR and later provides advisory services to the MoT.17 For simplicity, we will therefore restrict our attention to this case in the remainder.
In more detail, the policy makes the entrepreneurs the drivers and ultimate decision-makers of the entire initiative for the creation and functioning of the park, but with support from the PMC across the steps of industrial park development. The PMCs are required to possess “considerable infrastructure development experience”, for “speedy implementation of the project”. The bar to be an empanelled PMC is high: as of 2012, only seven PMCs had been empanelled, across India.18 Project structuring, feasibility study and costing of all aspects of the project are done by the PMC, according to decisions made by the SPV, which has the responsibility to define its needs and make final decisions on location, project design and costing. When complete, the PMC transmits the DPR for appraisal to a Project Scrutiny Committee (PSC) headed by the Joint Secretary of the Ministry of Textiles. If passed, the project is submitted for approval to a Project Approval Committee (PAC), headed by the Minister of Textiles.
If the project is approved, the central government then contributes a significant share of the funds for common infrastructure, and the SPV finances the rest. This contribution is up to 40% of the total or 40 crores (~$8m), whichever is lower, as “grant-in-aid”, i.e. this does not constitute equity in the SPV.
SPVs have the possibility to solicit States and state/locally-affiliated bodies such as Industrial
16 Empanelled PMCs as of 27 March 2012 were Infrastructure Leasing and Financial Services Limited – Cluster Development Initiative (IL&FS-CDI), ICICI Winfra; Industrial Consultants; CS Architects; Kushal Global-Pearl Academy of Fashion;.Technopark Advisors; and Magus Consulting
17 IL&FS-CDI, the largest PMC on the MoT panel by number of parks managed (80%), says they have played both advisory and execution roles in 80% of the parks they manage, and that the ratio was similar for parks managed by other PMCs.
18 The policy is now being revised and a new panel will be chosen.
11 Development Corporations (IDCs) for additional contributions to finance their 60% share, for example under State-funded schemes. State/local contributions can also be under the form of subsidized land or other benefits. PMCs may also invest in the SPV’s equity, if interested and requested by the entrepreneurs.19
However these additional sources of financing are subject to the SPV members contributing at least 51% of the equity, so that they retain managerial control. There is a limit of 20% of ownership for any single private entity within the cluster, so that there is no legally dominant firm, 20 and the land area occupied in the park must also be proportional to the equity contribution.The MoT initially provided a guideline of approximately 50 members per park, but has since allowed some flexibility by providing a matrix of the additional investment expected per entrepreneur when the number is lower.
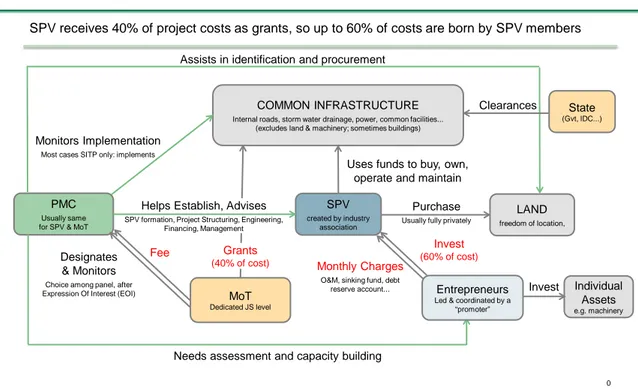
Figure 1 shows a diagram of the basic SITP scheme structure and grant financing, while Figure 2 highlights potential state and other contributions.
Figure 1: SITP design and grant structure
19 IL&FS has participated in the equity in two parks, the Palladam Hi-Tech Weaving park in Tamil Nadu, and the Pochampally Handloom Park in Andhra Pradesh.
20 20% is the legal threshold for giving key decision powers to an equity holder, although the threshold was not explicitly mentioned in the policy document and it was not clear if it could be circumvented by the use of two legal entities of the same group.
0
SITP Design & Basic Grant Structure
SPV receives 40% of project costs as grants, so up to 60% of costs are born by SPV members Assists in identification and procurement
Invest Helps Establish, Advises
SPV formation, Project Structuring, Engineering, Financing, Management
SPV
created by industry association
Grants (40% of cost)
Invest (60% of cost) COMMON INFRASTRUCTURE
Internal roads, storm water drainage, power, common facilities...
(excludes land & machinery; sometimes buildings)
Uses funds to buy, own, operate and maintain
Monthly Charges
O&M, sinking fund, debt reserve account...
PMC
Usually same for SPV & MoT
Designates
& Monitors
Choice among panel, after Expression Of Interest (EOI)
Fee
LAND
freedom of location,
Purchase
Usually fully privately
Monitors Implementation
Most cases SITP only: implements
Needs assessment and capacity building
Individual Assets
e.g. machinery
Clearances State
(Gvt, IDC...)
MoT
Dedicated JS level
Entrepreneurs
Led & coordinated by a
“promoter”
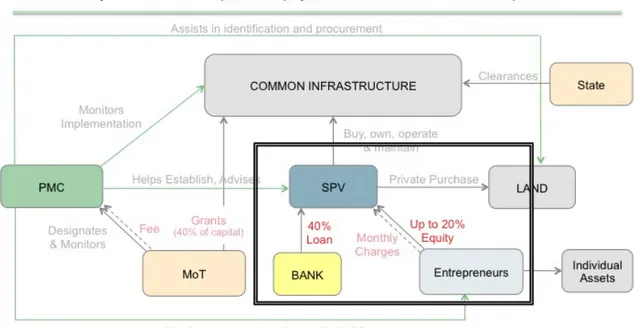
12 Figure 2: State and other bodies’ contributions
To raise funds for the SPV’s share of costs, the PMC supports the SPV to structure and obtain financing, most often securing term loans for 40% of the costs by using common assets as collateral.
Financial innovations may be used to facilitate securing the loan, such as including a 6-month debt repayment fund,21 or having reimbursements made individually, despite the debt being raised in common through the SPV, to limit free riding22. This leaves approximately 20% of the costs as the equity portion of funding, to come in the most part as equity from the parks’ users.
Project costs, as described by one of the PMCs, include: land purchase and site development23; common infrastructure (roads, water supply, storm water drain, power provision, etc.); factory buildings; common facilities (lab, training center, etc.); engineering fees (for engineering design); and pre-operative costs (depending on components, and usually around 5% of costs). Factory buildings are eligible for grants only if built and owned by the SPV, and not by individual firms in the cluster.
The latter option is most common when firms in the cluster are heterogeneous. If firms are more homogenous, there can be large cost savings and added flexibility by building identical factories. This might have implications for the fitness of the model to different types of industries, due to the level of homogeneity in firms’ processes. For example spinning or weaving parks would typically be homogenous, as opposed to garmenting parks, and the conjecture is that the scheme structure might favour the former type, in terms of project costs and/or completion time. We do not have enough data
21 The debt repayment fund is effectively a debt service reserve account that allows the SPV to sustain up to 6 months of non-repayment of the loan, for example in the case of a liquidity crunch, before defaulting on the loan (which would trigger the seizure of assets by the lending institution).
22 This innovation was described by IL&FS as originating from them and being unique among empanelled PMCs.
23 Land is not eligible for the Central Government grant, but instead counted as equity contribution from the SPV, who is responsible for finding and buying it.
0
Identifies &
Procures Helps Establish, Advises
SPV
Entrepreneurs COMMON INFRASTRUCTURE
Buys, Own, Operate, Maintain
PMC
Designates
& Monitors
LAND Monitors
Implementation
Needs assessment and capacity building
Individual Assets MoT
State/Local and Other contributions
State/Local & other institutions can contribute subject to SPV retaining 51% of equity share Assists (identification & procurement)
State/IDC
Clearances &
add-ons
Grants
State/IDC
Assists with or Acquires
Invest (min 51% of equity share) Invests
E.g. IL&FS through PE fund
13 at this point to make such an analysis, but flag it for further research. Machinery is excluded from the costing of the project for the provision of grants, and is to be funded by individual units.
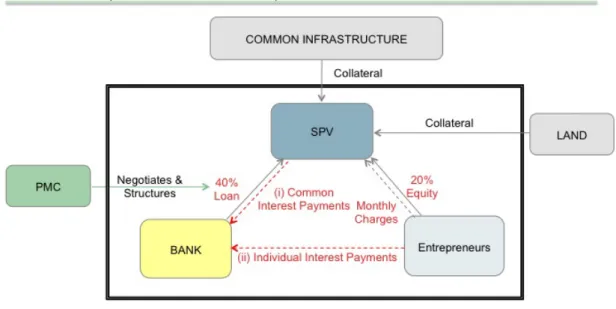
During operations, the SPV charges its members monthly to recover the money from investments made and repay the debt. The level and structure of these charges are often designed by the PMC during project initiation. The largest PMC usually includes in the fees: maintenance charges; utility charges; infrastructure charges proportional to the area occupied; contributions to a sinking fund (in case of major repairs); and financial payments24. Figures 3a and 3b show diagrams of the debt financing mechanisms used and possibilities of financial structuring. Note that these financial structures are at the discretion of the users, PMCs and financial institutions. New financing models for the costs not funded by the grants do not require MoT sanction, encouraging innovation.
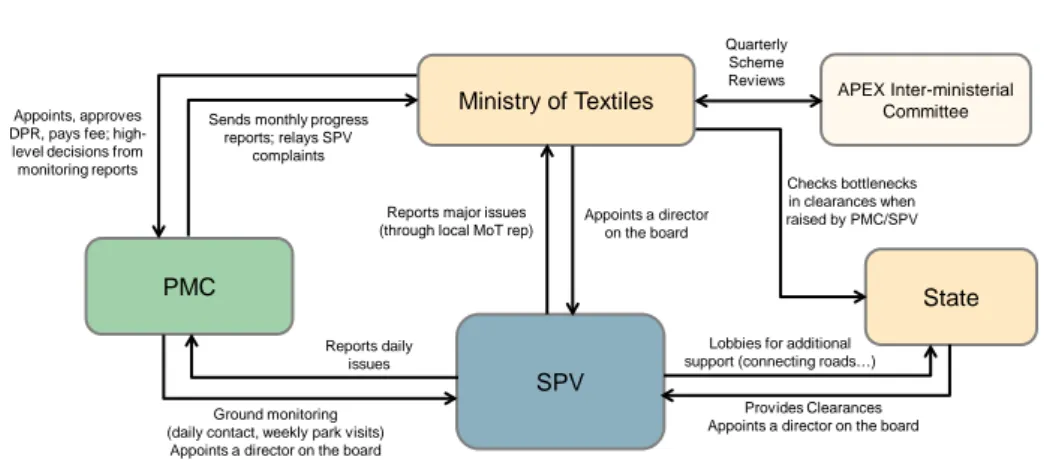
Finally, project monitoring and evaluation are undertaken by the MoT, through the PMCs. The PMC is required to devise a “suitable monitoring and evaluation system” and must furnish “monthly reports/returns to the MoT” (samples available from the authors on request). The PMCs are paid a fee by the Ministry for their work (we consider the fee structure in Section V).
Figure 3a: Typical debt financing structure
24 For example IL&FS suggests firms contribute around 10% of the monthly payment to a Common Debt Repayment Service Fund (CDRSF), to meet dues in case of default of a member. This solidarity mechanism typically allows the structure to survive temporary liquidity issues of a member, for example because of delays in getting payments from clients.
The member is asked to replenish the fund when the situation normalizes. These innovations would be conditional of MoT review and approval at the Project Scrutiny stage.
14 Figure 3b: Alternative debt repayment mechanisms (innovation of PMC IL&FS)
Comparing this model to the implementation framework developed above, the SPV, with the PMC, is involved in or has exclusive execution responsibility for all of the steps (1) through (8). The crucial decisions are costly to those who make them, who are also those with the thickest information about the local conditions needed to site the parks.
Location selection (1) and land procurement (3) are supported by the PMC but decided and executed by the entrepreneurs themselves. By participating in the SPV the entrepreneurs make a costly signal of demand, providing robust demand identification (2), even if, as does occur, the government or the PMC initiates the process by approaching the entrepreneurs. Demand is therefore more or less actual, rather than potential or projected, before subsequent steps are triggered. Dimensioning (4), financing (5) and procurement are the responsibility of the PMC. Infrastructure provision (7) and O&M (8) are executed by specialized contractors, chosen by the SPV (though again with assistance from the PMC).
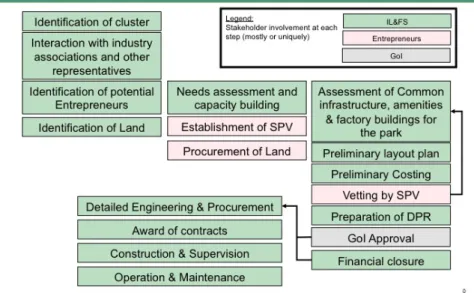
Figure 4 illustrates a typical PMC’s involvement in the park development process.
Two initial notes are important here on the capabilities of the firms involved, and on what the scheme offers to them. First, while the aggregate investment requirement from participating firms may seem large, it can and often is brought within range of a wide number of firms through the financing arrangements. Of the Rs 2 Cr (~$400k) average cost per firm, Rs 0.8 Cr (~$160k) are financed through grants, most often an additional Rs 0.8 Cr through bank loans and in many cases Rs 18 lakhs (~$36k) through state grants, leaving a still sizable but less stringent Rs 22 lakhs ($44k) to be paid directly as equity per firm. While substantial, this should be within range of a small to medium firm, for example in weaving being approximately the same cost as one to two modern autolooms.
A more difficult requirement is likely to be that for the management capabilities to create and manage the SPV, including the ability to identify fellow firms and motivate them to join. This will be treated in more detail below, but the critical role here seems to be that of a “lead” firm (or firms), which see early the potential of the scheme for creating collective benefit, and which then identify other
15
“follower” firms to participate. These latter must be convinced to delay set-up or expansion plans and take part in a collective enterprise requiring a high degree of trust and a costly commitment of capital.
Not only must such firms exist, but the scheme must offer to solve some problem they face which they find difficult to solve alone. While it is difficult to make definitive conclusions on this score, our conjecture is that the “lead” firms are motivated by the promise of cluster effects, and the “followers”
of solving the small-scale infrastructure service and land purchase market failures endemic in India.
This will be discussed at greater length below.
Last, we make note of what the SITP does not offer. The Center provides no assistance in procuring land, while States may do so, but have tended not to, and have tended not to be asked (a topic discussed at more length below). SITP parks have no exceptional regulatory provisions and no ongoing fiscal subsidies to the firms as individual units or to the SPV. It funds only 40% of the cost of the parks’ infrastructure. In money and regulation, it is less generous to firms than most industrial park schemes, which should be borne in mind as we turn to consider its results.
Figure 4: PMC project development process snapshot25
III. EARLY RESULTS: PARK COMPLETION AND DEMAND GENERATION Relative success in getting parks built
To analyze the SITP’s results to date, data was obtained primarily from Infrastructure Leasing and Financial Services, Cluster Development Initiative (IL&FS-CDI, here simply referred to as IL&FS), following approval from the MoT26. IL&FS is the most active PMC27, with 32 projects currently
25 Modified from an IL&FS document
26 A meeting with the Ministry of Textiles confirmed that using IL&FS data on their parks would be most efficient to conduct an analysis of the scheme.
27 IL&FS is a limited company headquartered in Mumbai and with equity participations from Life insurance Corporation of India (25.9%), ORIX Corporation Japan (23.6%), Abu Dhabi Investment Authority (11.3%) and Housing Development Finance Corporation (10.7%), as well as the IL&FS Employees’ Welfare Trust (10.9%) and other smaller participations including from CBI and SBI. It started as a leasing company, then expanded into doing infrastructure PPPs. The creation of IL&FS-CDI, initially as an integral part of IL&FS and then as a separate (but 100%-owned) subsidiary, was triggered by the launch of the SITP scheme in 2005.
16 under management, of the 40 approved in the first round of the scheme. The data was complemented with field visits and interviews conducted at multiple sites in two states with among the largest number of parks (Gujarat and Tamil Nadu), as well as meetings with relevant state authorities and industry associations when possible (further details of field visits are available from the authors on request).
The data provides a strong indication that type (i) implementation failures (parks not being built, or not in a timely manner) are largely being avoided under SITP. The scheme began in 2005 with a target of 25 parks, later extended to 40 parks because of high demand. By 2011, all 40 parks had been approved and had at least begun construction. By 2013, almost all were operational or close to being operational. Specifically, of the 40 parks, the breakdown of advancement as of October 2012 was as follows: 11 fully completed; 13 started commercial production; and 16 parks at various stages of construction. The list of parks and their basic characteristics is given in Exhibit 1 at the end of this paper. The time-wise approval of parks under SITP is as per Table 3 below.
Table 3: Time-wise approval of textile parks under SITP
Year of Approval Number of Parks
FY 2005-2006 07
FY 2006-2007 17
FY 2007-2008 03
FY 2008-2009 12
FY 2009-2010 01
TOTAL 40
In terms of spatial location, the first wave of parks principally located in the western and southern states, particularly Gujarat, Maharashtra, Tamil Nadu and Andhra Pradesh. Few located in major cities, but most were set up in secondary cities with strong industrial clusters (such as Surat in Gujarat, or in the textile belt around Coimbatore in Tamil Nadu). This accords with recent studies finding a shift of industrialization in India to secondary cities, a development which is likely to have beneficial effects for the inclusiveness of growth.28
Among IL&FS parks for which we have data, there is considerable variance in time-to-completion between projects. Most were completed or are expected to be completed within an average (and median) of around 6 years from approval time. The fastest has been completed in 3.9 years and the longest is expected to be completed in 9.1 years, and around 60% of parks have been completed or are expected to be completed in between 4.5 to 7 years.
Moreover, 2 of the 32 projects managed by IL&FS have been cancelled. The cancellations occurred while the projects had disbursed only 30% of the planned MoT grants (corresponding to milestone two of five in a typical park timeline), and these projects had been approved during the most active approval year, in FY 2006-2007. Two other projects were cancelled among the 8 non-IL&FS parks, both after 10% of committed grants had been disbursed.29 But even adding those, this translates into a loss rate of less than 3% so far for what might be viewed as public grant “venture capital”.
28 Desmet, K., Ghani, E., O’Connell, S., & Rossi-Hansberg, E. (2012). The Spatial Development of India. Policy Research Working Paper. The World Bank.
29 One was managed by SREI Capital Markets Ltd., the other by CS Architects Pvt. Ltd. Both were cancelled
17 In interviews the PMC attributed variation to the complexity of the project and the speed of obtaining clearances and financing. Environmental clearances in particular were said to lengthen completion time by approximately a year. What the data shows is a small positive correlation of average completion time with total cost, but no significant relationship was found with the size of businesses in the park (proxied by average land area per entrepreneur) or with the size of parks (in terms of land area).
There was some variance across states, with Gujarat, Karnataka and Andhra Pradesh faring best, and West Bengal worst. However, the statistical evidence is relatively weak given the small number of parks. Moreover, variations within states were at least as wide as those between states. For example in Tamil Nadu average completion time was close to the national average (6.7 years versus 6.4 years in the 32 IL&FS parks), but ranged from 4 to 9 years within the state. However controlling for states did not yield any additional significant results in terms of correlation between completion time and park attributes such as complexity (project cost), size (in acres) or the average size of businesses in the parks. Exhibit 2 summarizes this time-to-delivery data.
While these gestation periods may seem long in some contexts, for industrial parks in India this pace of delivery is at the least respectable. There is a common perception that the speed of implementation, of “getting things done”, is a constraint on India’s growth, and long project timelines are common for general as well as industrial infrastructure.30 Moreover, there is some evidence that the early years of the program represented a natural learning period, as stakeholders adjusted to an innovative policy and its arrangements. With the stakeholder system having achieved learning by doing, there are some indications momentum is building. The policy will be extended commencing this year, and 45 Detailed Project Reports (DPRs) are already on the Ministry’s table. The strongest evidence for the SITP’s ability to avoid type (i) and type (ii) failures, though, comes from a comparison with other industrial park schemes attempted in India in the last few years.
First, and probably the highest profile such attempt, was the SEZ scheme. This was launched to much fanfare in 2005, with the passage of the SEZ Act. Being enacted by national legislation, with wide coverage, and widely supported by public land acquisition, it attracted vastly greater interest than the SITP: 580 SEZs have been approved, but only 380 notified (i.e., land has been acquired), and of those only 124 were operational at the time of writing, a conversion ratio of 21%. The vast majority of the operational SEZs were IT office parks. In manufacturing, only 44 non-IT SEZs were in operation in mid-2011. This is roughly comparable to SITP parks, despite the significant fiscal and regulatory advantages offered by SEZs, the much wider sectorial scope of the policy and the broad support it has received from both states and Centre (including again through cheap government land).31 Moreover, while SEZ approvals have been declining rapidly, and private sector interest waning, interest in SITP parks is only growing, despite the absence of tax breaks or similar instruments. Exhibit 3 summarizes comparative figures between realizations under the SEZ Act of 2005 and under SITP.
Previous textile cluster schemes were also less successful than SITP, despite offering sometimes much higher levels of support. In those, the states or their agencies were responsible for most implementation steps, from location selection (1) to dimensioning (4), and from infrastructure provision (6) to park operation and maintenance (8), with monitoring (9) remaining mostly with the central government. TCIDS32, which offered assistance of 50% of costs capped at Rs. 20 crores, saw
30 12th Five-Year Plan, Government of India.
31 World Bank (2012)
32 Textile Centers Infrastructure Development Scheme
18 some projects being completed, i.e., somewhat avoided type (i) failure, but most were small and brownfield, and many were perceived to be subject to a type (ii) failure, i.e., lack of demand.
A more recent scheme was APES (Apparel Parks for Exports Scheme). This targeted green field and larger parks. Location selection (1) was shared between state and center, dimensioning was pre- decided at between 150 to 250 acres (4), and land provision was the explicit responsibility of state governments (3). Despite offering grants for 75% of infrastructure costs (vs. 40% under SITP), APES saw only 2 projects approved: one in Tirupur, Tamil Nadu, where the industry association de facto took over implementation;33 and one in Ludhiana, Punjab, which took more than 10 years to develop.
A similar pattern of results may be identified in other sectors. For example, the Ministry of Food Processing (MoFP) also had a cluster scheme, the Food Park Scheme (FPS), which was a centrally sponsored scheme, i.e., funding was flowing to the states that would then fund the scheme locally.
The result was that financing (step 5) became even more problematic than when the Center was directly playing this role, leading to the failure to build parks at all (type (i) failure, and therefore all other types of failures).
In contrast, another central scheme for industrial parks that has made similar design choices as the SITP has been widely perceived as effective at avoiding type (i) and type (ii) failures. Like SITP, the Industrial Infrastructure Upgradation Scheme (IIUS) requires compulsory formation of an SPV to drive the process and appointment of the equivalent of a PMC for all-encompassing support. IIUS can only be used for existing parks, i.e. brownfield projects, so the challenge may be lesser. In addition the IIUS only took on SITP-like features in 2009, so the case has been studied in less detail. However, the IIUS applies to any sector, not only textiles, which provides some support to the hypothesis that role selection is crucial in avoiding type (i) and type (ii) failures, whereas the sector to which this applies is much less relevant (with caveats explained below). Further details on IIUS are available from the authors on request.
Early indications in firm demand, investment and jobs
Returning to the SITP, the data indicates that parks are not only built but are realizing investment.
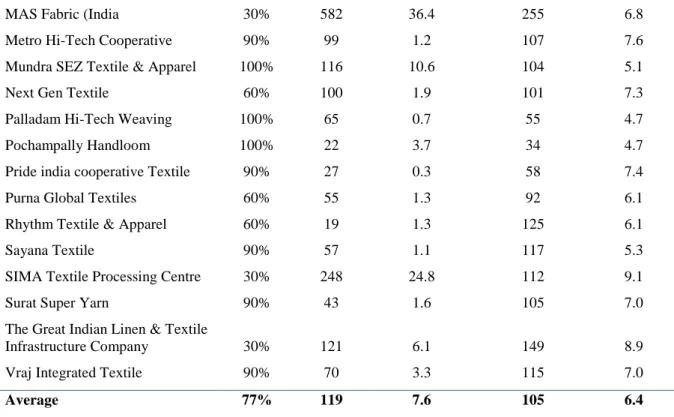
Long-run target investment in the 40 parks is approximately Rs. 20,000 crores, or $4 billion.34 Among IL&FS parks35, current investment has already reached 38% of the final target. In absolute terms, current investments represent 4 times grant disbursals, which is twice the policy’s objective. Progress towards targets is not related to the average size of plots in the parks. This indicates the scheme has managed to spur extra private investment, beyond park infrastructure, across the SME size spectrum.
Further, progress towards investment targets does seem positively related to additional grant disbursal, indicating that private and public investment are being sequenced together. Seven parks already show a ratio of private investment to public grants in line with the final targets. Exhibit 4 provides detailed investment data and statistics, while Exhibit 5 shows the relationships between investment figures and ratios with the percentage of government grant released, park project costs, average plot size and target investment/grant ratios.
33 This park was part of the field visits conducted as part of the study, and several entrepreneurs were interviewed.
34 This corresponds to around $2 million per entrepreneur per park on average, which might seem an ambitious target and if reached would mean the SMEs in the park would eventually graduate from being officially classified as “medium”.
Reaching half that target would still be a considerable achievement and does not seem out of line with investment rates observed during field visits.
35 Excluding the two parks cancelled among IL&FS ones, the sample analysed here