Art Perception in the Museum: How We
Spend Time and Space in Art Exhibitions
Claus-Christian Carbon
Department of General Psychology and Methodology, University of Bamberg, Bavaria, Germany; Forschungsgruppe EPÆG (Ergonomics, Psychological Æsthetics, Gestalt), Bamberg, Germany; Bamberg Graduate School of Affective and Cognitive Sciences, Bavaria, Germany
Abstract
Aesthetics research aiming at understanding art experience is an emerging field; however, most research is conducted in labs without access to real artworks, without the social context of a museum and without the presence of other persons. The present article replicates and complements key findings of art perception in museum contexts. When observing museum visitors (N ¼ 225; 126 female, M(age) ¼ 43.3 years) while perceiving a series of six Gerhard Richter paintings of various sizes (0.26–3.20 sq. m) in a temporary art exhibition in January and February 2015 showing 28 paintings in total, we revealed patterns compatible to previous research. The mean time taken in viewing artworks was much longer than was mostly realized in lab contexts, here 32.9 s (Mdn ¼ 25.4 s). We were also able to replicate visitors spending more time on viewing artworks when attending in groups of people. Additionally, we uncovered a close positive relationship (r
2¼ .929) between canvas size and viewing distance, ranging on average between 1.49 and 2.12 m (M ¼ 1.72 m). We also found that more than half of the visitors returned to paintings, especially those people who had not previously paid too much attention at the initial viewing. After adding the times of returning viewers, each picture was viewed longer than had been estimated in previous research (M ¼ 50.5 s, Mdn ¼ 43.0 s). Results are discussed in the context of current art perception theories, focusing on the need for the ecologically valid testing of artworks in aesthetics research.
Keywords
empirical aesthetics, museum context, ecological perception, artworks, aesthetic appreciation, time, Gerhard Richter, insights, incubation, viewing distance, canvas size, area size, art viewing distance accommodation
Corresponding author:
Claus-Christian Carbon, University of Bamberg, Markusplatz 3, Bamberg, Bavaria 96047, Germany.
Email: ccc@experimental-psychology.com
i-Perception January-February 2017, 1–15
!The Author(s) 2017 DOI: 10.1177/2041669517694184 journals.sagepub.com/home/ipe
Creative Commons CC-BY: This article is distributed under the terms of the Creative Commons Attribution 3.0 License (http://www.creativecommons.org/licenses/by/3.0/) which permits any use, reproduction and distribution of the work without further permission provided the original work is attributed as specified on the SAGE and Open Access pages (https://us.sage- pub.com/en-us/nam/open-access-at-sage).
In 2001, Smith and Smith presented a seminal article on empirical aesthetics to provide data on viewing times in a museum context according to some key variables such as age, gender, and group size. The article has been widely referenced ever since, as it was the first systematic research to document a much longer elaboration of artworks in museums: On average 27.2 s longer, in fact, than in typical lab settings where usually less than 3 s are realized. Subsequent critical voices have repeatedly argued that the very different viewing times and viewing conditions in museums make it difficult to assess the ecological validity of such lab studies in which artworks are presented on computer monitors, and as such they lack authenticity (Wolz & Carbon, 2014), merely showing depictions of artworks at very different, mostly standardized sizes (Locher, Smith, & Smith, 2001). Research has repeatedly documented the effects of viewing and therefore also usable processing time on the specific perception, elaboration, and understanding and appreciation of art. In their seminal microgenetic approach on art perception, Bachmann and Vipper (1983) showed a clear influence of presentation time on the overall perception of art; a finding that was later specifically tested by Augustin, Leder, Hutzler, and Carbon (2008) with regard to the dimensions of content and style of art. It was revealed that information on style was only available after processing of content issues had been started (Augustin et al., 2008), a finding which was further demonstrated via an Event-Related Potentials (ERP) study making use of lateralized readiness potentials combined with the N200 effect (Augustin, Defranceschi, Fuchs, Carbon,
& Hutzler, 2011). Even the differential viewing time conditions of artwork titles had a clear impact on the understanding of artworks—people with a deeper knowledge of art especially benefitted from longer viewing times (10 s compared with 1 s) of the titles (Leder, Carbon, &
Ripsas, 2006). This result is of particular interest here, as the 10-s viewing condition is much closer to natural viewing conditions in museums than those typically realized in lab-oriented research (Smith & Smith, 2001).
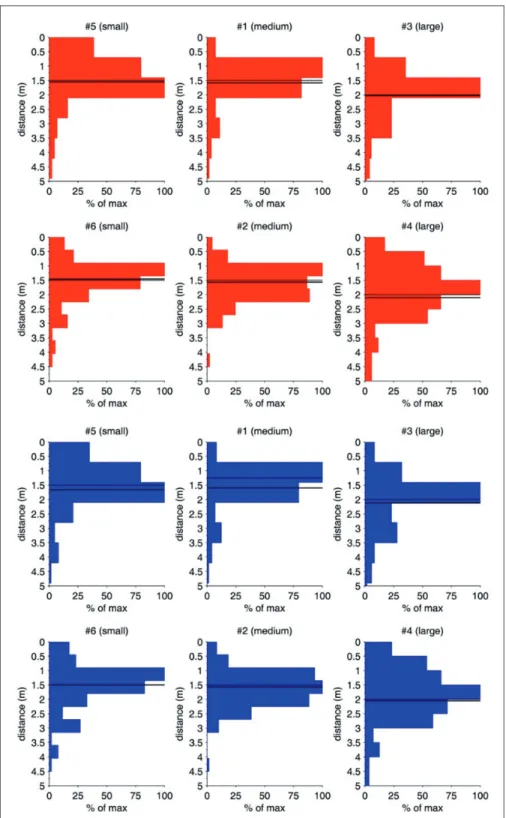
It is certainly very important to consider the impact of viewing time on art perception, but this is just a part of the whole story of art experience. Another facet is represented by viewing distance. The viewing distance is usually fixed in experimental research, especially in lab research presenting depictions of artworks on computer monitors. When entering a museum, however, it soon becomes quite obvious that visitors change their viewing distance from art piece to art piece in a rather intuitive way. Systematic information on typical, self-chosen distances which visitors use to inspect an artwork is mainly missing.
Such data are highly important to adequately simulate typical museum behaviour in the lab; such data should also provide some information on how perception potentially changes with the size of the observed painting and thus how we might adjust distances in the lab to be in accord with such practices (cf. Locher et al., 2001).
Last but not least, Smith and Smith (2001) have already drawn our attention to another important property of museum visitors: In contrast to participants in typical lab studies being tested individually to guarantee an unbiased, personal evaluation, visitors to museums often gather together in social groups in front of artworks: Smith and Smith documented that about ¼ of all study attendees visiting the exhibition were with one other person (19.3%) or with two other people (3.3%). The interaction between visitors while viewing an artwork might change the art experience as well, generating a social event out of it.
The present study aimed to replicate and expand on the study of Smith and Smith (2001)
for several reasons: (a) since its publication in 2001, the Smith and Smith study has been a
kind of gold standard of reference when discussing and referring to typical viewing times in
ecologically valid art contexts, so any kind of replication seems to be mandatory; (b) the
Smith and Smith study was conducted in the permanent collection of the Metropolitan
Museum of Art (the MET) in New York city, one of the largest art museums in the world, so viewing times could have been biased by the specific (probably touristic) behaviour of visitors trying to catch a very long list of masterpieces within a narrow global time frame; (c) the Smith and Smith study lacked information on viewing distance and how often artworks were reassessed by multiple viewings of the artworks. Accordingly, we conducted an observation study on an art exhibition with a very limited number of paintings; in actuality this was a temporary exhibition in one big exhibition hall solely devoted to one painter (Gerhard Richter), to test explicitly for a very different character of exhibition and to gain more control of (multiple) visitor viewings of the artworks. To fulfil these challenging observation duties, we employed a state-of-the-art observation tool which we programmed as an Android app where viewing time, viewing distance, and further variables—aside from demographic data—were traced; among them how often the registered visitors returned to some paintings.
Study
In this observation study, we tested some of the findings revealed and the hypotheses put forward by the seminal article of Smith and Smith (2001). The main aim was to analyse museum visitors’ behaviour in terms of viewing duration and distance, how often people returned to a painting and how behaviour changed throughout such reassessments.
Method Participants
We tested a total of 225 visitors (126 female, M(age) ¼ 43.3 years) attending the special exhibition on Gerhard Richter by unobtrusively observing them from a balcony above, which was barely detectable by typical visitors; 104 people visited the paintings on their own (category single), 100 visited them with one other person (category pair), 11 in a group (category group) of two or more, and 10 with their children (category family—here the children were not observed further, but a focus was set to the person who first attended the respective artwork). A total of four persons attended the exhibition with a wheelchair, two with a folding chair, and one with a walking stick; no other accessories in this respect were recorded. None of the participants detected the observers and so were naı¨ve to the purpose of the study.
Stimuli and Apparatus
Six paintings (see Table 1) by Gerhard Richter, a German visual artist born in 1932 in Dresden or German Empire, known worldwide for his abstract—as well as photorealistic—artworks, which realized the highest auction prices ever for a living artist.
All were displayed at a temporary exhibition called Detail: Paintings from the Bo¨ckmann Collection at the Neues Museum Nu¨rnberg (NMN; State Museum for Art and Design in Nuremberg) in Nuremberg, Germany. The whole exhibition was defined as a comprehensive and representative selection of Richter’s work. It comprised 28 works in total.
The six paintings which were utilized for the study were all positioned side by side on one
wall of the only hall in the entire exhibition; the two observers assessing visitor behaviour
were situated on a balcony above the hall overseeing the entire scene of interest (for an
original setting please refer to Figure 1). On the floor, the tile sizes were exactly
50 50 cm, allowing the easy assessment of viewing distance between visitor and painting with a resolution of 50 cm accordingly.
To track the visitors’ viewing behaviour, we employed a computer application which we programmed for the sake of this observation study as an Android app on Sony tablet personal computers. The application allowed the fast and intuitive entering of data—viewing distance was assessed in steps of 0.5 m corresponding to the tile structure on the floor of the exhibition hall. Times were recorded by automatic timers which were triggered by entering a viewing distance from a specific painting on the screen and were stopped by tapping on the corresponding picture. Further information could be recorded, for example, demographic data (gender and age) or whether the observed person was accompanied by other persons or showed some characteristics of interest (e.g., using a walking stick). Importantly, the app was easily capable of going back to specific persons in Figure 1. Original setting in the exhibition hall. (a) The order of focused paintings in detail, seen by the observers located at the balcony upstairs with a typical visitor standing in front of painting no. 3 at a viewing distance of 1.5 m (equals three tiles away from the painting’s plane) and (b) the same setting including the approximate locations of the two observers on the balcony, indicated by two ellipses titled Observer 1 and Observer 2.
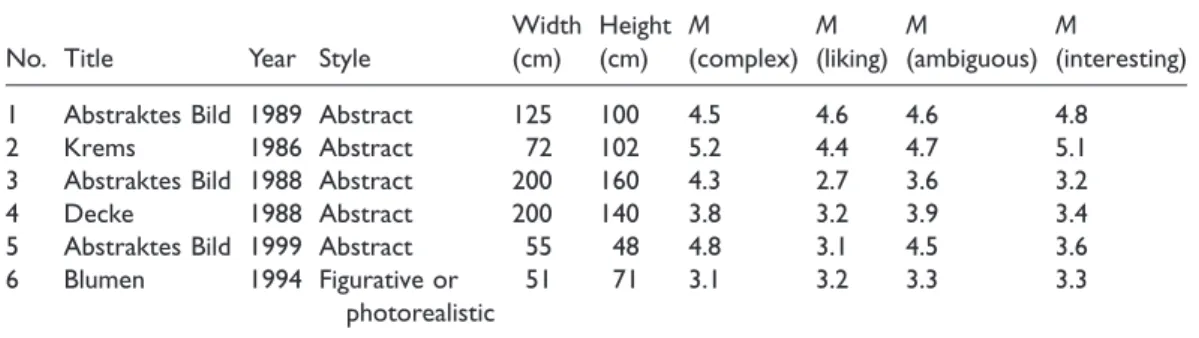
Table 1. List of Artworks for Which the Viewing Behaviour Was Registered.
No. Title Year Style
Width (cm)
Height (cm)
M (complex)
M (liking)
M
(ambiguous) M
(interesting)
1 Abstraktes Bild 1989 Abstract 125 100 4.5 4.6 4.6 4.8
2 Krems 1986 Abstract 72 102 5.2 4.4 4.7 5.1
3 Abstraktes Bild 1988 Abstract 200 160 4.3 2.7 3.6 3.2
4 Decke 1988 Abstract 200 140 3.8 3.2 3.9 3.4
5 Abstraktes Bild 1999 Abstract 55 48 4.8 3.1 4.5 3.6
6 Blumen 1994 Figurative or photorealistic
51 71 3.1 3.2 3.3 3.3
Note.
All paintings were by Gerhard Richter, painted in oil on canvas, with the exception of no. 5 being painted in oil on Alu
Dibond. The four variables
complex,liking,ambiguous, andinterestingoriginated from a post hoc study which was conducted
with a different sample of
N¼10 (six female,
M(age)¼24.2 years) who were presented the paintings in blocks in the order
indicated below on Likert ratings from 1 (not very much) to 7 (very much).
order to enter additional data for already observed visitors who had returned to a painting.
This technique allowed the history of the viewing of such a painting to be compiled.
Procedure
Two observers were located on the balcony, with Observer 2 assisting the experimenter Observer 1, who entered the data. This was done first of all to ensure objective data entry and was also used for tracing visitors who might potentially come back. Note: The six assessed paintings were situated at the end of the exhibition hall, near the exit—actually just one picture was hung closer to the exit gate. Still, the whole setting of the exhibition invited the reassessment of the paintings again, as there was no constraint on how to access the single artworks in a certain way. The observers tried to focus on single visitors to capture their entire viewing behaviour with regard to the paintings under observation. This made it necessary to test single, randomly chosen persons in depth, so the duration of the total testing was considerably long as many visitors take quite a while to wander through the whole exhibition. In fact, we tested over about five consecutive weeks, from 17 January until 22 February 2015. Had an observed visitor looked above and detected the experimenters, the trial would have been abandoned and the respective data omitted from analysis, but this case never happened. Age was estimated at a resolution of 5 years; gender was assessed by the outward appearance of the person.
Results
For data analysis, the general ideas proposed by Smith and Smith (2001) will be followed in order to provide an opportunity to compare the results across studies; this is especially important because the Smith and Smith study is often referred to as the reference study for viewing behaviour toward artworks in museums. Afterwards, additional data will be presented on viewing distance. Importantly, more than half of the visitors (55.3%) who were registered to have viewed an artwork at least once returned to it after a while—looking a little closer at the pattern of returning reveals that some visitors viewed an artwork several times; up to six times in certain cases (see Figure 2).
Therefore, the analyses will only start with a focus on the first viewing in order to be in accordance with the data report of the Smith and Smith study and will then move on with further analyses on the viewing behaviour across the several viewings: Important information on the process and nature of art experience in a museum which the original study from 2001 did not contain.
Viewing Time of Artworks
For the following analyses, we will first focus only on the initial viewing of an artwork. Later on, this view will also be expanded upon by analysing data for visitors who came back to an artwork.
We observed quite similar viewing times to what previous research had, which is also
reflected by typical experiences when art museums are attended (see detailed data in
Table 2). Visitors spent on average 33.9 s (Mdn ¼ 25.1 s)—Smith and Smith (2001), for
instance, revealed a relatively similar mean time of 27.2 s (Mdn ¼ 17.0 s). People were
found to spend very different amounts of time in front of different artworks, here between
25.7 s and 41.0 s on average—note: although the exact durations differed from the Smith and
Smith study, they also documented such a various viewing behaviour with a range of viewing
duration from 13.2 s to 44.6 s.
Visitors viewed the artworks quite selectively, omitting 2.5 out of the given range of six pictures—a clear sign of selective viewing behaviour even in a special art exhibition showing a very limited number of paintings.
In contrast to Smith and Smith (2001), we did not find any substantial differences among group sizes, F(3, 221) ¼ 1.16, p ¼ .3271, ns: Category single visitors showed a mean viewing duration at first attendance of 35.6 s, category pair showed 31.4 s, group showed 36.5 s, and family showed 36.4 s. In accordance with the Smith and Smith study, we could not find any significant difference between female (M ¼ 34.6 s) and male visitors (M ¼ 32.7 s), t(214) < 1, p ¼ .5601, ns.
Figure 2. Probability of viewing (attendance) from the first up to the sixth viewing for the corresponding artworks no. 1 to 6. The thick black line shows an exponential fit of the average probability of attendances (the dotted blue line shows the respective average empirical data). The decrease in total number of attendances very closely followed a negative exponential function (r
2¼ .983).
Table 2. Mean Values for Viewing Time and Viewing Distance (Employing Only First Attendances to Artworks), Total Viewing Time (Sum of All Viewings), Mean Visual Viewing Angles Across All Viewings (Attendances), % of Visitors Who Attended the Artwork At All, % of Persons Attending Who Returned At Least Once to the Artwork, Times of Viewing if a Person Had Viewed the Artwork At All.
No.
Viewing time (first)
Viewing time (total)
Viewing distance (first)
Viewing distance (mean)
Viewing angles (mean) W H
% of visitors attended
% of visitors came back
Mean number of viewings if attended at all
1 29.6 s 36.3 s 1.60 m 1.59 m 42.7
34.7
52.9 45.6 1.33
2 30.0 s 42.2 s 1.57 m 1.56 m 25.8
36.0
67.6 48.4 1.41
3 39.2 s 64.2 s 2.12 m 2.03 m 50.4
41.3
66.7 64.7 1.70
4 41.0 s 67.2 s 2.05 m 2.10 m 51.8
37.7
60.0 63.8 1.66
5 25.7 s 38.5 s 1.66 m 1.55 m 18.8
16.5
49.3 54.9 1.46
6 36.1 s 47.6 s 1.49 m 1.45 m 19.4
26.7
48.0 54.1 1.47
Mean 33.9 s 50.5 s 1.75 m 1.72 m 37.6
33.5
57.4 55.3 1.51
Note.