A TLAS-CONF-2012-058 04 June 2012
ATLAS NOTE
ATLAS-CONF-2012-058
June 3, 2012
Search for gluino-mediated scalar top and bottom quark production in final states with missing transverse energy and at least three b-jets
with the ATLAS Detector.
The ATLAS Collaboration
Abstract
The results of a search for gluino-mediated pair production of the scalar partners of the top and bottom quarks in 4.7 fb
−1of pp collisions at √
s = 7 TeV using the
ATLAS detector at the LHC are reported. A search for scalar top and bottom quarks
is performed in events with large missing transverse momentum and 4 or 6 jets in
the final state of which at least 3 are identified as originating from a b -quark. Gluino
masses up to 1 TeV are excluded, depending on the model considered.
1 Introduction
Supersymmetry (SUSY) [1–9] provides an extension of the Standard Model (SM) which re- solves the hierarchy problem [10–13] by introducing supersymmetric partners of the known bosons and fermions. In the framework of the R-parity conserving minimal supersymmetric extension of the SM (MSSM) [14–18], SUSY particles are produced in pairs and the lightest supersymmetric particle (LSP) is stable, providing a possible candidate for dark matter. In a large variety of models, the LSP is the lightest neutralino ( χ ˜
10). The coloured superpartners of quarks and gluons, the scalar quarks (squarks, q) and gluinos ( ˜ g), if not too heavy, would be ˜ produced in strong interaction processes at the Large Hadron Collider (LHC) and decay via cascades ending with the LSP. The undetected LSP results in missing transverse momentum –whose magnitude is referred to as E
Tmiss– while the rest of the cascade yields final states with multiple jets and possibly leptons. In the MSSM, the scalar partners of the right-handed and left-handed quarks, q ˜
Rand q ˜
L, can mix to form two mass eigenstates q ˜
1and q ˜
2. The mixing ef- fect is proportional to the masses of the SM fermion partners and can therefore be large for the third generation of quarks and leptons. This may lead to scalar bottom (sbottom, ˜b
1) and scalar top (stop, ˜t
1) mass eigenstates being much lighter than the other squarks. As a consequence, ˜b
1and ˜t
1could be produced with relatively large cross sections at the LHC, either directly in pairs, or through g ˜ ˜ g production followed by g ˜ → ˜b
1b or g ˜ → ˜t
1t decays. The latter process is referred to as gluino-mediated production.
This letter extends the search for gluino-mediated ˜b
1and ˜t
1production at ATLAS presented in [19], which used 2.05 fb
−1of data collected in the first half of 2011 at a centre of mass energy of 7 TeV. The present analysis comprises the full 2011 dataset of 4.7 fb
−1and adopts an im- proved selection that requires large E
Tmiss, no reconstructed electron or muon and at least three jets identified as originating from b-quarks (b-jets) in the final state. Results are interpreted in simplified models where sbottoms or stops are the only squarks produced in the gluino decays, leading to final states with 4 b-quarks. Searches in similar scenarios have also been reported by the CMS Collaboration [20, 21].
2 The ATLAS detector
The ATLAS detector [22] consists of inner tracking devices surrounded by a superconducting solenoid, electromagnetic and hadronic calorimeters and a muon spectrometer with a toroidal magnetic field. The inner detector, in combination with the 2 T field from the solenoid, provides precision tracking of charged particles for | η | < 2.5
1. It consists of a silicon pixel detector, a sili- con strip detector and a straw tube tracker that also provides transition radiation measurements for electron identification. The calorimeter system covers the pseudorapidity range |η| < 4.9 . It is composed of sampling calorimeters with either liquid argon (LAr) or scintillating tiles as the active medium. The muon spectrometer has separate trigger and high-precision tracking chambers which provide muon identification and momentum measurement for |η| < 2.7 .
1
The azimuthal angle φ is measured around the beam axis and the polar angle θ is the angle from the beam
axis. The pseudorapidity is defined as η = − ln tan(θ/2). The distance ∆R in the η − φ space is defined as ∆R =
p (∆η)
2+ (∆φ )
2.
3 Monte Carlo simulation
Samples of simulated events are used for the description of the background and to model the SUSY signal. The dominant sources of background come from events with b -quarks in the final state. Monte Carlo (MC) samples of t ¯t, W/Z and diboson events produced in association with light and heavy flavour jets are generated with ALPGEN [23] and the parton distribution func- tion (PDF) set CTEQ6L1 [24]. These samples are generated with different maximum numbers of additional partons at the matrix-element level. Diboson samples are generated with up to three additional partons, t ¯t+jet and Z( → ℓ
+ℓ
−)+jets (ℓ = e,µ ,τ) samples with up to five additional par- tons, and W( → ℓ ν)+jets and Z( → νν)+jet samples with up to six additional partons. Single top ¯ quark production is simulated with MC@NLO [25] using the next-to-leading-order (NLO) PDF set CTEQ6.6 [26]. The fragmentation and hadronisation for the ALPGEN and MC@NLO samples are performed with HERWIG [27, 28], using JIMMY [29] for the underlying event. Samples of t ¯t+W , t ¯t+Z and t ¯t+WW events are generated with MADGRAPH [30] interfaced to PYTHIA [31].
The signal samples are generated using the Herwig++ [32] v2.4.2 MC program. The MC sam- ples are produced using parameters tuned as described in Ref. [33] and are processed through a detector simulation [34] based on GEANT4 [35]. The effect of multiple pp interactions per bunch crossing is also simulated. For the comparison with data, all SM background cross sections are normalised to the results of higher-order calculations when available, using the same values as in Ref. [19].
4 Object reconstruction
Jets are reconstructed from three-dimensional calorimeter energy clusters using the anti-k
tjet algorithm [36, 37] with a radius parameter of 0.4. The measured jet energy is corrected for inhomogeneities and for the non-compensating nature of the calorimeter by using p
T- and η- dependent correction factors, and additional corrections for pile-up are taken into account [38].
Jets are required to have p
T> 20 GeV, and are reconstructed in the range |η | < 4.9 . Events are rejected if there are jets failing the quality criteria described in [38], or if there is any selected jet with |η | < 2 having a ratio between the scalar sum of the transverse momenta of the tracks asso- ciated with the jet divided by the jet p
Tof less than 5%. A neural network based algorithm [39]
is used to identify jets containing a b-hadron decay (b-jets). This uses as inputs the output weights of different algorithms exploiting the impact parameter of the inner detector tracks, the secondary vertex reconstruction and the topology of b - and c -hadron decays inside the jet.
Three operating points are used, corresponding to efficiencies of 60%, 70% and 75% for tagging b-jets in a MC sample of t ¯t events. In all cases the tagging rate is less than 2% for light-quarks and gluon jets, 10% for τ leptons and 25% for c -quark jets. The b -jets are identified within the nominal acceptance of the inner detector ( | η | < 2.5) and are required to have p
T> 30 GeV. To compensate for the discrepancy between the b-tagging efficiency and mistag rates in data and MC, b -tagging scale factors are applied to each jet in the simulations, as described in [39–41].
Electrons are reconstructed from energy clusters in the electromagnetic calorimeter matched to a track in the inner detector. Electron candidates are required to have p
T> 20 GeV and
|η| < 2.47 and must satisfy the “medium” [42] selection criteria based on calorimeter shower
shape, inner-detector track quality, and track-to-calorimeter cluster matching. Muons are iden-
tified using a match between an extrapolated inner detector track and one or more track seg-
ments in the muon spectrometer, and are required to have p
T> 10 GeV and |η| < 2.4 . Events
containing electrons and muons satisfying these criteria are vetoed in the signal regions as dis-
cussed below.
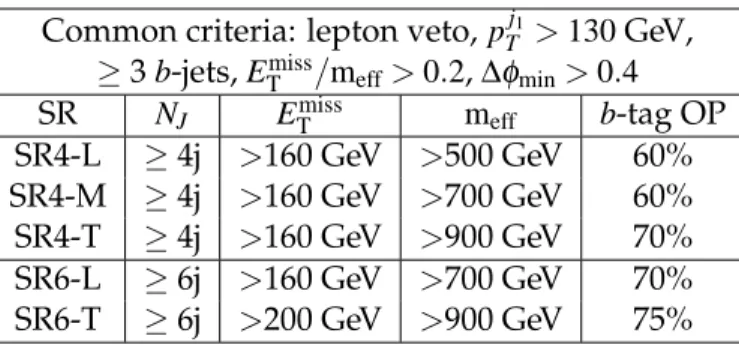
Common criteria: lepton veto, p
Tj1> 130 GeV,
≥ 3 b -jets, E
Tmiss/m
eff> 0.2 , ∆φ
min> 0.4 SR N
JE
Tmissm
effb -tag OP SR4-L ≥ 4j >160 GeV >500 GeV 60%
SR4-M ≥ 4j > 160 GeV > 700 GeV 60%
SR4-T ≥ 4j >160 GeV >900 GeV 70%
SR6-L ≥ 6j >160 GeV >700 GeV 70%
SR6-T ≥ 6j >200 GeV >900 GeV 75%
Table 1: Definition of the five signal regions based on the number of jets (N
J), the E
Tmissand the m
effrequirements and the b -tagging operation point (OP).
To resolve overlaps between reconstructed jets and leptons, jets within a distance of ∆R = 0.2 of an electron candidate are rejected. Furthermore, any lepton candidate with a distance
∆R < 0.4 to the closest remaining jet is discarded.
The measurement of the missing transverse momentum two-dimensional vector p
T(and its magnitude E
Tmiss) is based on the transverse momenta of all remaining jets with | η | < 4.5, all electron and muon candidates and all calorimeter clusters not associated to such objects.
5 Event selection
Events are selected using triggers requiring one high p
Tjet and E
Tmiss. Different trigger thresh- olds were used to cope with the changing luminosity. These triggers are fully efficient for this analysis which requires one jet with p
T> 130 GeV and E
Tmiss> 160 GeV at the offline recon- struction level. Events must pass basic quality criteria to reject detector noise and non-collision backgrounds. They are also required to have a reconstructed primary vertex associated with five or more tracks with p
T> 0.4 GeV; when more than one such vertex is found, the vertex with the largest summed p
2Tof the associated tracks is chosen as the hard interaction vertex.
Events are required to have at least three b -tagged jets and two jet-multiplicity regions ( N
J≥ 4 and N
J≥ 6) are considered by selecting jets with | η | < 2.8 and p
T> 50 GeV.
Two variables are calculated from the reconstructed objects to further select the events : m
effand ∆φ
min. The effective mass m
effis defined as the scalar sum of the E
Tmissand the p
Tof all selected jets in a given jet-multiplicity region. The ∆φ
minis defined as the minimum azimuthal separation between the selected jets and the missing transverse momentum direction. Placing requirements on ∆φ
min> 0.4 and E
Tmiss/m
effreduces the amount of multi-jet background, where E
Tmissresults from mis-reconstructed jets or from neutrinos emitted close to the direction of the jet axis. Events are required to have ∆φ
min> 0.4 and E
Tmiss/m
eff> 0.2.
Two sets of signal regions are defined which yield good signal sensitivity for the various models and parameter values studied here. They are characterised by having at least four (SR4) or six (SR6) jet candidates and are further classified as loose (L), medium (M) or tight (T) depending on the E
Tmissand m
effthresholds and on the b-tagging operation point. The require- ments that characterise each signal region are summarised in Table 1.
6 Background estimate
The main source of reducible background is the production of t ¯t events in association with
additional jets followed by the leptonic decay of one W -boson, where the lepton is not recon-
structed or is mis-identified as a jet (mainly through the hadronic decays of a τ lepton). This background is estimated by normalising the MC event yield in the signal region to the ex- trapolated event yield observed in a t ¯t-dominated control region. Systematic uncertainties that are correlated between the control and the signal regions largely cancel out in this procedure.
Additional sources of reducible background are single top, t ¯t + W / Z and W / Z +heavy-flavour jets. Their contributions are taken from MC simulation and account for 10% to 20% of the total background depending on the signal region. The irreducible background t ¯t+b¯b is also taken from MC simulation and accounts for about 10% in all signal regions. The contribution from multi-jet events is estimated with a data-driven method, based on a jet response smearing technique [43], and is found to account for less than 5% of the total background in all signal regions.
Four control regions where t ¯t accounts for more than 80% of the total yield are defined by applying the same jet requirements as in the signal regions, but requesting exactly two b-jets instead of three or more. The requirements m
eff> 500 GeV and E
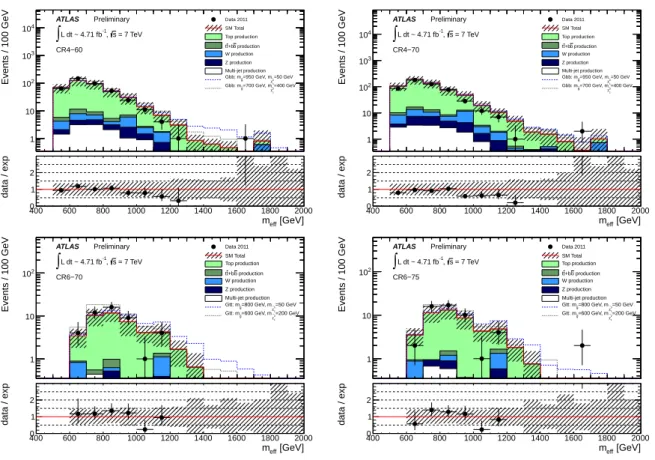
Tmiss> 160 GeV are applied to all control regions to make them kinematically similar to the signal regions, while minimising the contamination from possible SUSY signal events. The definition of the control regions is summarised in Table 2. The numbers of expected SM events in the four control regions, as predicted by the jet smearing technique for multi-jet events and by MC simulation for other processes, are compared to those observed in data in Table 3 and they agree within experimental errors. The distributions of m
effin the four CRs for both data and MC are shown in Fig. 1.
For each pair of control and signal regions, the extrapolation of the measured t ¯t+jets abun- dance in each control region to the signal region is performed with a fit based on the profile likelihood method [46]. The free parameter of the likelihood fit is the t ¯t overall normaliza- tion scale, while the contributions from subdominant background processes are fixed at the expected value. Systematic uncertainties are treated as nuisance parameters constrained with a Gaussian function and correlations are taken into account where appropriate. The likelihood function is built as the product of a Poisson probability density function, describing the ob- served and expected number of events in the control and signal regions, and the constraints on the nuisance parameters.
The reliability of the MC extrapolation of the t ¯t background to larger b-jet multiplicities has been checked in validation regions defined with kinematic cuts similar to those used in the control and signal regions, except that exactly one isolated electron or muon is required. The transverse mass of the lepton and the E
Tmissis required to be lower than 100 GeV in all validation regions to minimise the possible contamination from stop production. The extrapolated event yield in the validation regions with at least 3 b -jets from the validation regions with exactly 2 b-jets is found to be consistent with the number of observed events for all b-tagging operating points.
The background predictions have been further validated using a data-driven method that simultaneously estimates all SM background contributions with at least one misidentified b-jet.
This method consists of predicting the number of jets originating from b-quarks in each event
by solving a system of equations based on the number of b -tagged and non b -tagged jets in the
event, along with the b-tagging and mistag rate efficiencies. Consistent background predictions
with respect to the likelihood fit have been found in all signal regions.
[GeV]
meff
Events / 100 GeV
1 10 102
103
104
Data 2011 SM Total Top production
b production +b t t W production Z production Multi-jet production
=50 GeV 1 χ0
=950 GeV, m∼ g~ Gbb: m
=400 GeV 1 χ0
=700 GeV, m∼ g~ Gbb: m
ATLAS Preliminary = 7 TeV s
-1, L dt ~ 4.71 fb
∫
CR4−60
[GeV]
meff 400 600 800 1000 1200 1400 1600 1800 2000
data / exp
0 1
2 meff [GeV]
Events / 100 GeV
1 10 102
103
104
Data 2011 SM Total Top production
b production +b t t W production Z production Multi-jet production
=50 GeV 1 χ∼0
=950 GeV, m g~ Gbb: m
=400 GeV 1 χ∼0
=700 GeV, m g~ Gbb: m
ATLAS Preliminary = 7 TeV s
-1, L dt ~ 4.71 fb
∫
CR4−70
[GeV]
meff 400 600 800 1000 1200 1400 1600 1800 2000
data / exp
0 1 2
[GeV]
meff
Events / 100 GeV
1 10 102
Data 2011 SM Total Top production
b production +b t t W production Z production Multi-jet production
=50 GeV
1 χ∼0
=800 GeV, m
~g Gtt: m
=200 GeV
1 χ∼0
=600 GeV, m
~g Gtt: m ATLAS Preliminary
= 7 TeV s
-1, L dt ~ 4.71 fb
∫
CR6−70
[GeV]
meff 400 600 800 1000 1200 1400 1600 1800 2000
data / exp
0 1
2 meff [GeV]
Events / 100 GeV
1 10 102
Data 2011 SM Total Top production
b production +b t t W production Z production Multi-jet production
=50 GeV
1 χ0
=800 GeV, m∼ g~ Gtt: m
=200 GeV
1 χ0
=600 GeV, m∼ g~ Gtt: m ATLAS Preliminary
= 7 TeV s
-1, L dt ~ 4.71 fb
∫
CR6−75
[GeV]
meff 400 600 800 1000 1200 1400 1600 1800 2000
data / exp
0 1 2
Figure 1: Distribution of the effective mass in the four control regions. The hatched band shows the systematic uncertainty, which includes both experimental uncertainties (among which JES and b-tagging uncertainties are dominant) and theoretical uncertainties on the background nor- malisation and shape. The top production histogram includes the contribution from t ¯t +jets and single top production. The bottom plot in each figure shows the ratio between the observed distribution and that predicted for the SM background. Two signal points (with small and large mass splitting between the gluino and the LSP) for the Gbb and Gtt models described in the text are overlaid.
Common criteria: lepton veto, p
Tj1> 130 GeV,
= 2 b-jets, E
Tmiss/m
eff> 0.2, ∆φ
min> 0.4, E
Tmiss> 160 GeV, m
eff> 500 GeV
CR N
Jb -tag OP corresponding SR CR4-60 ≥ 4j 60 % SR4-L, SR4-M
CR4-70 ≥ 4j 70% SR4-T
CR6-70 ≥ 6j 70% SR6-L
CR6-75 ≥ 6j 75% SR6-T
Table 2: Definition of the four control regions used to estimate the t ¯t background.
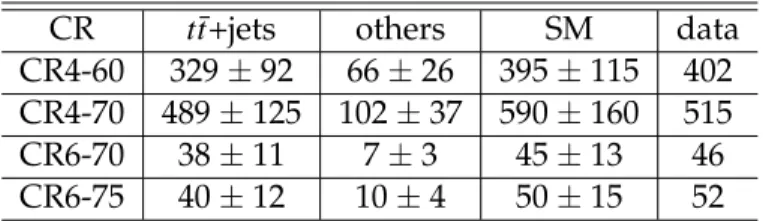
CR t ¯t+jets others SM data CR4-60 329 ± 92 66 ± 26 395 ± 115 402 CR4-70 489 ± 125 102 ± 37 590 ± 160 515
CR6-70 38 ± 11 7 ± 3 45 ± 13 46
CR6-75 40 ± 12 10 ± 4 50 ± 15 52
Table 3: Expected numbers of SM events and observed data events in the four t ¯t control re- gions. The contribution from t ¯t +jets events is taken directly from MC simulation, before fitting.
The column “others” includes the contributions from single top, t ¯t+b¯b, t ¯t+W /Z and W /Z+jets processes, estimated from MC simulation, and the contribution from multi-jet events which is estimated with the jet smearing technique and accounts for 20% of these events. The uncertain- ties include statistical and systematic uncertainties.
7 Systematic uncertainties
The dominant detector-related systematic effects are due to the jet energy scale (JES) and reso- lution (JER) uncertainties, and the uncertainty on the b -tagging efficiency and mistag rate. The JES uncertainty has been derived from a combination of simulations, test beam data and in-situ measurements [38] and includes a pile-up uncertainty. Uncertainties on the JER are obtained with an in-situ measurement of the jet response asymmetry in di-jet events [44]. These uncer- tainties on jets are propagated to the E
Tmissmeasurement, and additional uncertainties on E
Tmissarising from energy deposits not associated with any reconstructed objects are also included.
The b -tagging uncertainty is evaluated by varying the η, p
Tand flavour dependent scale fac- tors applied to each jet in the simulation within a range that reflects the systematic uncertainty on the measured tagging efficiency and mistag rates. The systematic uncertainties in the mod- eling of the t ¯t +jets background are assessed as follows: the uncertainty due to the choice of the MC generator is estimated by comparing the LO ALPGEN generator to the NLO MC@NLO generator; the uncertainty due to the factorisation and matching scale ambiguities in ALPGEN are estimated by independently varying their nominal settings by factors of one half and two;
the uncertainty due to the finite number of additional partons at the matrix element level is assessed by comparing inclusive ALPGEN samples generated with up to three and up to five extra partons. Finally the PDF uncertainties are estimated using the MSTW2008 NNLO PDF set.
Uncertainties of 100% are assumed on the multi-jet prediction and on the cross-section of t ¯t and W /Z production in association with a b¯b pair. For t ¯t production in association with W/Z, an uncertainty of approximatively 70% has been derived from the variations of the factorization and renormalization scales and from the PDF uncertainties [45].
8 Results and interpretation
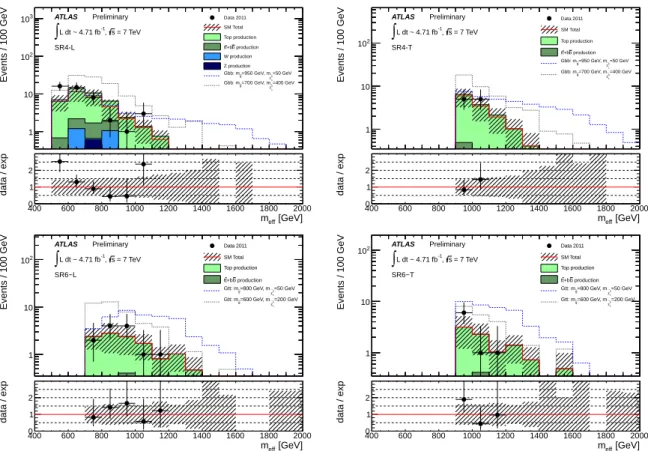
Figure 2 shows the measured m
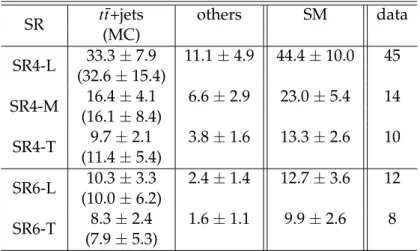
effdistributions and the SM background prediction in each of the signal regions. Also shown are the impact of two benchmark signal models described be- low. The results of the likelihood fits and the numbers of observed events in each signal region are summarised in Table 4. The MC prediction for t ¯t events is also shown in parentheses. The uncertainty quoted on the SM prediction includes all statistical and systematic uncertainties.
The number of observed events is found to be consistent with SM expectations in all signal
regions. Model-independent 95% confidence-level (CL) upper limits on the number of signal
events are derived, using the CL
sprescription [46], by adding an additional free parameter
[GeV]
meff
Events / 100 GeV
1 10 102
103 Data 2011
SM Total Top production
production b +b t t W production Z production
=50 GeV 1 χ0
=950 GeV, m∼ g~ Gbb: m
=400 GeV 1 χ0
=700 GeV, m∼ g~ Gbb: m
ATLAS Preliminary = 7 TeV s
-1, L dt ~ 4.71 fb
∫
SR4-L
[GeV]
meff 400 600 800 1000 1200 1400 1600 1800 2000
data / exp
0 1
2 meff [GeV]
Events / 100 GeV
1 10 102
Data 2011 SM Total Top production
production b +b t t
=50 GeV 1 χ∼0
=950 GeV, m g~ Gbb: m
=400 GeV 1 χ∼0
=700 GeV, m g~ Gbb: m
ATLAS Preliminary = 7 TeV s
-1, L dt ~ 4.71 fb
∫
SR4-T
[GeV]
meff 400 600 800 1000 1200 1400 1600 1800 2000
data / exp
0 1 2
[GeV]
meff
Events / 100 GeV
1 10 102
Data 2011 SM Total Top production
b production +b t t
=50 GeV
1 χ∼0
=800 GeV, m g~ Gtt: m
=200 GeV
1 χ∼0
=600 GeV, m g~ Gtt: m ATLAS Preliminary
= 7 TeV , s L dt ~ 4.71 fb-1
∫
SR6−L
[GeV]
meff 400 600 800 1000 1200 1400 1600 1800 2000
data / exp
0 1
2 meff [GeV]
Events / 100 GeV
1 10
102 Data 2011
SM Total Top production
b production +b t t
=50 GeV
1 χ0
=800 GeV, m∼ g~ Gtt: m
=200 GeV
1 χ0
=600 GeV, m∼ g~ Gtt: m ATLAS Preliminary
= 7 TeV , s L dt ~ 4.71 fb-1
∫
SR6−T
[GeV]
meff 400 600 800 1000 1200 1400 1600 1800 2000
data / exp
0 1 2
Figure 2: Distribution of m
efffor SR4-L and SR4-T (top) and SR6-L and SR6-T (bottom). The
hatched band shows the systematic uncertainty, which includes both experimental uncertain-
ties (among which JES and b-tagging uncertainties are dominant) and theoretical uncertainties
on the background normalisation and shape. The top production histogram includes the con-
tribution from t ¯t +jets and single top production. The bottom plot in each figure shows the
ratio between the observed distribution and that predicted for the SM background. Two signal
points (with small and large mass splitting between the gluino and the LSP) for the Gbb and
Gtt models described in the text are overlaid.
SR t ¯t+jets others SM data (MC)
SR4-L 33.3 ± 7.9 11.1 ± 4.9 44.4 ± 10.0 45 (32.6 ± 15.4)
SR4-M 16.4 ± 4.1 6.6 ± 2.9 23.0 ± 5.4 14 (16.1 ± 8.4)
SR4-T 9.7 ± 2.1 3.8 ± 1.6 13.3 ± 2.6 10 (11.4 ± 5.4)
SR6-L 10.3 ± 3.3 2.4 ± 1.4 12.7 ± 3.6 12 (10.0 ± 6.2)
SR6-T 8.3 ± 2.4 1.6 ± 1.1 9.9 ± 2.6 8 (7.9 ± 5.3)
Table 4: Comparison between the results of the likelihood fits and the numbers of observed events in the 5 signal regions. In parentheses is quoted the t ¯t event yield predicted by the sim- ulation. The column “others” includes the contributions from single top, t ¯t + b¯b, t ¯t + W /Z, W /Z+jets and multi-jet processes. Multi-jet events contribute to less than 5% of the total back- ground. The uncertainties include the statistical and systematic uncertainties.
for the non-SM signal strength, constrained to be non-negative, in the likelihood fits. This additional parameter ensures a proper treatment of the expected signal contamination in the control regions when the results are interpreted in the framework of SUSY models. Upper limits on the visible cross section (defined as cross section times kinematic acceptance times experimental efficiency) for non-SM contributions are also derived for each signal region. The results are given in Table 5.
Obs (exp) 95% CL upper limit SR N events σ
vis(fb) SR4-L 23.8 (23.4) 5.1 (5.0) SR4-M 8.6 (12.8) 1.8 (2.7) SR4-T 7.1 (9.2) 1.5 (2.0) SR6-L 9.6 (10.1) 2.0 (2.1) SR6-T 7.1 (8.3) 1.5 (1.8)
Table 5: Observed (expected) 95% CL upper limits on the non-SM contributions to all signal regions. Limits are given on numbers of events and in terms of visible cross sections defined by cross section times kinematic acceptance times experimental efficiency. Systematic uncer- tainties on the SM background estimation are included in the limits.
These data have been used to derive limits in the parameter space of the following SUSY models:
Gluino-sbottom model: MSSM scenarios where the ˜b
1is the lightest squark, all other squarks are heavier than the gluino, and m
g˜> m
˜b1
> m
χ˜01
, such that the branching ratio (BR) for
˜
g → ˜b
1b decays is 100%. Sbottoms are produced via g ˜ ˜ g or by direct pair production ˜b
1˜b
1and are assumed to decay exclusively via ˜b
1→ b ˜ χ
10, where m
χ˜01
is set to 60 GeV. Exclusion limits are presented in the ( m
g˜,m
˜b1
) plane.
Gbb model: Simplified scenarios, where ˜b
1is the lightest squark but m
g˜< m
˜b. Pair produc-
[GeV]
g~
m 200 300 400 500 600 700 800 900 1000 1100 1200 [GeV] 1b~m
200 400 600 800 1000 1200
2.05 fb-1
b1
~ b1
ATLAS ~ 2.65 fb-1
b1
~ b1
CDF ~ 5.2 fb-1
b1
~ b1
D0 ~
b 2.5 fb-1
b1
→~ , g~ g~ CDF
0
χ∼1
→ b+
b1
production, ~ b1
-~ b1
+ ~ g~ - g~
) g~ )>>m(
q1,2
) = 60 GeV, m(~
0
χ∼1
m(
b forbidden
~b g→
~
= 7 TeV s
-1, = 4.71 fb Lint
3 b-jets channel All limits at 95% CL
ATLASPreliminary
σexp
±1 Expected limit CLs
Theory
σSUSY
± 1 Observed limit CLs
0-lepton + b-jets 2.0 fb-1
[GeV]
g~
m
300 400 500 600 700 800 900 1000
[GeV] 1t~m
200 300 400 500 600 700 800 900
±
χ∼1
→ b+
t1
production, ~ t1
-~ t1
+ ~ g~ - g~
) g~ ) >> m(
q1,2
) = 60 GeV, m( ~
0
χ∼1
m(
t forbidden t1
~ g→
~
= 7 TeV s
-1, = 4.71 fb Lint
3 b-jets channel
All limits at 95% CL
ATLASPreliminary σexp
± 1 Expected limit CLs
Theory
σSUSY
± 1 Observed limit CLs
1 lepton + b-jets 2.0 fb-1
SS dilepton, 2.0 fb-1
[GeV]
g~
m 200 300 400 500 600 700 800 900 1000 1100 1200 [GeV]0 1χ∼m
0 200 400 600 800 1000 1200
forbidden
0
χ1
+∼ bb g→
~
) g~ ) >> m(
~q
0, m(
χ∼1
+ b
→ b g~ production, g~ -
g~ Lint = 4.71 fb-1, s = 7 TeV
3 b-jets channel All limits at 95% CL
ATLASPreliminary σexp
±1 Expected limit CLs
Theory
σSUSY
± 1 Observed limit CLs
0-lepton + b-jets, 2.0 fb-1
[GeV]
g~
m
400 500 600 700 800 900 1000 1100
[GeV]0 1χ∼m
0 100 200 300 400 500 600 700 800
forbidden
0
χ1
+∼ tt g→
~
) g~ ) >> m(
q~
0, m(
χ∼1
+ t
→ t g~ production, g~ -
g~ Lint = 4.71 fb-1, s = 7 TeV
3 b-jets channel All limits at 95% CL
ATLASPreliminary σexp
± 1 Expected limit CLs
Theory
σSUSY
± 1 Observed limit CLs
SS dilepton, 2.0 fb-1
1-lepton plus bjet, 2.0 fb-1
Multi-jets, 4.7 fb-1
σexp
± 1 Expected limit CLs
Theory
σSUSY
± 1 Observed limit CLs
SS dilepton, 2.0 fb-1
1-lepton plus bjet, 2.0 fb-1
Multi-jets, 4.7 fb-1
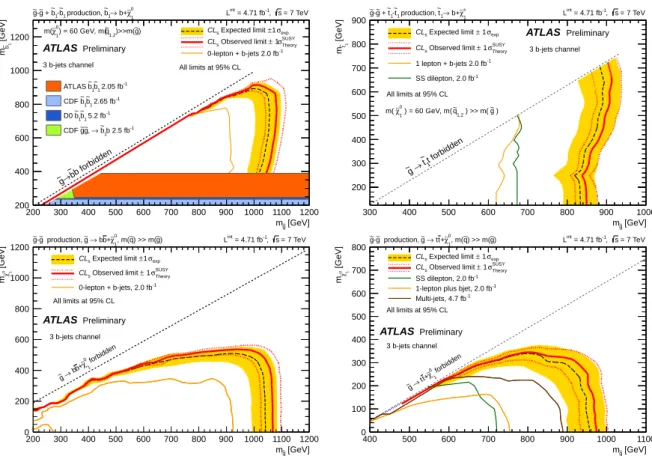
Figure 3: Exclusion limits in the ( m
g˜,m
˜b1
) plane for the gluino-sbottom model (top left), in the (m
g˜, m
˜t1
) plane for the gluino-stop model (top right) and in the (m
g˜,m
χ˜01
) plane for the Gbb (bot- tom left) and Gtt (bottom right) models. The dashed black and solid red lines show the 95%
CL expected and observed limits respectively, including all uncertainties except the theoreti- cal signal cross section uncertainty (PDF and scales). The yellow band around the expected limit shows the ± 1 σ result. The ± 1 σ
TheorySUSYlines around the observed limit represent the result produced when moving the signal cross section by ± 1σ (as defined by the PDF and scale uncer- tainties). Also shown for reference the previous CDF [47, 48], D0 [49] and ATLAS [19, 45, 50, 51]
analyses. These limits include the theoretical uncertainties on the signal.
tion of gluinos is the only process taken into account since the mass of all other sparticles apart from the χ ˜
10is set above the TeV scale. A three-body decay via an off-shell sbottom is assumed for the gluino, yielding a 100% BR for the decay g ˜ → b¯b ˜ χ
10. Exclusion limits are presented in the (m
g˜, m
χ˜01
) plane.
Gluino-stop model: MSSM scenarios where the ˜t
1is the lightest squark, all other squarks are heavier than the gluino, and m
g˜> m
˜t1
+ m
t, such that the branching ratio for g ˜ → ˜t
1t decays is 100%. Stops are produced via g ˜ ˜ g and ˜t
1˜t
1and are assumed to decay exclusively via ˜t
1→ b ˜ χ
1±. The neutralino mass is set to 60 GeV, the chargino mass to 120 GeV and the latter is assumed to decay through a virtual W boson. Exclusion limits are presented in the ( m
g˜,m
˜t1
) plane.
Gtt model: Simplified scenarios, where ˜t
1is the lightest squark but m
g˜< m
˜t1
. Pair produc- tion of gluinos is the only process taken into account since the mass of all other sparticles apart from the χ ˜
10is set above the TeV scale. A three-body decay via off-shell stop is assumed for the gluino, yielding a 100% BR for the decay g ˜ → t ¯t ˜ χ
10. Exclusion limits are presented in the ( m
g˜, m
χ˜01
) plane.
The SR4 regions are mostly sensitive to the SUSY models where sbottom production dom- inates, whilst the SR6 regions are employed to set exclusion limits in models characterised by on-shell or off-shell stop production, where top-enriched final states are expected. The sig- nal region with the best expected sensitivity at each point in the parameter space is used to derive the limits at 95% CL. Signal cross sections are calculated to next-to-leading order in the strong coupling constant, including the resummation of soft gluon emission at next-to- leading-logarithmic accuracy (NLO+NLL) [52–56]. An envelope of cross section predictions,
± 1σ
TheorySUSY, is defined using the 68% CL ranges of CTEQ6.6 [57] (including the α
Suncertainty) and MSTW2008 NNLO [58] PDF sets, together with independent variations of the factorisation and renormalisation scales by factors of two or one half. The nominal cross section value is taken to be the midpoint of the envelope and the uncertainty assigned is half the full width of the envelope, closely following the PDF4LHC recommendations [59]. All detector-related systematic uncertainties are treated as fully correlated between signal and backgrounds. In the Gbb scenario, the impact of the initial state radiation (ISR) is expected to be large in the region with low m
g˜− m
χ˜01
due to the small signal acceptance. Therefore, an additional uncertainty on the modeling of the ISR, derived as a function of (m
g˜− m
χ˜01
), is included in the ± 1σ
TheorySUSYband.
The expected and observed 95% CL exclusion limits for the four models considered above are shown in Figure 3. In the context of the gluino-sbottom model, a m
g˜below 1000 GeV is ex- cluded for sbottom masses up to about 870 GeV in the most conservative hypothesis, − 1 σ
TheorySUSY. This extends by approximatively 100 GeV the limits derived in the same scenario by the pre- vious ATLAS analysis performed with 2 fb
−1[19] and is complementary to the ATLAS search for direct sbottom pair production, also carried out with 2 fb
−1[50]. The exclusion is less strin- gent in the region with low m
g˜− m
˜b1
, where softer jets are expected. Due to the kinematic cuts applied, the limits depend on the neutralino mass assumption for low mass splitting be- tween the sbottom and the neutralino as shown for the Gbb model where gluino masses below 1020 GeV are excluded for neutralino masses up to about 400 GeV, improving the previous ATLAS limits [19] by approximatively 100 GeV. In the framework of the gluino-stop model, gluino masses below 820 GeV are excluded for stop masses up to 640 GeV, extending the previ- ous ATLAS limits [19, 45] by approximatively 150 GeV. In the Gtt model, gluino masses below 940 GeV are excluded for m
χ˜01