Characterization of Proteins Homologous to Nucleotide Sugar Transporters in Arabidopsis thaliana
I n a u g u r a l – D i s s e r t a t i o n
zur
Erlangung des Doktorgrades
der Mathematisch-Naturwissenschaftlichen Fakultät der Universität zu Köln
vorgelegt von
Marcela Santaella-Tenorio aus Bogotá, Kolumbien
2006
Die dieser Dissertation zugrundeliegenden experimentellen Arbeiten wurden in der Zeit von Oktober 2002 bis Mai 2006 am Botanischen Institut der Universität zu Köln anfertigt.
Berichterstatter: Prof. Dr. Ulf-Ingo Flügge
Prof. Dr. Reinhard Krämer
Tag der mündlichen Prüfung: 11.Juli 2006
“¿Dices que nada se crea?
No te importe. Con el barro de la tierra haz una copa para dar de beber a tu hermano.
¿Dices que nada se crea?
Alfarero a tus cacharros.
Haz tu copa y no te importe que no puedas hacer barro.”
Antonio Machado.
Index
Page
1. Introduction 1
2.1 Materials 8
2.1.1 Vectors 8
2.1.2 Bacteria and Yeast strains
82.1.3 Plant Material
92.1.4 Plant Procedures
92.1.4.1 Arabidopsis seed sterilization
92.1.4.2 Pollen staining
102.2 Molecular Biology Techniques 10
2.2.1 Gateway
TMcloning 10
2.2.2 E. coli transformation
112.2.2.1 Preparation of E. coli competent cells for heat-shock
transformation 11
2.2.2.2 E. coli heat-shock transformation 12 2.2.3 A. tumefaciens transformation
122.2.3.1 Preparation of A. tumefaciens competent cells for electro-
transformation 12
2.2.3.2 Electrotransformation of A. tumefaciens 13
2.2.4 S. cerevisiae transformation
132.2.5 Isolation and transformation of tobacco protoplasts 14 2.2.6 N. benthamiana leaf epidermal cell transformation 17 2.2.7 Arabidopsis stable transformation
182.2.8 Reporter protein detection in planta 18
2.2.8.1 GUS staining
182.2.8.2 GFP visualization
192.2.9 DNA extraction
192.2.9.1 E. coli plasmid DNA isolation
192.2.9.2 Arabidopsis DNA isolation
212.2.10 Genomic DNA Southern blotting
232.2.11 Plant RNA extraction 25 2.2.11.1 Analysis of RNA quality
262.2.11.2 Synthesis of first strand cDNA 26
2.2.12 Ploymerase Chain Reaction (PCR) 27
2.2.12.1 High-fidelity PCR for cloning
272.2.12.2 Colony PCR
282.2.12.3 Plant touch-and-go PCR
282.2.13 Sequencing
292.3 Protein Techniques 29
2.3.1 Protein expression in the yeast heterologous system 29 2.3.1.1 Yeast membrane extraction
292.3.1.2 SDS-Polyacrylamide protein gels (SDS-PAGE) 30 2.3.1.3 Protein visualization using Coomassie-brilliant blue stain 31 2.3.1.4 Protein visualization using silver staining
322.3.1.5 Transfer of proteins to PVDF membranes (western blot) 33 2.3.1.6 Immune-visualization of recombinant proteins
332.3.2 Transport activity measurements
352.3.2.1 Purification of phosphatidylcholine for liposome preparation 35 2.3.2.2 Preparation of liposomes
352.3.2.3 Membrane proteins solubilization and preparation of proteo-
liposomes 35
2.3.2.4 Purification of proteoliposomes through PD-10 gel filtration
columns 36
2.3.2.5 Protein transport activity measurements in proteoliposomes 37 2.3.2.5.1 Assembly of the anion exchange columns 37 2.3.2.5.2 Reconstitution of anion exchange resin 37 2.3.2.6 Isolation of proteins using Ni
2+-nitrilotriacetic acid (Ni-NTA)
agarose beads
382.3.2.6.1 Ni-NTA agarose beads equilibration 38
2.3.2.6.2 Membrane pellets solubilization and protein-Ni-NTA binding 38
2.3.2.6.3 Isolation of His-tag-bound proteins from the Ni-NTA resin
392.3.2.7 Isolation of Golgi-enriched microsomes from yeast cells 39
3. Results 41 3.1 Description of the KV/A/G subfamily
413.1.1 Molecular and protein characterization of the KV/A/G subfamily
using in silico approaches 41
3.1.2 in silico expression of KVAG genes
453.2 Expression of KVAG genes in planta 46
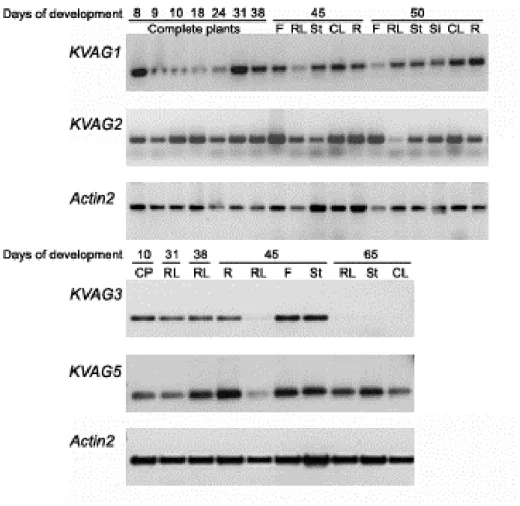
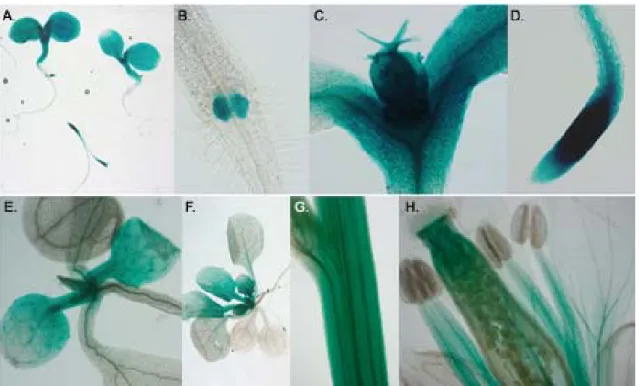
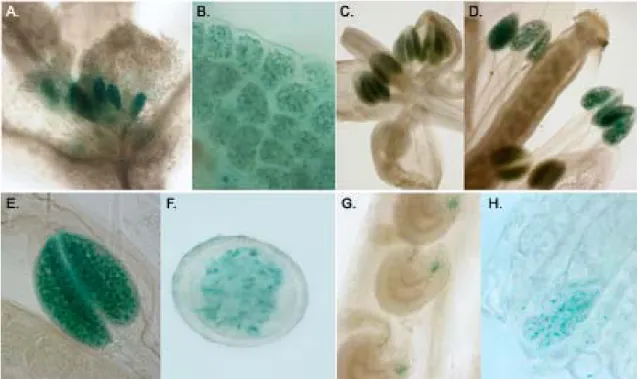
3.2.1 Expression analysis of KVAG genes by semi-quantitative RT-PCR 47 3.2.2 Promoter analysis of KVAG1 and KVAG2 genes
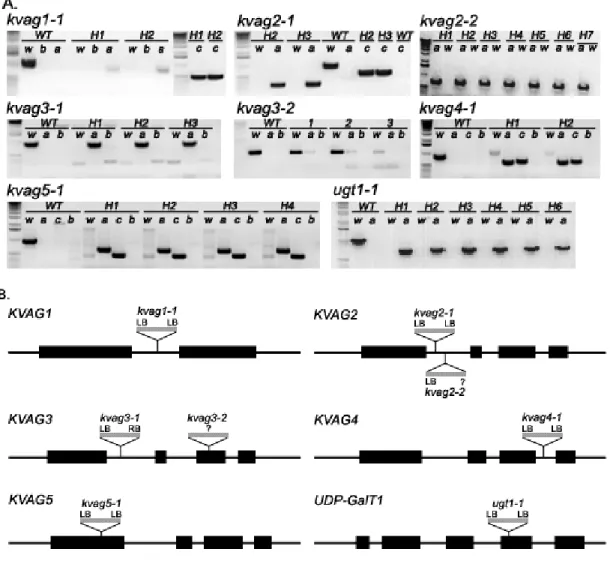
483.3 Analysis of KVAG T-DNA insertion lines
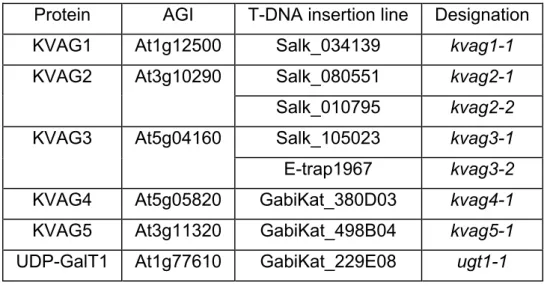
513.3.1 Identification of homozygous T-DNA insertion plants
513.3.2 Verification of the gene knock-out by RT-PCR 54 3.3.3 Determination of the number of T-DNA insertions by Southern blots 56 3.3.4 Generation and verification of kvag1-1 x kvag2-1 double knock-out
plants
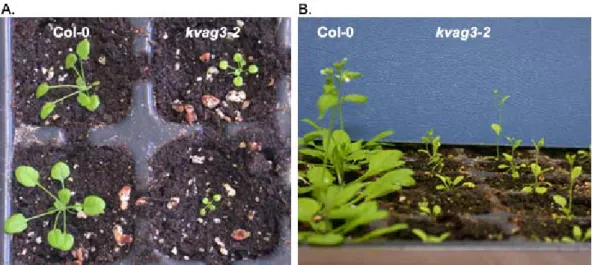
573.3.5 Phenotypical characterization of KVAG knock-out lines 59 3.3.5.1 Analysis of lipid composition of kvag1-1 and kvag2-1 plants 60 3.3.5.2 Analysis of kvag1-1 and kvag2-1 plants on a phosphate deficient
background: crosses with pho1.2 62
3.3.5.3 Analysis of growth properties of single kvag1-1 and kvag2-1
mutants under phosphate limiting conditions 65 3.3.5.4 Analysis of KVAG1 and KVAG2 gene expression under phos-
phate limiting conditions by RT-PCR
663.4 Intracellular localization of KVAG proteins: expression of KVAG::GFP
fusions in planta 69
3.5 Expression of KVAG proteins in a heterologous system and measure-
ments of transport activity
753.5.1 Analysis of KVAG heterologous protein expression 76 3.5.2 Measurements of transport activity of the heterologously expressed
KVAG proteins
783.5.2.1 Protein solubilization from the yeast membrane fraction 78 3.5.2.2 Measurements of transport activity using whole yeast membrane
proteins reconstituted into liposomes
793.5.2.3 Measurements of transport activity using purified KVAG2 protein
reconstituted into liposomes 84
3.5.2.4 Measurements of transport activity using yeast Golgi vesicles en-
riched with KVAG proteins
854. Discussion 89
5. Conclusion 97
6. Abbreviations 99
7. References
1028. Appendix
1148.1 Antibiotics 114
8.2 Bacterial growth media 114
8.3 Yeast growth media 115
8.4 Plant growth media 116
8.5 List of primers 118
1. Introduction
Many secondary active transporter proteins belong to the Drug and Metabolite transporters superfamily. This diverse cluster that includes prokaryotic and eukaryotic proteins known to mediate efflux of drugs, export of nutrients and metabolites, nutrient uptake, and exchange of metabolites across intraorganellar membranes (Jack et al., 2001). Fourteen families of transporters are differentiated within this superfamily. Six families contain prokaryotic proteins and just a few of them are fully characterized as transporters of cationic drugs, metabolites and nutrients. The other eight families contain exclusively eukaryotic members, some of them known as noduline-like proteins, purine/pyrimidine permeases, phosphate transporters of the inner membrane of plastids (pPT), and nucleotide sugars transporters (NST) (reviewed in Jack et al., 2001).
The eukaryotic proteins of the Drug and Metabolite transporter superfamily generally contain 8-10 transmembrane domains (TMDs). These proteins supposedly originated from gene duplication of bacterial proteins with 4 or 5 TMDs (Jack et al., 2001). In addition, the members of the NST and the pPT families share remarkable sequence and structural similarities and were thefore recently classified as a single family, the NST/pPT family (Ward, 2001; Knappe et al., 2003a). The size of the NST/pPT proteins ranges from 320-340 amino acids and they are thought to assemble in homodimers for proper function. Transport occurs in an antiport manner, exchanging substrates in a strict 1:1 ratio (Capasso and Hirschberg, 1984; Wagner et al., 1989; Gao and Dean, 2000). Despite their similitude, the NST and pPT proteins are specific in their localization and the substrates they transport.
The well characterized pPTs are located in the inner-membrane of plastids and
subdivided into four groups based on their function and substrate affinity. The
triose phosphate/phosphate transporter (TPT), the first pPT characterized at the
molecular level (Flügge et al., 1989), mediates the excretion of photoassimilates
like triose phosphate and 3-phosphoglycerate from chloroplasts (Fliege et al.,
1978). This protein exports the carbon fixed in chloroplasts during the day to the
cytosol, where it is used for the synthesis of sucrose and other metabolites
(Flügge, 1999; Flügge et al., 2003). The second group of phosphoenolpyruvate/phosphate transporters (PPT) imports C3 compounds phosphorylated at the second carbon, i.e. phosphoenolpyruvate and 2- phosphoglycerate, from the cytosol into plastids. In plastids the phosphoenolpyruvate is needed for the synthesis of fatty acids and secondary metabolites of the shikimic acid pathway (Fischer et al., 1997). This was confirmed in Arabidopsis ppt1 knock-out plants that are unable to produce anthocyanins (Streatfield et al., 1999). Uptake of C3, C5 or C6-phosphorylated compounds, used by plastids upon high demand of substrates and in heterotrophic tissues (e.g.
for the synthesis of starch, fatty acids and the oxidative pentose phosphate pathway), is mediated by the third and fourth group of pPT, the glucose 6- phosphate/phosphate transporters (GPT, Kammerer et al., 1998; Niewiadomsky et al., 2005) and the xylulose 5-phosphate/phosphate transporter (XPT, Eicks et al., 2002). Complete absence of GPT1, the predominant functional GPT in Arabidopsis, generates unviable plants due to its critical role in embryo sac development and pollen maturation (Niewiadomsky et al., 2005).
NSTs, however, are localized in the membranes of the endoplasmic reticulum (ER) or the Golgi apparatus. They mediate the transport of nucleotide sugars into the lumenal side of the ER and Golgi, supplying glycosyltransferases with sugar donors for the subsequent modification of proteins and lipids (Hirschberg et al., 1998; Kawakita et al., 1998; Abeijon et al., 1989) (Figure 1). Several NSTs have been characterized from yeasts, animals and plants (Abeijon, et al., 1996;
Eckhardt et al., 1996; Miura et al., 1996; Baldwin et al., 2001). The NSTs have been recently classified into three subfamilies based on sequence similarity, intracellular localization and substrate affinity (Martinez-Duncker et al., 2003) (Figure 1). NST subfamily 1 comprises transporters of UDP-coupled sugars (UDP- Galactose (UDP-Gal) and UDP-N-acetyl glucosamine (UDP-GlcNAc)) and CMP- Sialic acid (CMP-Sia). NST subfamily 2 includes transporters of UDP-sugars;
some of them located in the ER membrane (Norambuena et al., 2002; Reyes et
al., 2006). The NST subfamily 3 shows the broadest substrate specificity. This
family includes transporters of UDP- coupled sugars (e.g. UDP-glucose (UDP-
Glc), UDP-Gal, UDP-GlcNAc and UDP-Xylose (UDP-Xyl)) and GDP-coupled
sugars (GDP-Mannose (GDP-Man), GDP-Fucose (GDP-Fuc) and GDP-Arabinose
(GDP-Ara)). These proteins are thought to be an evolutionary intermediate between NST subfamilies 1 and 2 (Martinez-Duncker et al., 2003).
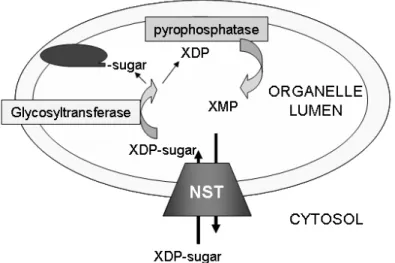
Figure 1. General transport mechanism of NSTs.
The NST mediates the transport of XDP-sugars in exchange for the monophosphate nucleoside XMP, which is formed by the action of pyrophosphatases over the diphosphate nucleotide XDP. This XDP is generated as a byproduct of the transfer reaction of the sugar group to an acceptor molecule (oval structure) by glycosyltransferases in the lumen of the organelle. Adapted from Martinez-Duncker et al. (2003).
Generally, each NST displays high substrate specificity, which is preferentially defined by the base coupled to the sugar nucleotide (guanidine, G, citidine, C or uridine, U) (Martinez-Duncker et al., 2003; Capasso and Hirschberg, 1984;
Chiaramonte et al., 2001). However, in which way the transporters recognize a specific sugar group among compounds coupled to the same nucleotide diphosphate is still unknown. Moreover, similarities between protein sequences do not necessarily reflect substrate specificity or function. For example, mammalian UDP-GlcNAc transporters share a higher sequence identity with mammalian UDP- Gal and CMP-Sia transporters than with the yeast UDP-GlcNAc transporter. On the other hand, the sequence similarity among GDP-activated sugar transporters seems to be more significant for function and specificity (Baldwin et al., 2001;
Lühn et al., 2001).
Recently, numerous novel proteins have been identified based on sequence similarity searches with pPT and NST protein sequences (Knappe et al., 2003a;
Handford et al., 2004, Bakker et al., 2005). The homologous NST/pPT protein family includes the products of 16 genes of Caenorhabditis elegans (Gerardy- Schahn and Eckhardt, 2004), 15 of humans (Ashikov et al., 2005), 2 of yeast and more than 40 genes of Arabidopsis (Knappe et al., 2003a; Bakker et al., 2005).
The role of the majority of the newly identified NST/pPT proteins is still to be determined and the reason for the existence of this large number of homologous proteins, especially in plants, is still unclear.
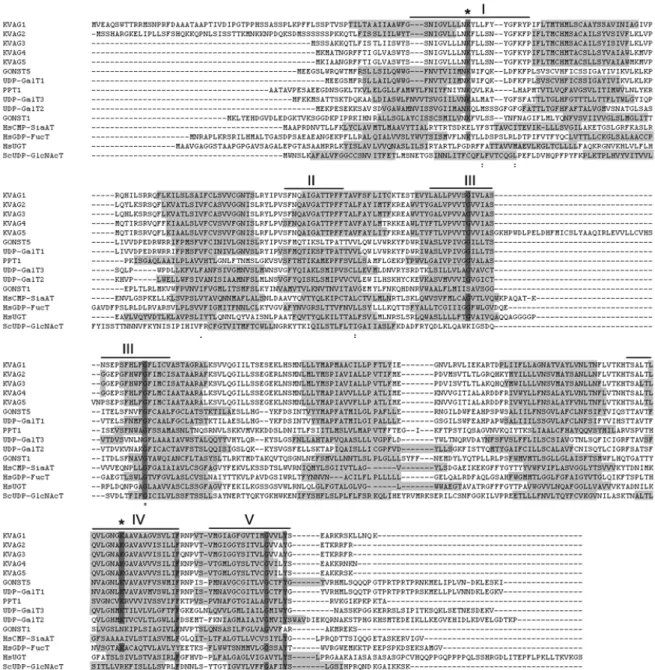
The NST/pPT homologous proteins share no more than 20-25% amino acid identity with known NST and pPT proteins, but the common structural characteristics are conserved among them. The NST/pPT like proteins contain 7 to 10 predicted TMDs, positioned in similar regions as the TMDs of known NSTs and pPTs. In addition, several residues are preserved among these proteins, including two conserved lysines (K41 and K273, numbered according to the sequence of the spinach triose phosphate/phosphate transporter), that are presumably required for substrate binding (Knappe et al., 2003a; Handford et al., 2004; Bakker et al., 2005). Lysine
273belongs to the conserved GALNK motif that is required for GDP- Man binding and seems to be specific for GDP-sugar transporters (Gao et al., 2001). The NST/pPT homologous proteins do not contain the whole conserved motif, except for the lysine.
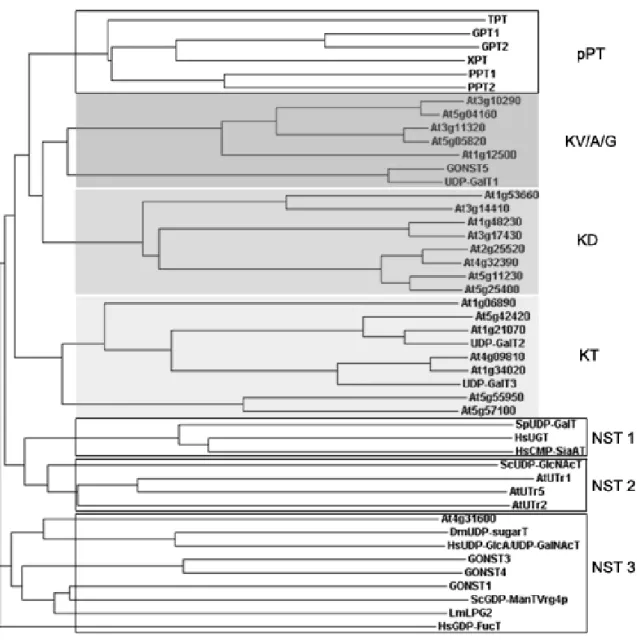
Sequence comparisons between the NST, pPT and NST/pPT homologous proteins revealed discrete subfamilies (Knappe et al., 2003a; Bakker et al., 2005).
Protein sequence alignments (shown as a phylogenetic tree) of 30 of the
Arabidopsis NST/pPT homologous proteins and representative members from the
NST and pPT families are presented in Figure 2. These closely related
Arabidopsis NST/pPT homologous proteins clearly split in three subfamilies: the
KV/A/G, KT and KD families. The names of these subfamilies refer to the
presence of the conserved lysine
273residue, followed by a valine, an alanine or a
glycine (V/A/G) in the KV/A/G subfamily, a threonine (T) in the KT subfamily, or an
asparagine (D) in the KD subfamily. Because the residue at position 274 is
characteristic of each subfamily, it supposedly has a role in the determination of the substrate specificity of these transporters (Knappe et al., 2003a).
Figure 2. Phylogenetic tree of NST/pPT proteins.
Novel Arabidopsis proteins homologous to NST and pPT (presented in gray boxes) were aligned with Arabidopsis pPTs and with NSTs from yeast (Sp, Saccharomyces pombe, Sc, Saccharomyces cerevisiae), Homo sapiens (Hs), Drosophila melanogaster (Dm), Leishmania mexicana (Lm) and Arabidopsis thaliana (At). The homologous proteins cluster in three differentiated subfamilies, named KV/A/G, KD and KT (Knappe et al., 2003a).
Only recently, studies on plant NST/pPT homologous proteins have led to the characterization of novel UDP-Gal and GDP-Man transporters (Bakker et al., 2005; Handford et al., 2004; Norambuena et al., 2005) that are presumably involved in the synthesis of cell wall components. The Arabidopsis UDP-Gal transporter 1 (UDP-GalT1) and UDP-Gal transporter 2 (UDP-GalT2) were identified by expression cloning in a Chinese hamster ovary cell line lacking UDP- Gal transport activity (CHO-Lec8, Bakker et al., 2005). These proteins were heterologously expressed in yeast and showed high affinity for UDP-Gal but almost no affinity for other nucleotide sugars. A third Arabidopsis UDP-Gal transporter, AtUTr2, was identified by sequence similarity with AtUTr1, and was found to be specific for UDP-Gal transport in vitro and in vivo (Norambuena et al., 2005). A group of Arabidopsis Golgi nucleotide sugar transporters (GONST2-5) were identified due to similarities with GONST1, and all were shown to transport GDP-Man by complementation of the manosylation defects present in the vrg4 yeast mutant (i.e. hypersensitivity to hygromicin and reduced manosylation of matrix glycoproteins) (Handford et al., 2004). Interestingly, GONST5 shares high similarity (91% amino acid identity) with UDP-GalT1, although they transport different base-coupled nucleotide substrates (GDP-Man for GONST5 and UDP- Gal for UDP-GalT1). This is unusual compared to other GDP-sugar transporters, which appear to be more conserved in sequence and function than the UDP-sugar transporters (Martinez-Duncker et al., 2003, Bakker et al., 2005).
The identification of more than 20 putative NST/pPT proteins in the genome of
Arabidopsis raises questions regarding their role in plant metabolism (i.e. supply of
precursors for protein, lipid and polysaccharide glycosylation). Most of the NSTs
characterized so far are likely located in the Golgi apparatus, including two
members of the KV/A/G subfamily and one of the KT subfamily (UDP-GalT1, UDP-
GalT2; Bakker et al., 2005, and GONST5, Handford et al., 2004). However, two of
the KVAG proteins (KVAG1 and KVAG2) present putative plastid targeting
sequences (Aramemnon database, Schwacke et al., 2003). The remaining
homologous proteins contain signals for the secretory pathway, ambiguous
targeting peptides or no signals detected by computer prediction programs
(Knappe et al., 2003a). The main goal of the work presented here was to analyze
the physiological role of KVAG1 and KVAG2 in plants.
In animals and yeast, deleterious defects in NSTs have tremendous negative consequences on the metabolism of these organisms, in many cases resulting in lethality (Dean et al., 1997; Freeze, 2001; Lübke et al., 2001; Hirschberg, 2001).
However, there are no NST mutants identified in plants that display such drastic
characteristics. Therefore, the role of KVAG1 and KVAG2 was investigated by
analyzing T-DNA insertion mutants which presented a reduction in leaf
phospholipids. Transport measurements were performed using heterelogously
expressed proteins and a panel of potentially activated substrates was tested.
2.1 Materials
2.1.1 Vectors
The vectors used for the different processes of cloning, listed in Table 1, were Gateway™ compatible plasmids (see 2.2.1). The construct used for labelling the Golgi apparatus contained the mouse sialyltransferase (ST) cDNA coupled to the cDNA for the green fluorescent protein (GFP), driven by the CaMV 35S promoter (35S-ST::GFP, Lee et al., 2002). This and the construct employed for labelling the ER (35S-mGFP fused to an ER retention signal), were kindly provided by Dr.
Martin Hülskamp.
Table 1. Vectors employed in cloning and organelle labeling.