Abstract
Background:Thorough QT studies are typically a requirement of the clinical development program for new investigational drugs. These
Arne Ring
1,2Beate Walter
3studies are a major cost factor in early development. The objectives of
Anna Larbalestier
4a typical thorough QT study (TQT) are to demonstrate (a) that therapeutic
Dennis Chanter
5and supra-therapeutic doses of a new investigational drug do not prolong the ECG QT interval compared to placebo and (b) that an active control does show QT prolongation compared to placebo.
1 Boehringer Ingelheim Pharma GmbH & Co KG, In recent years, statistical research has led to substantial improvements
in the design and analysis of these studies. We show one example of
a recently developed, efficient study design. Phase I/IIa Biostatistics,
Biberach, Germany Methods:TQT studies conventionally follow a crossover design based
on a Williams square of order four, as four treatments must be investi- 2 University of Ulm, Institute of Biometry, Ulm, Germany gated. This design can be improved, since all comparisons in this design
are active versus placebo. Hence it is efficient to double the number of 3 Independent consultant, Limburgerhof, Germany placebo periods for each subject in order to reduce the sample size and
the overall study costs. 4 AFSS Access Financial
(Cyprus) Ltd, Cyprus Several options for implementing this design are discussed and the
preferred option is given. In addition, the corresponding changes in the
5 Statisfaction, Bexhill, United Kingdom
analysis that are required to account for the multiple placebo periods are shown.
Conclusions:Using a five period, four treatment design can lead to a reduction in the study costs of around 10%. Moreover, the number of active treatments administered is reduced which is a potential advan- tage for the investigation of drugs with a critical safety profile.
Keywords:thorough QT study, Williams design, orthogonal Latin squares, statistical efficiency, permutations, group theory
Zusammenfassung
Hintergrund: Ein wichtiger Bestandteil in der klinischen Entwicklung neuer pharmakologischer Substanzen sind spezielle EKG-QT-Studien (thorough QT – TQT-Studie). Die Durchführung und Auswertung dieser Studien sind für die frühe klinische Entwicklung vergleichsweise teuer.
Studienziele einer TQT-Studie sind nachzuweisen, (a) dass therapeuti- sche und supratherapeutische Dosen der Substanz das QT-Intervall im Vergleich zu Placebo nicht verlängern und (b) dass eine aktive Positiv- kontrolle die erwartete Verlängerung des QT-Intervalls im Vergleich zu Placebo zeigt.
In den letzten Jahren führte die statistische Forschung auf diesem Gebiet zu wesentlichen Verbesserungen im Design und in der Analyse dieser Studien. In diesem Artikel wird ein weiterer Vorschlag zur Verbesserung des Designs vorgestellt.
Methoden:Ein konventionelles Design für TQT-Studien basiert auf einem Williams Crossover-Design der Ordnung 4, da vier verschiedene Behand- lungen untersucht werden sollen. Dieses Design kann verbessert wer- den, da alle Vergleiche in der Studie den Unterschied von aktiven Sub- stanzen gegen Placebo testen. Es ist deshalb statistisch effizient, die Anzahl der Placebo-Perioden pro Studienteilnehmer zu verdoppeln, da
man damit die Fallzahl der Studie und letztlich die gesamten Studien- kosten reduzieren kann.
In diesem Artikel werden verschiedene Möglichkeiten der Implementie- rung dieses Designs diskutiert und eine bevorzugte Option vorgeschla- gen. Weiterhin werden notwendige Änderungen in der Analyse der Daten – in Bezug auf die mehrfachen Placebo-Behandlungen – vorgestellt.
Schlussfolgerung: Mit einem 5-Perioden, 4-Behandlungs-Crossover- Design können die Gesamtkosten einer TQT-Studie um etwa 10% ver- ringert werden. Als weiterer Vorteil für Substanzen mit kritischem Sicher- heitsprofil kann die Verringerung der Fallzahl und damit der Einnahme von aktiver Medikation angesehen werden.
Schlüsselwörter:QT-Studie, Williams Design, orthogonale Lateinische Quadrate, statistische Effizienz, Permutationen, Gruppentheorie
1 Introduction
The assessment of cardiac safety has become an import- ant part of drug development. Since the discovery of the drug related adverse reactions of QT prolongation (torsade de pointes) in the early 1980s, the focus on these safety properties has increased, leading to the requirement of confirmatory verification of the absence of clinically rele- vant prolongation of QT in a so called ‘thorough QT trial’.
These requirements are described in the guideline ICH E14 [1] and in further detail in a subsequent Q&A docu- ment [2].
Frequently used design options for thorough QT (TQT) trials have been discussed in several publications [3], [4], [5]. A number of design features depend on the properties of the investigational drug. The pharmacokin- etic profile determines the length of treatment adminis- tration and the sampling of ECG and pharmacokinetic data. Additionally, the anticipated therapeutic dose range, the general safety as well as specific actions of the drug on the ECG, namely on the heart rate and the QT interval, need to be considered.
Other important design issues include the requirement that TQT trials are conducted in healthy volunteers (except for oncologic substances [6]), and the use of two doses of the investigational drug as well as moxifloxacin as the active control. Furthermore, there is a major technical aspect – how to obtain, measure and interpret the ECG data. The choice of devices and measurement algorithms has been shown to have a substantial impact on the variability of the outcome.
However, a factor which has a considerable impact on the cost and effort involved in TQT studies is the statistical design and corresponding analysis that is chosen. This begins with the selection of a parallel or crossover design and includes the choice of the baseline used to account for potential circadian changes in the ECG intervals. Re- garding the statistical analysis, the use of appropriate mixed models, including the selection of covariates and the structure of covariance matrices can impact the overall efficiency of a TQT trial. Moreover, it is frequently discussed how to account for changes of the heart rate in the analysis of the QT interval (see Section 3), often
leading to a derivation of a “heart rate corrected QTc interval”.
A number of improvements in the design and analysis of TQT trials have been proposed and implemented in vari- ous TQT trials. In this paper, we present a new, more effi- cient design option in Chapter 2 and discuss its imple- mentation based on a trial that is currently being con- ducted at Boehringer Ingelheim (BI). In Chapter 3 we briefly summarise the recent developments in the statis- tical analysis of TQT trials and discuss their adaptations with respect to the proposed design to account for the multiple administration of the placebo treatment.
2 Study design
2.1 Study treatments and conventional designs
The objective of a TQT study is to demonstrate that the investigational drug does not prolong the QT(c) interval more than placebo. If no pre-clinical or clinical signals that may indicate changes in ECG with the investigational drug have been observed, the goal of the TQT study is to confirm cardiac safety by showing non-superiority vs.
placebo. On the other hand, if the drug is expected to have an effect on the QT interval of around 10 ms or more, the TQT study may be performed in order to char- acterise the quantity of the signal under strictly controlled conditions. In both cases, the inclusion of an active con- trol is considered necessary to ensure the trial has suffi- cient sensitivity to detect small changes in the ECG, by reproducing its established QT/QTc prolongation effect.
The effects of the following treatments on the ECG par- ameters are typically investigated:
a) A therapeutic dose of the investigational drug b) A supra-therapeutic dose, to cover the worst case scenario for potential overdose or increased exposure due to pharmacokinetic interactions, e.g. with other drugs
c) Placebo, matched to the investigational drug d) An active control that affects the QTc interval with a magnitude within the regulatory limits [7], [8].
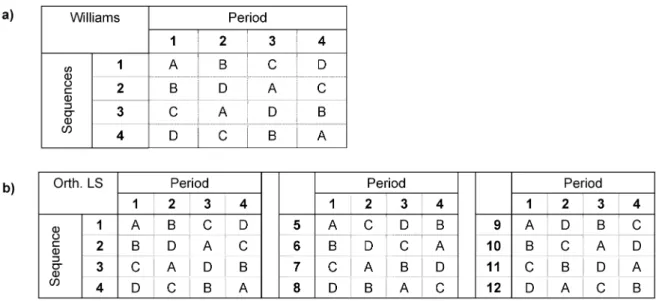
Figure 1: a) 4-period Williams design; b) 12 sequences for 4-period orthogonal Latin squares
The study designs conventionally used to investigate the effect of these treatments are either a four-period cross- over design, or a four-arm parallel group design. Due to the efficiency of crossover designs in TQT trials, this design has generally been used for such studies at Boehringer Ingelheim.
A Williams design of order 4 is generally the first choice for the generation of sequences for such a trial [9]
(Figure 1a). However, since moxifloxacin is still under patent protection, it is difficult to include a matching placebo to obtain a complete double dummy design.
Therefore, moxifloxacin is often given open-label, while the other three treatments are administered in double- dummy fashion.
Williams designs are minimal in the sense that the num- ber of sequences is not larger than for other variance balanced designs that account for first-order carry-over.
However, this property limits their degrees of freedom with respect to the choice of treatments, so that know- ledge of the period in which moxifloxacin is given to a subject unblinds the treatments in the other periods for this subject. Consequently, an independent person should assign the four treatments to the codes A–D, in order that the actual setup of the four sequences is not known to the study team.
Alternatively, the study sequences could be based on the 12 sequences that are generated from three orthogonal Williams designs of order 4 (Figure 1b). This design en- sures double-blind conditions of the other three treat- ments despite the open-label moxifloxacin, because in this design the administration of moxifloxacin in any given period appears with all combinations of the other treat- ments in the other periods. Moreover, this design is vari- ance-balanced and efficient for estimating treatment and first-order carry-over effects and it ensures that each ordered combination of two treatments is given at similar period intervals [10]. The design has sufficient degrees of freedom to assess first-order-carryover effects, as well as to adjust treatment effects for potential higher-order carryover [11], and it has been implemented in several
TQT studies at Boehringer Ingelheim [12], [13]. In these trials, the sample size of randomised subjects ranged between 36 and 48 subjects, which made randomisation in blocks of 12 sequences feasible, while ensuring a sig- nificant likelihood that there were at least two completing subjects for each sequence, even if a few subjects dropped out prematurely.
2.2 Efficiency of an improved crossover design
As discussed previously, all assessments in TQT trials are based on comparisons of the active treatments to placebo. These treatment contrasts should be estimated with the highest statistical efficiency. For parallel group trials, it has frequently been proposed in the literature that the number of patients in the placebo group should be larger than that in the comparator arms [14], [15]. An application of this approach to crossover trials leads to the inclusion of additional placebo periods. The simplest enhancement is therefore to administer the placebo treatment in two periods instead of only one. For a TQT study, this leads to a five period crossover design with three active and two placebo periods per subject [16].
The improvement in precision can be evaluated using the sample size formula for a t-test
whereαis test significance level,βis the power, Δ1is the difference in means, c the non-inferiority limit and σis the common standard deviation (this equation cannot be solved algebraically, becausedfdepends on N.)
To achieve the same power, the sample size of this five period crossover is 3/4 of the sample size of the sample size of the corresponding four period crossover, as the variability of the placebo estimates are reduced by half, so that the variability of the placebo-corrected values is
Table 1: Standard error of the QTc difference of moxifloxacin vs. placebo in crossover trials with single and corresponding simulated double placebo trials. The simulation was performed by assigning results of an active drug (without QTc effect) as
another placebo column.
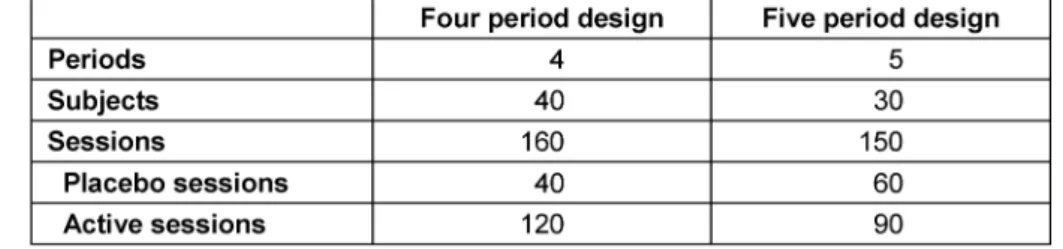
Table 2: Comparison of trial size needed to obtain the same power for a 4-treatment TQT trial using the conventional 4 periods or the new 5 period design with two placebo periods
whereσ4andσ5are the standard deviations of the treat- ment differences for the four and five period designs, and σdis the the expected variation among repeated measure- ments on the same individual (for each treatment).
To ensure that the power for the five period design is sufficient, we investigated whether the potential correl- ation between repeated placebo periods might lead to a less substantial gain of the variability. We used the data from four TQT trials with a 4-period crossover design. We selected studies in which the investigational substance did not show any relevant effect on the QTc interval at both the therapeutic and the supratherapeutic level, so that the active treatments could be considered to be
“placebo-like”. First, the QTc prolongation (and its standard error) of moxifloxacin vs. placebo was deter- mined using the original treatments. Then, the therapeutic level of the investigational drug was used to simulate a second placebo period. The results are shown in Table 1.
For all four trials, the reduction of the standard error was in the expected range of = 1.155. Hence the cor- relation of the placebo periods is considered to be low enough, that equation (2) appears to be approximately correct for the determination of the variability of the placebo-corrected measurements.
Table 2 shows a comparison between a four period and a five period crossover of similar power, based on a realistic scenario of 40 subjects in a four period trial [17], [18]. The cost reduction of the “sessions” from 160 to 150 is typically slightly larger than the 7% based on the numerical ratio, because the total costs also include fixed costs associated with each subject.
The proposed design is demonstrated below taking a sample size of 30 randomised subjects for the five period
design as an example, which is based on an TQT trial currently performed at Boehringer Ingelheim.
2.3 Choice of sequences
As a second step, we would like to select a specific effi- cient, balanced design for the five period design with two placebo periods. However, most literature on efficient study designs is based on the scenario where there are more treatments than periods (e.g. [19]).
Obviously, 5 must be a factor of the number of sequences in a balanced design for our five period crossover. Bal- anced and efficient five period 5-treatment designs are still balanced and efficient when 2 treatments are the same. However, it is not known which of these designs is the most efficient in this case.
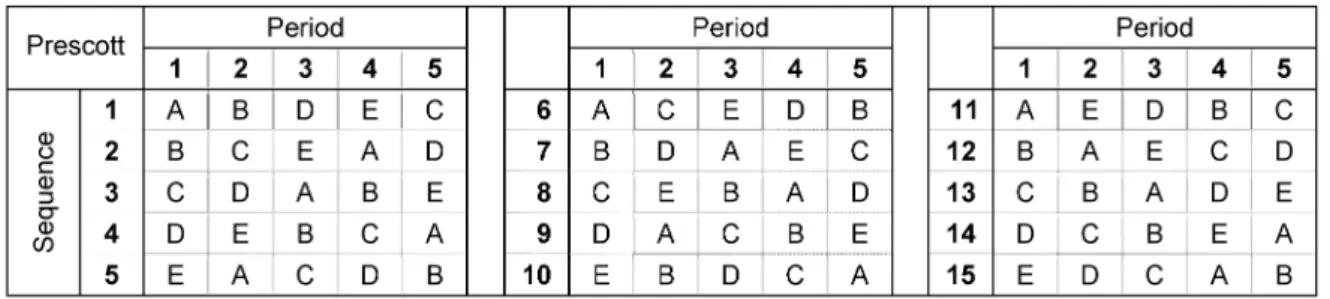
Possible and efficient 5-period 5-treatment designs that are also balanced for first order carry-over are the Williams design of order five (which uses blocks of 10 sequences), the Prescott design (15 sequences, Figure 2), and four orthogonal Latin squares (20 sequences), all of which have been shown to be efficient for estimating treatment and carry-over effects [9]. Based on the rather low sample size of 30 subjects that is needed for a five period TQT study, the Williams design appears to be the best choice among these three with respect to degrees of freedom for the treatment contrasts and balance even in the case of drop outs. In addition, the Prescott design does not fulfil the “placebo criterion”, which we discuss in the following paragraphs.
To elaborate further upon the properties of potential 5- period Williams designs, we used some theoretical prop- erties of Latin squares. The three main actions of permuta- tion groups on Latin squares are i) permutations of the rows, ii) permutations of the columns and iii) permutations of the symbols [20]. While i) and iii) maintain the Williams property (equal number of all first-order transitions), the
Figure 2: Prescott Triple Latin square design for 5 treatments
Figure 3: The three standard forms of Williams designs of order 5 (only the first of the two required Latin squares is shown)
permutation of columns can destroy the Williams property of a Latin Square. Notably, action i) is equivalent to the randomisation process of subjects to their treatment se- quences, while iii) is the assignment of treatments to the symbols in the Latin square.
By applying these three actions to Latin squares, equivalence classes of Latin squares can be found. The standard form of a Latin square is defined as a square in which the symbols in the first row and in the first column are in lexicographic order. There are 56 standard forms of order five [20], but only 3 of them are Williams designs (for odd Williams designs, the sequences 6–10 can be obtained by writing the sequences 1–5 in reverse order). Figure 3 shows the three Williams designs in standard form (W1–W3).
We evaluated whether one of these designs would provide advantages over the other. For practical reasons, we introduced the following criterion: It should not be pos- sible (or at least be unlikely) that the two placebo treat- ments are given in the last two periods. A design that fulfils this criterion would ensure that all subjects who have completed the first three periods have undergone at least one placebo period, and no subject would have taken two placebo treatments during the first two periods because of the symmetry of the reversed sequences 6–10. With respect to the study objective to perform all comparisons vs. placebo, this criterion would ensure that subjects who discontinue the trial prematurely still provide intra-individual data for at least one comparison of inter- est, as long as they have completed at least three study periods.
To investigate this criterion, we formed a vector v1=(1,1,0,0,0), where 1 is a period with placebo and 0 is any other treatment. There are 10 different permutations of this vector. They are the orbits of a groupGonv1, where G is generated e.g. by π1=(12)(34), π2=(23)(45) and π3=(13)(24)). These 10 permutations ofv1are applied to the three representative Williams designsWi. We denote
this application byuij=vj○Wi, whereuijis the resulting 0/1 design for the 10 sequences.
We found that some of the uij are similar, based on a partition of the 10 vectors into two subsetsVj(the vectors that lead to the same 0/1 designs are orbits of the sub- group G’ that is generated e.g. by π1=(12)(34), π2=(23)(45)). Figure 4 presents the allocation of the placebo treatments to the designs. Interestingly, it also holds thatu21= u32andu22= u31, which may be caused by the fact that W2and W3belong to the same isotopy class (there are two different isotopy classes of order 5 [20], which allow for switching between rows, columns and symbols).
It can be concluded:
• The designW1with the 5 vectorsv1–v5 V1results in twosequences per block of 10 that have placebo only in the last two periods (Figure 4b).
• The designW1, together with the other 5 vectorsv6–v10 V2, results innosequence that has placebo only in the last two periods, hence it fulfils our “placebo cri- terion” (Figure 4c ).
• In the designsW2andW3there is always exactlyone sequence per block which has placebo only in the last two periods (Figure 4d,e).
Therefore, it is proposed that a Williams design should be selected based on the second of the above cases.
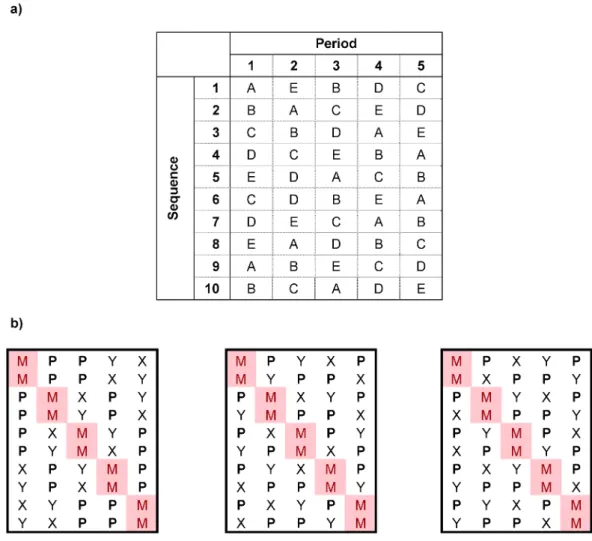
Figure 5a shows a resulting design, for which the symbols have been allocated so that if placebo is assigned to two of the codes A–E in such a way that no neighboring codes (that is AB, BC, CD, DE and AE) are both mapped to placebo, then no subject has two placebo treatments during the last two periods. This design has been chosen for a current TQT study at BI. The block size of 10 which is enforced by this design agrees with the subject cohort size used by the study center.
Figure 4: The equivalence classes of Williams designs Uij= Vj○Withat originate from the application of the vectors of Vjon the reduced forms of Williams squares Wi
As indicated earlier, the Prescott design would also lead to one or two subjects per block of 15 sequences who have placebo only in the last two periods.
As for the four period crossover, the assignment of the four treatments to the letters A–E should be performed by an independent person in order that the blinding of the study personnel is maintained. While there are 5!/2!=60 possible assignments of the codes, there are only three different designs of 10 sequences, as shown in Figure 5b (with symbols:M– open-label moxifloxacin, P– placebo,X, Y: The two doses of the new investigational drug).
This is however no limitation, as knowledge of the period when open-label moxifloxacin is administered does not reveal the treatments in the other periods if the actual
design is not known to the study personnel. Each admin- istration of moxifloxacinMin a given periodpiis combined with every other treatment in any other periodpj. Although the conditional probabilityP(pj=”T”|pi=”M”) for all treat- mentsT≠Mdepends oniandj, it is always greater than 0 (fori≠j), if the actual design is not known to the study personnel.
It would also be possible to restrict the designs to the middle and the right design in Figure 5b. In this case, the conditional probabilities would be independent ofiand j, with values P(pj=”P” | pi=”M”)=1/2 and P(pj=”X” | pi=”M”)=1/4 (same forY).
Each of the designs derived here are based on Williams designs, and so they are balanced for potential first order carry-over. As the time between two consecutive periods
Figure 5: a) Final form of the proposed Williams design of order 5. It is ensured that no subject has two placebo treatments during the last two periods, if the two assignments of placebo to the codes A–E is done in a way thatno neighboring codes (AB,
BC, CD, DE and AE) are mapped to placebo.
b) The resulting three designs that can be obtained from the assessments of the codes (M – open-label moxifloxacin, P – placebo,X, Y: The two doses of the new investigational drug).
for each subject is chosen based on the pharmacokinetic profile of the investigational drug, normally at least 2 weeks, the presence of relevant first-order carry over is unlikely, and higher order carry-over even more so.
3 Analysis types in TQT studies
In this section, we review some aspects of the analysis of TQT trials. We focus on those aspects for which adap- tations of analysis strategies should be considered to account for the proposed five period crossover design (compared to the traditional four period design).
The objective of a TQT study is to demonstrate that the investigational drug does not prolong the QT(c) interval more than placebo. The ICH E14 sets the non-inferiority margin at a value of 10 ms. As the QT interval is a safety marker, all recorded time points are considered to be of equal importance, so that the difference following active treatments vs. placebo should be below 10 ms at each point in time.
Repeated measurements mixed models are applied to estimate treatment effects while accounting for typical covariates such as baselines or period effects. As the heart rate impacts the QT interval, different methods are available to estimate the treatment effect on the QT inter- val independent from potential changes in the heart rate.
In Section 3.1 we describe the derivation of endpoints in a TQT trial. Section 3.2 discusses methods to derive the heart rate corrected QT prolongation, and in Section 3.3, the exposure-response analysis using concentrations as covariate is presented. In Section 3.4, we present issues on the choice of the baseline, and Section 3.5 concludes with adaptations of the categorical analysis to account for the double placebo design. All analyses presented here assume that the relationship between heart rate and QT interval is not altered by any of the treatments.
3.1 Data and endpoints
The primary data generated in TQT trials are: ECG interval data (QT interval and RR interval, where the latter is the reciprocal of the heart rate), and plasma concentration
data of the investigational drug (and sometimes of metabolites). These data are obtained as repeated measures over time, where the ECG measurements are typically obtained in replicates to reduce their variability [21]. Therefore, first step is to summarise the data of the replicates to obtain one measurement (of QT and RR interval) per time point. Then, heart rate corrected QTc intervals are derived, as explained in Section 3.2.1. Fi- nally, the ECG endpoints are categorised by medically defined cut offs. Two types of categorisations are defined:
for absolute values of QT/QTc (>450;>480;>500 ms) and for change from baseline values (>30;>60 ms) [1].
3.2 Repeated measurements analyses
3.2.1 Two-stage analysis
In the two-stage analysis, the heart rate correction is performed as a first stage to remove the impact of the length of the RR interval on the QT interval. This gives the heart-rate-corrected QT interval (QTc), which is the ex- pected QT interval at a standardized heart rate of 60 bpm.
A number of approaches are available, but no universal method has been agreed upon. Therefore it is generally requested that some specific heart rate correction methods (Fridericia and Bazett) are evaluated as sensi- tivity analyses.
Frequently, heart rate correction is based on a multi-level mixed model that quantifies the relationship between QT and RR data within the study. QT and RR data are log- transformed, and subject and period levels are modelled by random coefficients or random effects [22].
A general model is denoted by
whereyijkis the logarithm of the QT interval in subjecti and periodj, at the k-th repeated measures time point (k=1,…,K), and similarlyxijkfor the logarithm of the RR interval.γis the associated covariate effect andγiis the interaction effect with the subject.
The subject effectssiand the individual slope addends γiare random coefficients, and the subject by period effect πijcan be specified as a random effect when heart rate correction is applied to drug free baseline data [21]. Then, γis thepopulationslope for the QT-RR relationship, and the corresponding heart rate correction is called QTcN (QTcN = QT/RRγ), whileγ+γiare the individual slopes for each subject.
It has recently been shown that the derivation of one
“population” heart rate correction, if derived from a multi- level model, provides more efficient estimates of relation- ship between QT interval and heart rate than estimating the QT-RR relationship for each individual [21]. This is also in alignment with the objective of TQT studies, that is, to estimate the QTc effect in the study population.
The QT-RR relationship is often estimated from the placebo data, and the derived QTc correction is applied to the other study periods. In this case, the five period design with two placebo periods provides more data to
determine the QT-RR relationship than the conventional four period crossover and most likely larger ranges of heart rates for each individual. In fact, the design has the added advantage that the within-subject variability of the heart rate correction can be evaluated directly within the trial. Therefore it is possible to judge whether deviations in the heart rate variability in other treatment periods are of similar magnitude and should be assumed to be ran- dom only.
The second stage is the repeated measures analysis of the QTc endpoints over time [23]. Recently, the saturated repeated measures cross-over (RMC) model had been proposed for this analysis [24]. This model extends the traditional analysis for univariate crossover data for re- peated measurements in each period by ‘multiplying’ all univariate effects by the factor time, that is, all effects and their interactions with time are included in the model.
The saturated RMC model is given by
yikm(j)is the heart rate corrected QTc (on original scale) for
the i-th subject and the m-th period at the k-th repeated measures time point (k=1,…,K), and the subscript (j) in- dicates that subject i received randomized treatment j in the m-th treatment period. bikm is the corresponding baseline QTc for subject i, time k and period m (the index k allows for time-matched baselines and would be omitted for other types of baselines, see Section 3.4) andγis the associated covariate effect. Furthermore,μis the inter- cept;πmis the m-th period effect;τjis the j-th treatment effect.ζkis the k-th time effect;γkis the interaction effect of baseline and time;πmkis the interaction effect of period and time; τjk is the interaction effect of treatment and time;sikis the random effect of subject i at time k; and
eikm(j)is the random error for time k and period m. All ran-
dom terms have mean zero, and thesikare assumed in- dependent of the eikm(j)and are assumed mutually inde- pendent across index i (subject), while theeiikm(j)are as- sumed independent across indices (i,m) (subject and period). The covariance between the subject effects sik over the K time points and between the error termseikm(j) over time, is modelled using the unstructured covariance structure of the K-variate random vectorssi= (si1,...,siK)' andeim(j)= (ei1m(j),...,eiKm(j))', respectively.
It is proposed that the saturated RMC model is applied separately to each treatment comparison of interest, hence three analyses will be performed for all active treatments against placebo.
For the five period design, data from both placebo periods would be included together with one of the active treat- ments. It would not be appropriate to just average the data from both placebo periods, as the variability of the resulting averages would be different from the variability of the remaining data; averaging would also not maintain the data structure.
In contrast to [24] we have modified equation (4): While for the four period design, period and treatment are unique and can be used synonymously in each subject
on the RR interval from those on the QT interval may lead to biased estimated of the drug induced QT prolongation [25], [26], [27], [28]. Instead, it is argued that effect of treatment on the joint distribution of RR and QT should be studied. If the drug does affect the heart rate, this change should be directly incorporated in the analysis of QT by incorporating the conditional distribution of the RR interval into the model.
One option is to add the RR interval as a covariatexikm(j) to model (4) which allows modelling of the slope β between heart rate and QT interval directly, leading to
Hereby,yikm(j)andxikm(j)are functions of the uncorrected QT interval,yikm(j)=ƒ(QTikm(j))) and RR interval (xikm(j)= ƒ(RRikm(j))).
This function could be the identity (for an analysis on lin- ear scale) or the logarithm, which allows modelling of the relationship between heart rate or QT interval more ad- equately. Similarly, the same function ƒ is applied to the baseline QT intervalbikmand the RR intervalxikm(j). The re- maining effects are the same as in model (4). However, the estimated treatment contrasts are ratios instead of differences. Although the ratio might be able to predict the risk of torsade de pointes more adequately than the difference, this analysis would not be in line with the re- quirements of the ICH E14.
For the five period design, no further adaptations of this analysis appear to be necessary.
3.3 Exposure-response analysis
The exposure-response analysis is based on the plasma concentration data and QTc intervals. The proposed model for the analysis is [29], [30]
cik is the concentration observed for the i-th subject at the k-th repeated measures time point (k=1,…,K’) follow- ing any dose of the investigational drug.yikis the (placebo corrected) change from baseline of the QTc interval (For simplicity, the indices k in (6) and (7) are adapted so that measurements from both active treatments are covered, so that K’=2*K, where K is number of measurements in each period.)siis the difference from the average in the intercept term for the i-th subject andγiis the difference in slope for the i-th subject from the average slope. The estimates of the slopes and intercepts are correlated within each subject and the vector (si,,,γi) is assumed to follow a bivariate normal distribution, which is modelled using the unstructured covariance matrix. The residuals
measures time point following the active treatment and zikpnthe heart rate corrected QTc interval changes from baseline at the corresponding time point of any of the two placebo periods.
The use of the average of two measurements is assumed to reduce the variability ofyik, so that also this analysis benefits from the double placebo design. The analysis is again a mixed model with subject as random effect, while the actual dose of the investigational drug is not included as it is replaced by the more informative plasma concen- tration.
3.4 Choice of baseline
The selection of statistically efficient baselines was a matter of some debate following the release of ICH E14.
Initially, a time-matched baseline was required in all study periods for parallel and crossover trials, to account for the individual circadian rhythm of the ECG intervals. This requirement subsequently was relaxed in the Q&A docu- ment for ICH E14 [2] for crossover trials. Several studies have investigated the efficiency of the analyses when using different baseline concepts, such as “change from time-matched baseline at day –1”, “change from mean of baseline ECGs at day –1”, or as “change from pre-dose baseline at day 1” [3], [31], [32], [33], [34], [35], [36], [37].
Interestingly, the results of these studies are not uniform.
Differences were found between parallel and crossover studies, as well as between single dose and multiple dose studies. Generally, the statistical value of the baseline (in terms of smallest standard errors of the estimates) decreased as the time interval between the baseline measurement and the on-treatment measurement in- creased.
For parallel studies, the use of the “change from mean of baseline ECGs at day –1” gave the smallest standard errors for the primary endpoints, while for crossover studies, the “change from time-matched baseline at day –1” was best. However, the cost of obtaining ECGs on a whole baseline day is almost doubled when compared to only measuring pre-dose ECGs directly before drug admin- istration. Since use of a time-matched baseline does not decrease the standard errors proportionally to the costs of the ECGs in crossover studies, the most cost effective option is the use of pre-dose ECGs [37].
Recently, the use of period specific baselines in crossover trials has been criticized as this methodology could poten- tially introduce cross-level bias [38]. As an alternative it was proposed that the subject-specific average baselines (over all periods) and the difference of the period-specific
baseline (joint analysis) be included. The advantage of this approach with respect to the saturated RMC models remains to be investigated.
3.5 Analysis of categorical endpoints
There are numerous categorical endpoints to be analysed in a TQT trial. A) Subjects with values exceeding medically defined limits, e.g.: QT interval >500 ms, QTc intervals
>450;>480;>500 ms [1], and also PR interval >200 ms with a change of more than 25% or QRS interval >110 ms with a change of more than 10% are reported.
B) Cardiologic assessments, e.g. regarding morphology, conduction, or wave form characteristics, typically re- ported using pre-defined categories. C) Adverse events that are recorded using “free text fields”.
These endpoints are usually presented using a frequency table for each study treatment. Descriptive statistics are regarded as being sufficient, as the frequency of any of these events in healthy volunteer trials is expected to be too low to result in a statistically significant difference between the treatments, even if such a difference were present. Specifically for the dichotomised endpoints (A), the analysis of continuous data using mixed models is much more powerful than the analysis of the categories [27].
The incidence of subjects with findings in categorical endpoints depends on the number of ECGs recorded over the treatment period. In a trial with two placebo periods but only one of each of the active treatments, the prob- ability of observing at least one abnormal finding in a subject will be larger under placebo than for the other treatments (under the assumption that the active treat- ment does not have a greater effect than placebo). For each of the endpoint types A) – C) we propose an adap- tation of the analysis to account for this effect.
For the dichotomised endpoints (A), we propose to aver- age the ECG measurements at the same time point of both placebo periods before the categorisation is per- formed. Then, the variability of the continuous ECG parameters is lower compared with the other treatments, which is conservative with respect to the active treat- ments.
It should be noted that in the categorical analysis anindi- vidualheart rate correction may be preferable to apopu- lation correction, since the QT-RR relationship varies across individuals and the objective of the categorical analysis is to find subjects with potentially relevant changes. However, it has not yet been investigated whether these thresholds should be generally adapted based on the individual QT-RR relationship (with respect to their sensitivity and specificity to quantify the risk of drug related induction of torsade de pointes).
The incidence of findings in cardiologic assessments (B) will be rated based on the total number of ECGs recorded per treatment in each subject. For adverse events (C), the incidence rate will be determined based on the number of periods for each subject per treatment. Both analyses account for the “time on risk” that each subject
underwent per treatment (“time on risk” is understood as the duration of the treatment period of each treatment, it is twice as large for the placebo treatment). Again, they are conservative with respect to active treatments, be- cause a single finding in the placebo treatment would be down rated compared to a single finding under any active treatment.
All of the analysis strategies above would also inherently account for premature discontinuation of subjects, even if they have undergone only one of the two planned placebo periods.
An alternative analysis is to summarise not only the events in the two placebo periods, but also to summarise the events of the two periods of (the different doses of) the new investigational drug.
The interpretation of this summary would be “events fol- lowing a dose of at least the therapeutic dose level”. This leads to a “time under risk” which is similar for both placebo and the investigational drug. A comparison to the active control would be omitted, but the active control appears to be of minor importance with respect to any of these categorical analyses.
The alternative analysis is considered meaningful in the context of a TQT study, as the supra-therapeutic doses in such trials generally are generally selected so that no relevantly increased incidence of adverse events are ex- pected.
4 Conclusion
In this paper, we have proposed a new study design for crossover TQT studies that collects data in two placebo periods. This design is more efficient than the usual four- period crossover design, as all comparisons of interest are performed between the active drugs and placebo; no comparisons between the active drugs are needed to meet the study objectives. The overall costs of the TQT study are expected to be reduced by 5–10% with the proposed design. Moreover, the number of subjects for the trial is reduced so that fewer subjects need to take active medication. This could be an additional advantage for TQT studies in drugs with safety limitations. Addition- ally, the proposed design allows for a more robust deter- mination of the QT:RR relationship in individual subjects, and also for a check on the assumption that this relation- ship is stable between periods.
The trade-off for the cost saving is the longer trial dur- ation. This longer duration might not be a crucial factor as TQT studies are often performed in parallel to a phase III program of the investigational drug. We have previously performed a four-period crossover with six weeks of washout successfully [12], and even with this trial duration, only one of 44 subjects discontinued the trial prematurely.
We have discussed implications of the design on the analysis of the trial. The considerations are necessary to account for the multiple placebo periods.
corrections) led directly to decreases in sample sizes and overall effort. Based on the data from earlier TQT trials, the statistical community has learned more about the structure and the content of this specific type of data, which will lead to improvements and finally to cost reduc- tion for future trials.
Notes
Acknowledgements
Parts of this manuscript were presented at the GMDS 2010 in Mannheim [39]. A trial using this design is cur- rently being performed at Boehringer Ingelheim.
Conflicts of interest
A. Ring is employee of Boehringer Ingelheim Pharma GmbH & Co KG. Beate Walter and Anna Larbalestier re- ceive funding from Boehringer Ingelheim Pharma GmbH
& Co KG.
References
1. ICH Topic E14. The clinical evaluation of QT/QTc interval prolongation and proarrhythmic potential for non-antiarrhythmic drugs. Note for guidance on the clinical evaluation of QT/QTc interval prolongation and proarrhythmic potential for non- antiarrhythmic drugs. London: European Medicines Agency;
2005. CHMP/ICH/2/04. Available from: http://
www.ema.europa.eu/docs/en_GB/document_library/Scientific_
guideline/2009/09/WC500002879.pdf
2. ICH Topic E 14. The clinical evaluation of QT/QTc interval prolongation and proarrhythmic Potential for non-antiarrhythmic drugs. Questions and answers. London: European Medicines Agency; 2008. EMEA/CHMP/ICH/310133/2008. Available from:
http://www.ema.europa.eu/docs/en_GB/document_library/
Scientific_guideline/2009/09/WC500002878.pdf 3. Beasley CM, Dmitrienko A, Mitchell MI. Design and analysis
considerations for thorough QT studies employing conventional (10 s, 12-lead) ECG recordings. Expert Rev Clin Pharmacol.
2008;1(6):815-39. DOI: 10.1586/17512433.1.6.815 4. Darpo B. The thorough QT study 4 years after the implementation
of the ICH E14 guidance. Br J Pharmacol. 2010;159(1):49-57.
DOI: 10.1111/j.1476-5381.2009.00487.x
5. Malik M, Garnett CE, Zhang J. Thorough QT studies. Questions and quandaries. Drug Saf. 2010;33(1):1-14. DOI:
10.2165/11319160-000000000-00000
6. Sarapa N, Britto MR. Challenges of characterizing proarrhythmic risk due to QTc prolongation induced by nonadjuvant anticancer agents. Expert Opin Drug Saf. 2008;7(3):305-18. DOI:
10.1517/14740338.7.3.305
of residual effects of treatments. Aust J Sci Res A. 1948;2:149- 68.
10. Jones B, Kenward MG. Design and analysis of cross-over trials.
2nd ed. Boca Raton: Chapman & Hall/CRC; 2003.
11. Zhang J, Machado SG. Statistical issues including design and sample size calculation in thorough QT/QTc studies. J Biopharm Stat. 2008;18(3):451-67. DOI: 10.1080/10543400802020938 12. Ring A, Port A, Graefe-Mody EU, Revollo I, Iovino M, Dugi KA. The DPP-4 inhibitor Linagliptin does not prolong the QT interval at therapeutic and supratherapeutic doses. Br J Clin Pharmacol.
Accepted.
13. Ring A, Rathgen K, Stangier J, Reilly P, Friedman J. Dabigatran does not prolong the QT interval when given with
supratherapeutic exposure – a thorough QT study. In preparation.
14. Fleiss JL. Design and analysis of clinical experiments. New York:
Wiley; 1986.
15. Machin D, Campbell MJ, Tan SB, Tan SH. Sample size tables for clinical studies. Chichester: Wiley Blackwell; 2008.
16. Chanter DO. More power for your money. DIA Cardiac Safety Conference; 2007; Prague.
17. Meng Z, Kringle R, Chen C; Zhao PL. Sample size calculation for thorough QT/QTc study considering various factors related to multiple time points. J Biopharm Stat. 2010;20(3):580-94. DOI:
10.1080/10543400903581986
18. Anand SP, Murray SC, Koch G. Sample size calculations for crossover thorough QT studies: Satisfaction of regulatory threshold and assay sensitivity. J Biopharm Stat. 2010;20(3):563- 79. DOI: 10.1080/10543400903582000
19. Hedayat AS, Yang M. Optimal and efficient crossover designs for comparing test treatments with a control treatment. Ann Stat.
2005;33(2):915-43. DOI: 10.1214/009053604000000887 20. McKay BD, Meynert A, Myrvold W. Small latin squares,
quasigroups, and loops. J Combin Des. 2006;15(2):98-119. DOI:
10.1002/jcd.20105
21. Ring A. Statistical models for heart rate correction of the QT interval. Stat Med. 2010;29(7-8):786-96. DOI:
10.1002/sim.3791
22. Shah A, Hajian G. A maximum likelihood approach for estimating the QT correction factor using mixed effects model. Stat Med.
2003;22(11):1901-9. DOI: 10.1002/sim.1434
23. Patterson SD, Jones B, Zariffa N. Modeling and interpreting QTc prolongation in clinical pharmacology studies. Drug Inf J.
2005;39(4):437-45.
24. Schall R, Ring A. Mixed models for data from thorough QT studies:
Part 1. Assessment of marginal QT prolongation. Pharm Stat.
2010. DOI: 10.1002/pst.463 (online ahead of print)
25. Schall R. Mixed models for data from thorough QT studies: Part 2. One-step assessment of conditional QT prolongation. Pharm Stat. 2010. DOI: 10.1002/pst.465 (online ahead of print) 26. Dmitrienko A, Smith B. Repeated-measures models in the analysis of QT interval. Pharm Stat. 2003;2(3):175-90. DOI:
10.1002/pst.53
27. Senn S, Julious S. Measurement in clinical trials: A neglected issue for statisticians? Stat Med. 2009;28(26):3189-209. DOI:
10.1002/sim.3603
28. Schall R, Ring A. Statistical characterisation of QT prolongation.
J Biopharm Stat. 2010;20(3):543-62. DOI:
10.1080/10543400903581978
29. Garnett CE, Beasley N, Bhattaram VA, Jadhav PR, Madabushi R, Stockbridge N, Tornoe CW, Wang Y, Zhu H, Gobburu JV.
Concentration-QT relationships play a key role in the evaluation of proarrhythmic risk during regulatory review. J Clin Pharmacol.
2008;48(1):13-8. DOI: 10.1177/0091270007307881 30. Davis JD, Hackman F, Layton G, Higgins T, Sudworth D,
Weissgerber G. Effect of single doses of maraviroc on the QT/QTc interval in healthy subjects. Br J Clin Pharmacol. 2008;65(Suppl 1):68-75. DOI: 10.1111/j.1365-2125.2008.03138.x
31. Glomb P, Ring A. Use of baseline ECGs in the evaluation of thorough QT studies with crossover design. Drug Inf J.
2008;42(2):202. Poster available at http://
www.biopharmnet.com/doc/2008_04_15_poster.pdf 32. Klopper R. Baseline Adjustment in Thorough QT Trials [Master
thesis]. Bloemfontein: University of the Free State South Africa;
2010.
33. Agin MA, Aronstein WS, Ferber G, Geraldes MC, Locke C, Sager P. QT/QTc prolongation in placebo-treated subjects: a PhRMA collaborative data analysis. J Biopharm Stat. 2008;18(3):408- 26. DOI: 10.1080/10543400801992962
34. Tian H, Natarajan J. Effect of baseline measurement on the change from baseline in QTc intervals. J Biopharm Stat.
2008;18(3):542-52. DOI: 10.1080/10543400802005905 35. Bloomfield DM, Kost JT, Ghosh K, Hreniuk D, Hickey LA, Guitierrez
MJ, Gottesdiener K, Wagner JA. The effect of moxifloxacin on QTc and implications for the design of thorough QT studies. Clin Pharmacol Ther. 2008;84(4):475-80. DOI:
10.1038/clpt.2008.33
36. Sethuraman V, Sun Q. Impact of baseline ECG collection on the planning, analysis and interpretation of 'thorough' QT trials.
Pharm Stat. 2009;8(2):113-24. DOI: 10.1002/pst.338
37. Zhang X, Silkey M, Schumacher M, Wang L, Raval H, Caulfield JP. Period correction of the QTc of moxifloxacin with multiple predose baseline ECGs is the least variable of 4 methods tested.
J Clin Pharmacol. 2009;49(5):534-9. DOI:
10.1177/0091270008330158
38. Kenward MG, Roger JH. The use of baseline covariates in crossover studies. Biostat. 2010;11(1):1-17. DOI:
10.1093/biostatistics/kxp046
39. Ring A. Improved study design for a thorough QT trial. Annual meeting of the GMDS; 2010 Sept 05-09; Mannheim. Abstract 217.
Corresponding author:
Arne Ring
Boehringer Ingelheim Pharma GmbH & Co KG, Phase I/IIa Biostatistics, Birkendorfer Str. 65, 88397 Biberach, Germany
arne.ring@boehringer-ingelheim.com
Please cite as
Ring A, Walter B, Larbalestier A, Chanter D. An efficient crossover design for thorough QT studies. GMS Med Inform Biom Epidemiol.
2010;6(1):Doc05.
DOI: 10.3205/mibe000105, URN: urn:nbn:de:0183-mibe0001053
This article is freely available from
http://www.egms.de/en/journals/mibe/2010-6/mibe000105.shtml Published:2010-12-20
Copyright
©2010 Ring et al. This is an Open Access article distributed under the terms of the Creative Commons Attribution License
(http://creativecommons.org/licenses/by-nc-nd/3.0/deed.en). You are free: to Share — to copy, distribute and transmit the work, provided the original author and source are credited.