Procedia Computer Science 00 (2018) 000–000
www.elsevier.com/locate/procedia
The 15th International Conference on Mobile Systems and Pervasive Computing (MobiSPC 2018)
A Smart Mobile Assessment Tool for Collecting Data in Large-Scale Educational Studies
Kevin Andrews
a,∗, Michael Zimoch
a, Manfred Reichert
a, Miles Tallon
b, Ulrich Frick
b, R¨udiger Pryss
aaUlm University, Institute of Databases and Information Systems, James-Franck-Ring 1, Ulm, 89081, Germany
bHSD - Hochschule D¨opfer, University of Applied Sciences, Waldmarkt 3 and 9, Cologne, 50676, Germany
Abstract
Conducting scientific studies is an often frustrating and tedious task. To minimize recurring problems, such as lack of concentra- tion or willingness to participate, and instead promote interest in the study, a smart mobile device assessment tool was developed focusing on educational studies. The tablet-based assessment tool offers a wide range of visual tasks that can be employed when conducting studies utilizing the European Framework of Visual Literacy (ENViL). Furthermore, the assessment tool is highly con- figurable in the field by using a centralized server and spreadsheet-based configuration files, thereby ensuring that no programming language is required to adapt the tasks on the mobile devices participating in the study. Finally, the presented framework and architecture adhere to the cross-platform and cross-device style and can be re-used and extended for any number of similar studies.
c
2018 The Authors. Published by Elsevier Ltd.
This is an open access article under the CC BY-NC-ND license (http://creativecommons.org/licenses/by-nc-nd/3.0/).
Keywords: Smart Mobile Assessment, Visual Literacy, Cultural Education, Large-Scale Studies
1. Introduction
Nowadays, smart mobile devices (e.g., smartphones and tablets) are ubiquitous and the exploitation of their char- acteristics (e.g., mobility) offers promising perspectives for various domains. For example, the application of smart mobile devices in the gathering and sensing of data offers opportunities to unravel insights as well as findings in the field of science and technology [2,13,6]. Furthermore, the proliferation and large-scale distribution of smart mobile devices has fostered a growing interest for researchers to utilize these kind of devices when collecting data [16,12].
Researchers use smart mobile devices as data collection tools by employing specific applications (i.e., assessment tools), thereby gaining not only valuable data, but also experience in addressing the numerous practical challenges of undertaking successful studies [19]. Assessment tools on smart mobile devices allow for an extensive assessment and
∗Corresponding author. Tel.:+49-731-50-24-133 ; fax:+49-731-50-24-134.
E-mail address:kevin.andrews@uni-ulm.de
1877-0509 c2018 The Authors. Published by Elsevier Ltd.
This is an open access article under the CC BY-NC-ND license (http://creativecommons.org/licenses/by-nc-nd/3.0/).
evaluation of factors, both objective as well as subjective, of interest from individuals. Therefore, assessment tools are often applied in studies and, hence, being suitable for the operationalization of these factors [5].
For many domains, such as educational or social science, which often use ordinal measurements, operationalization is essential, since factors are strictly defined as measurable variables [1]. In the field of educational science, assessment tools enable researchers to create assessment tasks to determine where individuals (i.e., learners) are on the continuum of learning [10]. Furthermore, insights can be obtained about knowledge, skills, and concepts the learner has mastered and what may have been misunderstood or not yet mastered [3]. In this context, particular emphasis can be put on the
• improvement of statistical and empirical evaluations,
• gathering of additional insights about learning strengths and challenges,
• monitoring of learner progress,
• individualization of instructional quality to increase their effectiveness.
Considering these emphases, the work at hand presents an assessment tool for smart mobile devices developed in the context of a project investigating visual literacy in cultural education. Studies can be easily designed and conducted with the tool and adoptions can be made without programming a line of code. Hitherto, the assessment tool has been successfully applied to over 500 participants.
The remainder of this paper is structured as follows: Section 2 explains the project context. In Section 3, the assessment tool design is presented, followed by the use case described in Section 4. Section 5 discusses related work and, finally, Section 6 summarizes the paper and gives an outlook.
2. Context of the Project
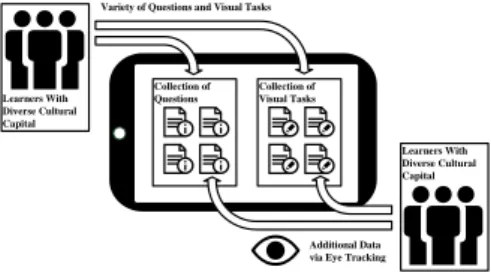
The presented assessment tool was developed in the context of a cooperative project focusing on visual literacy in cultural education1. The purpose of this project is to gain insights on how visual literacy can be fostered, operational- ized, and, hence, empirically measured. Thereby, visual literacy is a concept that defines the capability to interpret, understand, and extract information presented in images [17]. Furthermore, studies have shown that the use of ap- propriate images motivates learning processes as well as promotes the development of learning strategies. Based on this, the project analyzes the inter- (i.e., between individuals) and intra-individual (i.e., within individual) variation of motivation in learners such as pupils, students, and teachers. This includes, for example, the perception of instruc- tional quality with regard to visual literacy. Thereby, a particular emphasis is put on the effects of cultural capital (i.e., social assets like education and personality) as well as cultural-aesthetic practices (e.g., religious beliefs) of learners.
Cultural education is assessed within the European Framework of Visual Literacy (ENViL) in a series of nationwide studies across various kinds of schools (e.g., secondary school and university) in Germany [18]. To help conduct the study, an assessment tool for smart mobile devices was developed to assess the visual literacy in cultural education.
Learners With Diverse Cultural Capital Learners With
Diverse Cultural Capital
Collection of Questions
Collection of Visual Tasks Variety of Questions and Visual Tasks
Additional Data via Eye Tracking
Fig. 1. Visual Literacy in Cultural Education
Specifically, participants (i.e., learners) of the studies were asked to complete a variety of visual tasks (e.g., Completing Pictures and Men- tal Rotation) and answer a set of questions, while the assessment tool captured relevant information [8]. Moreover, primarily to strengthen the convergent validity (i.e., measures whether applied constructs are related), additional data will be collected via eye tracking. In particu- lar, with retrospective think-aloud (RTA) studies and post experience eye tracking protocols (PEEP), an endeavor is to gather additional in- sights about differences between novices and experts with regard to vi- sual literacy [7]. The objective is to gain well-founded insights on how instructions should be shaped to foster learner motivation and visual literacy. These insights will be fed back to the participating learners
and the knowledge obtained will be implemented in instructions after the project term.
1 https://www.dipf.de/en/research/current-projects/bkkb-visual-literacy-in-cultural-education?set_language=en
3. Mobile Assessment Tool Design
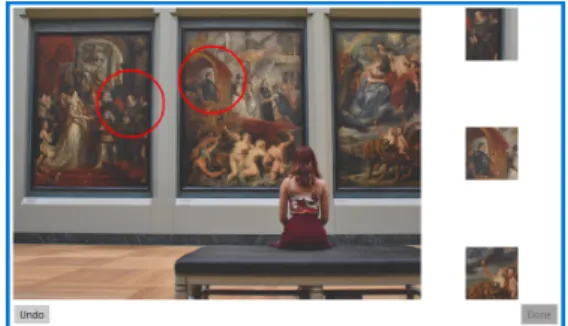
The mobile assessment tool presented in this paper is a highly extensible and configurable framework for tablet- based visual tasks. It offers a variety of items, categorized into visual tasks and questions that participants may com- plete. The visual tasks range from simple ones, such as sorting objects and identifying small details in larger images (cf. Fig.2), to complex ones, such as creating a 2D image from a 3D image and a given perspective (cf. Fig.12). As it was created specifically for conducting visual literacy studies on pupils, the assessment tool had to be built from scratch to support not only the exact study requirements, but also the additional requirements imposed when dealing with pupils. As most of the assessment takes place in classroom settings with as many as 30 pupils and only one or two supervisors, the pupils have to be completely blocked from performing actions outside of the intended scope.
In consequence, the user interface of the entire application is stripped down to an absolute bare minimum with no configuration or navigation options visible to users.
Fig. 2. Visual Task “Identify Details”
One of the main challenges when implementing the assess- ment tool was cross platform compatibility, as the target hard- ware (Windows, Android, or iOS) had not been finally specified when the development started. Furthermore, our intent was to create a highly reusable framework that could be utilized for var- ious studies, potentially conducted on other tablet, or even desk- top hardware. In any other situation, a simple way of tackling this challenge would be to implement the items utilized in the study as a web application. However, as most browsers do not allow for locking users out from basic navigation functionality and the primary use case is conducting studies with pupils, who are often unpredictable or even mischievous by nature, we were forced to implement the mobile assessment tool as a cross plat-
form mobile application. This allows for full control over the displayed visual elements and navigation controls. An example of one of the visual tasks used in the study, presented in the very restrictive user interface style necessary for dealing with children, is shown in Fig.2. To keep cross platform compatibility, in combination with full user interface control, we opted for the Xamarin Forms framework. Xamarin Forms allows us to reuse almost all code, including the user interface, across Windows, Android, and iOS devices, while still offering access to advanced features like screen recording or touch input logging, which are utilized in some of the games for collecting additional data.
However, implementing the assessment tool as a native or cross platform application, instead of a web application, conflicted with another requirement that the tool shall be extensible and highly configurable without having to update the application on all 30 tablets every time functional changes are made to individual items. Such changes, e.g., exchanging an image or changing the order in which the items are presented to study participants, can be done centrally if the tablets are just displaying a web site from a server. However, if each tablet has the application installed locally, one has to update all tablets through sideloading for every functional change. Unfortunately, one can not use the auto-updating capabilities of the various app stores, as they do not allow apps with advanced features, such as screen recording, which are required for collecting the additional data required by our use case.
To tackle these issues, we implemented a very simple server in ASP.NET Core, a lightweight and cross platform C#
framework that allows for hosting REST web services and files in a browseable folder structure. The server has only two interfaces, one that sends a list of all files it is hosting to the requesting tablet and another to receive the result data generated by participants completing the various items, which we will detail subsequently. This allows us hosting all functional resources on the server, including all texts and images, allowing them to be updated or exchanged quickly in one centralized location. When the application is started on the various tablets, they each request the complete file list from the server via a REST call, and start preloading the data to avoid communication overhead during the assessment. The server follows a lightweight style and can be hosted on any operating system on a laptop or similar device when conducting an assessment in the field.
As each of the visual tasks can have multiple variants, e.g., different images with varying difficulty levels for the task shown in Fig.2, the server has to have an extensive folder structure with all images, texts, and other files sorted by task and variant. An example of one such folder for a specific variant of one of the visual tasks is shown in Fig.3.
Fig. 3. Visual Task Variant Folder Fig. 4. Item Sequence Configuration
The contents of this folder, which constitute all the data that the variant “exhibition” of the task “identify detail”
requires to run, can be edited by manipulating the files on the server. As previously mentioned, the application will reload all files from all of these folders directly after it is opened on the tablets, without having to update the app package. The settings.csv file present in the folder can be used to change configuration options for the variant, such as time limits or instruction texts. CSV (Comma Separated Values) files can be interpreted as tables by Excel, allowing for simple editing of settings. This makes CSV files ideal for editing by researchers, as they do not need programming experience or tools for more specialized file formats, such as XML.
Furthermore, CSV files can also be used to define the sequence of items which are presented to participants, as shown in Fig.4. The example game sequence configuration instructs the application to first display an eye tracking calibration page, nine variants of a visual task called “dalli klick”, another calibration page, and, finally, two variants of a task called “ranking” in the exact order of the rows. As these configuration files are downloaded from the server at application start, the sequence of items can be changed centrally on the server and is effective immediately after re-opening the tablet application. To facilitate this, we build a stack for the item sequence from the rows of the CSV file shown in Fig.4at application startup. This stack contains all information necessary to load a specific item, i.e., the class name containing the logic of the visual task and the name of the folder on the server that contains the data for the specified task variant. In particular, this allows researchers to add a new item in the field by adding another variant to an existing visual task. This can be achieved by creating a folder with the images and settings for the variant (cf.
Fig3) as a sub-folder of the visual task on the server and adding the name of the new sub-folder in a new row of the item sequence configuration CSV file (cf. Fig.4). When the tablet application is working through the stack of items and reaches a new visual task variant, it can be displayed seamlessly, as the images and texts in the variant folder were preloaded from the server on application startup. Clearly, all variants of a visual task must use the same code.
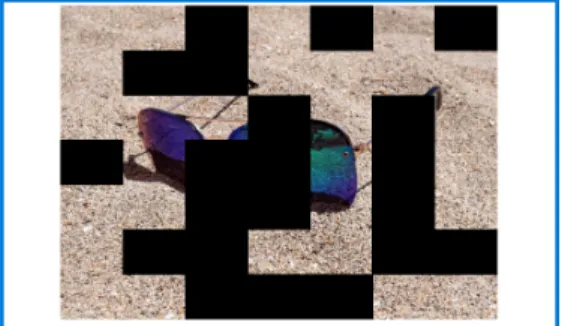
Additionally, some items have special configuration files that allow for greater customization of the visual task and its variants. An example of one such configuration file, for the picture revealing task “Dalli” (cf. Fig.5), in which an image gets revealed over time, is shown in Fig.6. The matrix configuration file defines the order in which the tiles covering the picture are removed. Again, as this is edited centrally on the server and applied to all tablets on application restart, this allows for configuration of run-time logic without touching code or the application deployed on the tablets, a huge benefit for researchers accustomed to Excel, especially when working in the field.
Fig. 5. Visual Task “Dalli”
Fig. 6. “Dalli” Matrix Configuration
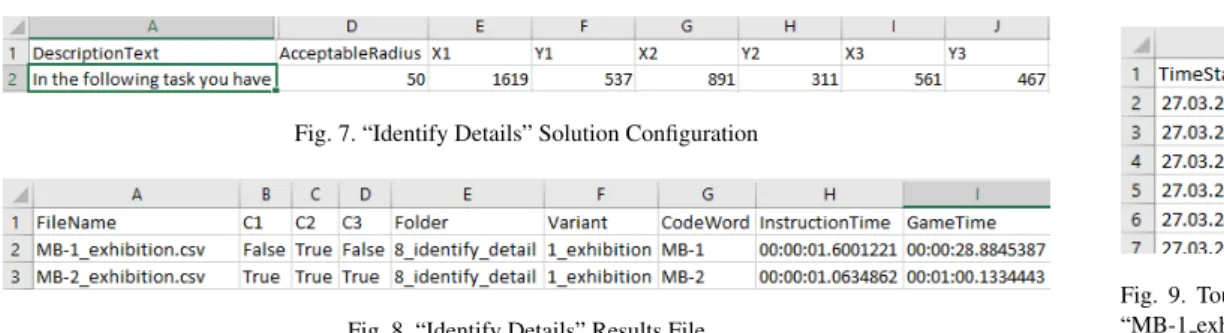
Fig. 7. “Identify Details” Solution Configuration
Fig. 8. “Identify Details” Results File
Fig. 9. Touch Tracking Log
“MB-1 exhibition.csv”
Having discussed the configuration of the items and the sequence in which these are presented to study participants, we turn to the output that is produced while the items are being completed. As the goal is to allow for mostly automated evaluation of results, some items need additional configuration to determine which user input constitutes a “correct”
solution. An example of the solution configuration for the “Identify Details” visual task is shown in Fig 7. The configuration file allows for the specification of pairs of X/Y coordinates and a radius around these that the application should rate as a correct solution when participants mark them during the assessment (cf. Fig.2).
An excerpt of the corresponding results file that is created on the server after the visual task was completed by two different participants, with the codewords MB-1 and MB-2, is shown in Fig.8. The values for C1, C2, and C3, i.e. whether the participant circled the first, second, and third detail area correctly, are automatically calculated by the application with the help of the configuration file. Furthermore, as each row represents a single assessment of one participant, additional information, such as a touch tracking log (cf. Fig.9), can be referenced in each row in the FileName column. These additional logs can be merged with the main results file in tools such as SPSS or Matlab to create heatmaps and statistical graphs of all collected results.
The final assessment capability we wish to highlight is the presentation of textual question items. Creating a generic method for presenting a question item as an arbitrarily sized table of multiple choice questions and answers, as shown in Fig.10, proved to be quite a challenge. To keep in line with the configuration style of the visual tasks, each question item is configured by three separate CSV configuration files, one containing the questions, one containing the possible answers, and one containing the additional descriptive texts. As the horizontal screen space of the tablet can be used up quickly by long questions in the resulting table columns, we had to develop a simple algorithm for scaling down the font size of the longest answers dynamically, and inserting line breaks before the font size reaches an unreadable size.
This way, these aspects, i.e., font size and line breaking, do not have to be configured by the researchers designing the question items, simplifying their workload significantly. Furthermore, as we have an arbitrary number of questions and answers belonging to a single question item, the design of the results file for the question items was challenging as well. As, at the end of an assessment, the single results file for the question items should contain the answers of all participants to all individual questions, we opted to treat each question item as a variant of a base “question” task.
This enables a style consistent with the result files for the visual tasks (cf. Fig.8), with all answers given by a single participant concerning a question item written into the columns of a single row (cf. Fig.11).
Fig. 10. Question Item
Fig. 11. Question Item Results File (Multiple Columns Hidden)
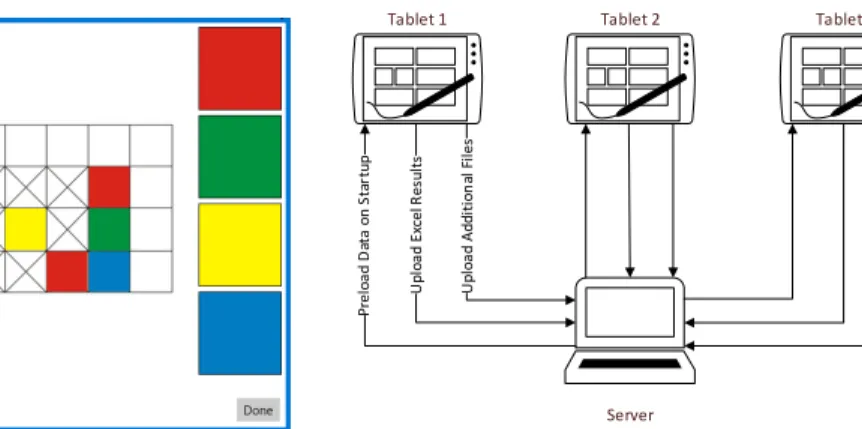
Item results, such as the ones shown in Fig.8, Fig.9, or Fig11, are generated by the application running on the various tablets during the assessment. However, as previously mentioned, the tablets are not guaranteed to have an Internet connection in the field, so uploading these results to a server on the Internet is not feasible. Furthermore, gathering all the Excel result files stored locally on the tablets would be an extremely tedious task. Instead, the tablets use the same REST web service used for preloading the data and settings files on application startup to periodically transfer results to the server. Additionally, the usage of WiFi for transferring game results allows for the transfer of larger supplemental files, such as the images produced when playing another one of the games, “Identify Perspective Orientation”, shown in Fig.12. The game provides the study participants with a palette of colors, which they have to use to create a 2D image of a 3D model from a certain perspective. This game transfers not only the Excel results files with the usual statistics on time taken, touch points, etc., but also an image file of the solution, which can be used for manual evaluation later on. An abstract schematic of the communication pattern between the application and server parts of the mobile assessment tool is shown in Fig.13.
Note that a direct WiFi connection between the tablets hosting the application and the laptop acting as the server may not always be possible as it is shown in Fig.13. This is due to the fact that the Windows drivers for many popular WiFi chipsets only support ad-hoc WiFi connections with up to eight devices, if at all. To alleviate this issue, we allow for the utilization of an additional WiFi access point or hotspot, which all tablets and the server can connect to.
Furthermore, it is possible to connect the tablets and the server to any on-premise WiFi, effectively removing range restrictions between the tablets and the server. This enables running multiple assessments in different parts of the same building concurrently with only one laptop acting as a server, as long as all participating devices are on the same local WiFi network. To this end, the tablets show a simple IP Address input dialog on startup if they cannot connect to their last known server IP address.
Finally, in the event that the WiFi becomes congested or breaks down, either during the preloading phase when the application is started on the tablets or during the assessment phase when learners are completing the visual tasks and results are being sent to the server, there are safeguards in place to prevent the application from malfunctioning. On one hand, files that are not transferred successfully in the preloading phase are automatically downloaded from the server once they become necessary for the execution of an item. On the other, results that fail to transfer to the server are cached locally on the tablet and re-transmitted once the WiFi connection becomes available again. Theoretically, if the preloading phase is completed successfully, the entire assessment can be completed without a WiFi connection as the tablets have enough memory to cache the mostly text-based assessment results for long periods of time.
In summary, this means that the goal of creating a mobile assessment tool that is configurable by non-programmer domain experts in the field was achieved. Furthermore, through our unique architecture, utilizing a preloading phase for all images, texts, and configuration files on application startup, complete reconfiguration of all assessment items is possible in a centralized location, requiring only simple spreadsheet editing software such as Excel. Finally, in contrast to a web application, our application has the advantage of preventing study participants from exiting the assessment application by navigating to other websites or changing settings in the browser, which is crucial when working with groups of younger pupils in classroom settings.
Fig. 12. Visual Task “Identify Perspective Orientation”
Server Tablet 1
Preload Data on Startup Upload Additional Files
Upload Excel Results
Tablet n Tablet 2
Fig. 13. Mobile Assessment Tool Architecture
4. Use Case
As described in Section 2, the assessment tool was developed in the context of a project focusing on the visual literacy in cultural education and has been successfully tested in practice. So far, a total of 547 participants were successfully assessed by our partners in Cologne and Frankfurt am Main. The long-term objective is to collect data from over 800 participants. The participants are recruited in 20 different German schools, located in 4 federal states of Germany, i.e., North Rhine-Westphalia, Hesse, Schleswig Holstein, and Bavaria (in planning). Thereby, the assess- ment environment is prevalently the visual arts classroom. If a visual arts classroom is not available, the assessment is conducted in a normal classroom. Further, the largest assessment class contains 30 participants and, on the other, the smallest one comprises 12 participants.
In general, the assessment tool comprises 108 items categorized into visual tasks and questions. In particular, 19 vi- sual tasks cover 61 items (i.e., each variant of a task represents an item) and 47 items are related to questions (i.e., each question represents an item). Furthermore, a paper-based questionnaire, not covered by the assessment tool, for parents is handed out to the participants and needs to be answered by their parents at home.
The procedure of the study is as follow (cf. Fig.14): Generally, all participants get an introduction before the assess- ment. In more detail, one participant of the class reads the introduction text aloud in front of all participants in the class. Afterwards, the participants need to work on a predefined sequence of visual tasks related to visual literacy and answer a number of questions about personal information and cultural capital. Thereby, the participants are asked to perform the assessment at their own pace. All emerging data is stored anonymously. Moreover, the participants need to answer all questions honestly and may ask questions at any time if there are any misunderstandings or ambigui- ties. The duration of the assessment is approximately 40 minutes. After completing all visual tasks and answering all questions, the participants are able to perform a drawing task as many times as desired for the assessment of creative imagery abilities in the later analysis. Fig.14illustrates the used study design. After completion, all data is uploaded to the server (cf. Fig. 11). Besides the expected data of 800 participants, in addition, it is planned to conduct an in- structional study during the visual arts class (i.e., ambulant assessment). Therefore, the application will be randomly started during the class. Furthermore, specific visual tasks are developed in such a way that additional data can be gathered by means of eye tracking. Accordingly, eye tracking data will be utilized for RTA as well as PEEP studies showing the playbacks of eye movements in uncued or cued stimuli (i.e., images).
Defined Sequence of Questionnaires and Visual Tasks
….
Learners Drawing Task Duration for Completion:
Approx. 40 Minutes Fig. 14. Procedure of the Study
5. Related Work
The operationalization of assessment tools in the context of smart mobile devices has been addressed by various other research works. For example, the authors of [15] demonstrate how domain experts can be empowered when implementing robust smart mobile data collection applications using a model-driven framework related to end-user programming. In turn, [14] presents the graphical domain-specific language MAML, which enables the automatic generation of native mobile business applications. Moreover, an approach for the development of mobile applications in the context of health care organization is introduced in [11]. With a stronger involvement of clinicians, a method- ology for the creation of educational applications for smart mobile devices is discussed in [20]. With a focus put on mobile learning, without being limited by time and space, [9] illustrates the benefits of learning activities using appli- cations on smart mobile devices. In the context of usability studies on smart mobile devices, a framework emphasizing the advantage of study design on such devices is presented in [4]. However, a configurable assessment tool as shown here, especially in the context of educational studies, was not presented by other works so far.
6. Summary and Outlook
This paper gave insights into the architecture and framework of an assessment tool developed in the context of a project focusing on visual literacy in cultural education for smart mobile devices. Furthermore, the successful applica- tion of the assessment tool in a large-scale educational study with more than 500 participants so far is shown therein.
Currently, the assessment of further participants with the presented tool is in progress with the objective to assess at least 800 participants. Moreover, additional retrospective think-aloud as well as post experience eye tracking proto- cols studies are planned for the future with the features and support that are already realized in the assessment tool.
Due to the fact that the assessment tool, including its architecture and employed framework have been developed in a cross-platform and cross-device fashion, it can be re-used for similar studies in the visual literacy or similar contexts.
Furthermore, the study design (i.e., the sequence of visual tasks and questions) can be individually customized. Fi- nally, extensions and adaptations can be implemented in the assessment tool following emerging requirements without the need for programming.
Acknowledgment
The project BKKB is funded by the Bundesministerium f¨ur Forschung und Bildung (BMBF).
References
[1] Amo, C., Cousins, J. B., 2007. Going Through the Process: An Examination of the Operationalization of Process Use in Empirical Research on Evaluation. New Directions for Evaluation (116), 5–26.1
[2] Boruff, J. T., Storie, D., 2014. Mobile Devices in Medicine: A Survey of How Medical Students, Residents, and Faculty use Smartphones and other Mobile Devices to Find Information. Journal of the Medical Library Association: JMLA 102 (1).1
[3] Cobcroft, R. S., Towers, S. J., Smith, J. E., Bruns, A., 2006. Mobile Learning in Review: Opportunities and Challenges for Learners, Teachers, and Institutions. Online Learning and Teaching, 21–30.1
[4] Coursaris, C. K., Kim, D. J., 2011. A Meta-Analytical Review of Empirical Mobile Usability Studies. Journal of Usability Studies 6 (3), 117–171.5
[5] Dearnley, C., Taylor, J., Hennessy, S., Parks, M., Coates, C., Haigh, J., Fairhall, J., Riley, K., Dransfield, M., 2009. Using Mobile Technologies for Assessment and Learning in Practice Settings: Outcomes of Five Case Studies. International Journal on E-Learning 8 (2), 193–207.1 [6] El-Hussein, M. O. M., Cronje, J. C., 2010. Defining Mobile Learning in the Higher Education Landscape. Journal of Educational Technology
& Society 13 (3), 12–21.1
[7] Freeman, B., 2011. Triggered Think-Aloud Protocol: Using Eye Tracking to Improve Usability Test Moderation. In: Proceedings of the SIGCHI Conference on Human Factors in Computing Systems. pp. 1171–1174.2
[8] Greenfield, P. M., 2009. Technology and Informal Education: What is Taught, What is Learned. Science 323 (5910), 69–71.2
[9] Hwang, G.-J., Chang, H.-F., 2011. A formative assessment-based mobile learning approach to improving the learning attitudes and achieve- ments of students. Computers & Education 56 (4), 1023–1031.5
[10] Hwang, G.-J., Tsai, C.-C., 2011. Research Trends in Mobile and Ubiquitous Learning: A Review of Publications in Selected Journals from 2001 to 2010. British Journal of Educational Technology 42 (4), 65–70.1
[11] Khambati, A., Grundy, J., Warren, J., Hosking, J., 2008. Model-Driven Development of Mobile Personal Health Care Applications. In: Proc Int’l Conf on Automated Software Engineering. IEEE Computer Society, pp. 467–470.5
[12] Kim, S., Mankoff, J., Paulos, E., 2013. Sensr: Evaluating a Flexible Framework for Authoring Mobile Data-Collection Tools for Citizen Science. In: Proceedings of the 2013 conference on Computer supported cooperative work. ACM, pp. 1453–1462.1
[13] Lane, N. D., Miluzzo, E., Lu, H., Peebles, D., Choudhury, T., Campbell, A. T., 2010. A Survey of Mobile Phone Sensing. IEEE Communications Magazine 48 (9), 140–150.1
[14] Rieger, C., Kuchen, H., 2018. A Process-Oriented Modeling Approach for Graphical Development of Mobile Business Apps. Computer Languages, Systems & Structures 53, 43–58.5
[15] Schobel, J., Pryss, R., Schickler, M., Ruf-Leuschner, M., Elbert, T., Reichert, M., 2016. End-User Programming of Mobile Services: Empow- ering Domain Experts to Implement Mobile Data Collection Applications. In: Int’l Conf on Mobile Services (MS). IEEE, pp. 1–8.5 [16] Schobel, J., Pryss, R., Wipp, W., Schickler, M., Reichert, M., 2016. A Mobile Service Engine Enabling Complex Data Collection Applications.
In: International Conference on Service-Oriented Computing. Springer, pp. 626–633.1
[17] Stokes, S., 2002. Visual Literacy in Teaching and Learning: A Literature Perspective. E J for the Int of Tech in Edu 1 (1), 10–19.2 [18] Wagner, E., Sch¨onau, D., 2016. Common European Framework of Reference for Visual Literacy - Prototype. Waxmann.2
[19] Wu, W.-H., Wu, Y.-C. J., Chen, C.-Y., Kao, H.-Y., Lin, C.-H., Huang, S.-H., 2012. Review of Trends from Mobile Learning Studies: A Meta- Analysis. Computers & Education 59 (2), 817–827.1
[20] Zhang, M., Cheow, E., Ho, C. S., Ng, B. Y., Ho, R., Cheok, C. C. S., 2014. Application of Low-Cost Methodologies for Mobile Phone App Development. JMIR mHealth and uHealth 2 (4).5